

The H-NOX protein structure adapts to different mechanisms in sensors interacting with nitric oxide
- PMID: 37564404
- PMCID: PMC10411614
- DOI: 10.1039/d3sc01685d
The H-NOX protein structure adapts to different mechanisms in sensors interacting with nitric oxide
Abstract
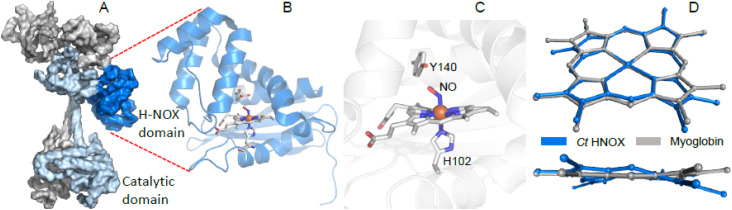
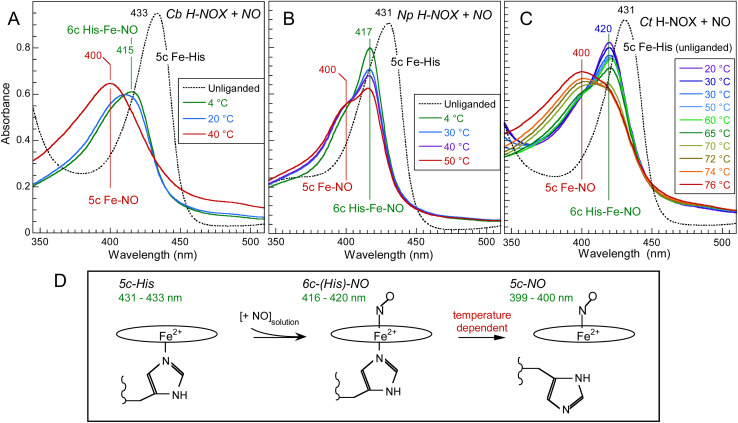
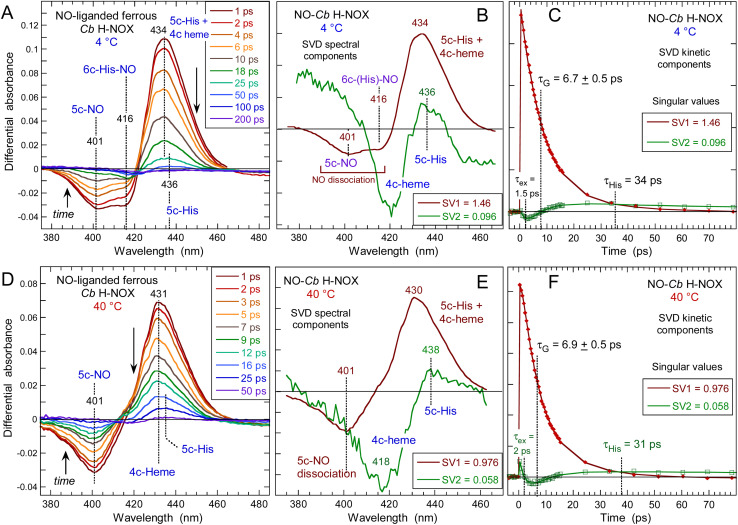
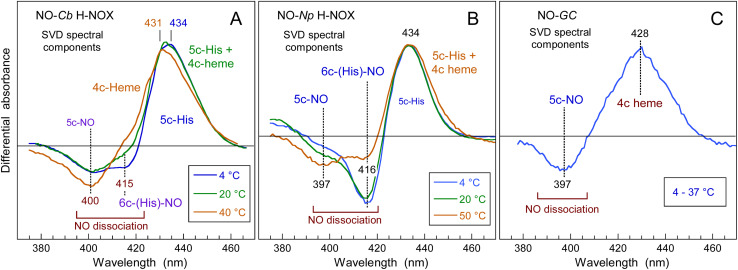
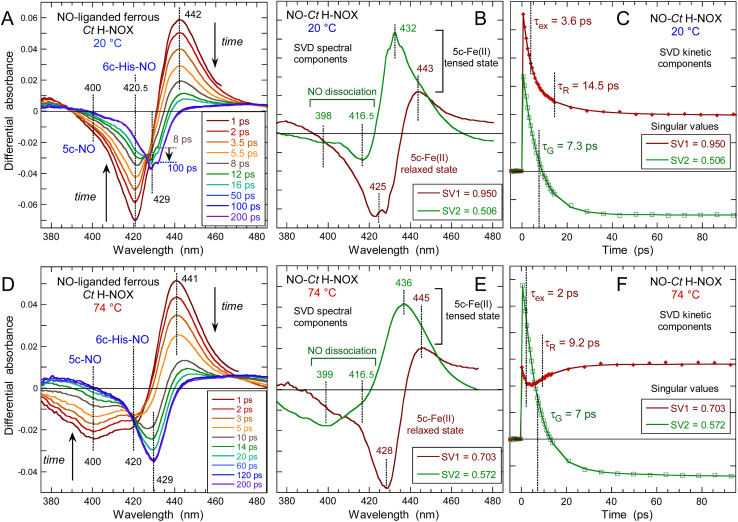
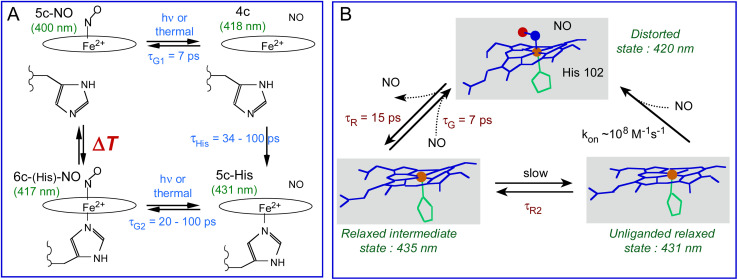
Some classes of bacteria within phyla possess protein sensors identified as homologous to the heme domain of soluble guanylate cyclase, the mammalian NO-receptor. Named H-NOX domain (Heme-Nitric Oxide or OXygen-binding), their heme binds nitric oxide (NO) and O2 for some of them. The signaling pathways where these proteins act as NO or O2 sensors appear various and are fully established for only some species. Here, we investigated the reactivity of H-NOX from bacterial species toward NO with a mechanistic point of view using time-resolved spectroscopy. The present data show that H-NOXs modulate the dynamics of NO as a function of temperature, but in different ranges, changing its affinity by changing the probability of NO rebinding after dissociation in the picosecond time scale. This fundamental mechanism provides a means to adapt the heme structural response to the environment. In one particular H-NOX sensor the heme distortion induced by NO binding is relaxed in an ultrafast manner (∼15 ps) after NO dissociation, contrarily to other H-NOX proteins, providing another sensing mechanism through the H-NOX domain. Overall, our study links molecular dynamics with functional mechanism and adaptation.
This journal is © The Royal Society of Chemistry.
Conflict of interest statement
There are no conflicts to declare.
Figures
Similar articles
-
Ultrafast dynamics of heme distortion in the O2-sensor of a thermophilic anaerobe bacterium.Commun Chem. 2021 Mar 5;4(1):31. doi: 10.1038/s42004-021-00471-9. Commun Chem. 2021. PMID: 36697566 Free PMC article.
-
Nitric oxide-sensing H-NOX proteins govern bacterial communal behavior.Trends Biochem Sci. 2013 Nov;38(11):566-75. doi: 10.1016/j.tibs.2013.08.008. Epub 2013 Oct 7. Trends Biochem Sci. 2013. PMID: 24113192 Free PMC article. Review.
-
Gaseous ligand selectivity of the H-NOX sensor protein from Shewanella oneidensis and comparison to those of other bacterial H-NOXs and soluble guanylyl cyclase.Biochimie. 2017 Sep;140:82-92. doi: 10.1016/j.biochi.2017.06.014. Epub 2017 Jun 26. Biochimie. 2017. PMID: 28655588 Free PMC article.
-
Nitric Oxide Mediates Biofilm Formation and Symbiosis in Silicibacter sp. Strain TrichCH4B.mBio. 2015 May 5;6(3):e00206-15. doi: 10.1128/mBio.00206-15. mBio. 2015. PMID: 25944856 Free PMC article.
-
How do heme-protein sensors exclude oxygen? Lessons learned from cytochrome c', Nostoc puntiforme heme nitric oxide/oxygen-binding domain, and soluble guanylyl cyclase.Antioxid Redox Signal. 2012 Nov 1;17(9):1246-63. doi: 10.1089/ars.2012.4564. Epub 2012 Apr 10. Antioxid Redox Signal. 2012. PMID: 22356101 Free PMC article. Review.
Cited by
-
Controlling the trans effect induced by nitric oxide and carbon monoxide: H93C myoglobin versus H-NOX sensors and soluble guanylate cyclase.Protein Sci. 2024 Dec;33(12):e5231. doi: 10.1002/pro.5231. Protein Sci. 2024. PMID: 39576123 Free PMC article.
-
Reactive Byproducts of Plant Redox Metabolism and Protein Functions.Acta Naturae. 2024 Oct-Dec;16(4):48-61. doi: 10.32607/actanaturae.27477. Acta Naturae. 2024. PMID: 39877007 Free PMC article.
References
LinkOut - more resources
Full Text Sources