. 2023 Jul 26:17:1223334.
doi: 10.3389/fncir.2023.1223334. eCollection 2023.

Distinctive features of the central synaptic organization of Drosophila larval proprioceptors

Affiliations

Distinctive features of the central synaptic organization of Drosophila larval proprioceptors

Marie R Greaney et al. Front Neural Circuits. .

Abstract

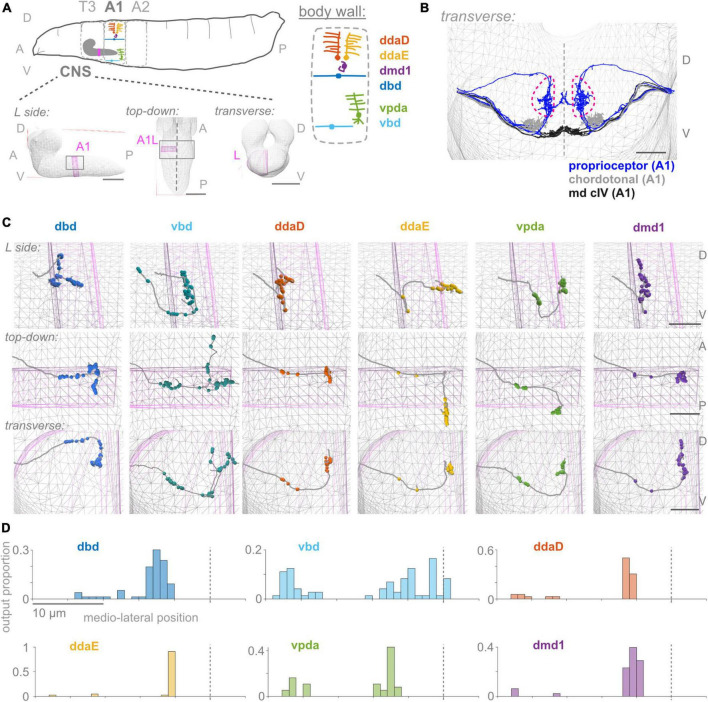
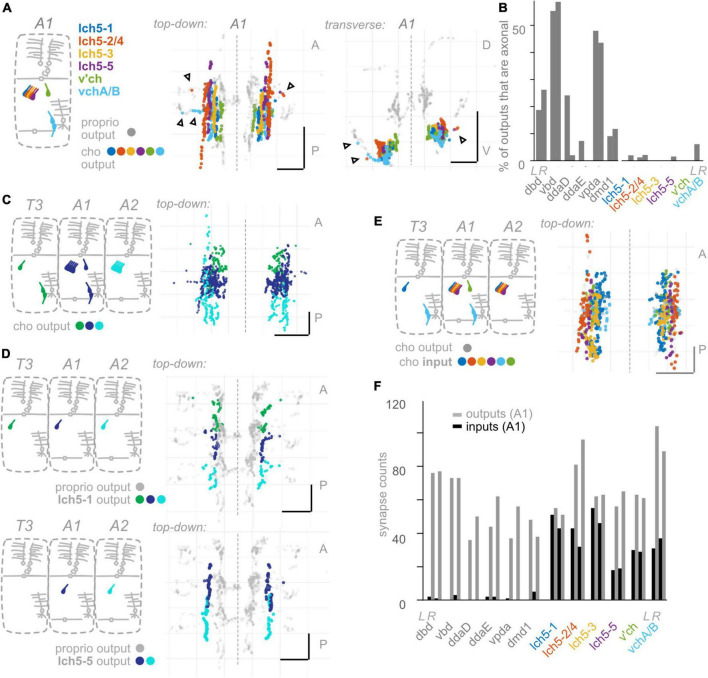
Proprioceptive feedback is critically needed for locomotor control, but how this information is incorporated into central proprioceptive processing circuits remains poorly understood. Circuit organization emerges from the spatial distribution of synaptic connections between neurons. This distribution is difficult to discern in model systems where only a few cells can be probed simultaneously. Therefore, we turned to a relatively simple and accessible nervous system to ask: how are proprioceptors' input and output synapses organized in space, and what principles underlie this organization? Using the Drosophila larval connectome, we generated a map of the input and output synapses of 34 proprioceptors in several adjacent body segments (5-6 left-right pairs per segment). We characterized the spatial organization of these synapses, and compared this organization to that of other somatosensory neurons' synapses. We found three distinguishing features of larval proprioceptor synapses: (1) Generally, individual proprioceptor types display segmental somatotopy. (2) Proprioceptor output synapses both converge and diverge in space; they are organized into six spatial domains, each containing a unique set of one or more proprioceptors. Proprioceptors form output synapses along the proximal axonal entry pathway into the neuropil. (3) Proprioceptors receive few inhibitory input synapses. Further, we find that these three features do not apply to other larval somatosensory neurons. Thus, we have generated the most comprehensive map to date of how proprioceptor synapses are centrally organized. This map documents previously undescribed features of proprioceptors, raises questions about underlying developmental mechanisms, and has implications for downstream proprioceptive processing circuits.

Keywords: connectome; nociception; proprioception; somatosensation; synapses.


Conflict of interest statement

The authors declare that the research was conducted in the absence of any commercial or financial relationships that could be construed as a potential conflict of interest.

Figures

FIGURE 1
FIGURE 1
First abdominal segment proprioceptor output synapses are distributed along the proximal and distal axon. (A) Diagrams of larval body plan, of proprioceptive neuron somata and dendrites at the larval body wall (adapted from Cheng et al., 2010; Vaadia et al., 2019), and of views of the larval CNS. The same six proprioceptive neurons are present in each abdominal hemisegment (here, A1 left). They project to neuropil segment A1 in the CNS, highlighted in pink. (B) Transverse view of reconstructed skeletons (axonal projections) in A1 of the larval connectome: proprioceptive neurons (blue), chordotonal neurons (gray), and class IV multidendritic neurons (black). Dashed pink lines demarcate the “central domain” of proprioceptive outputs. Dashed gray line: midline. (C) Three views of output synapses in the CNS made by each left side proprioceptor. Gray lines: neuron skeletons. Spheres: output synapse locations. Top subpanels: left side views; middle subpanels: top-down views; bottom-subpanels: transverse views, looking from the tail toward the head. Gray mesh: outline of larval CNS. Pink mesh: outline of A1 left side region of neuropil. (D) Distribution of output synapses along the mediolateral axis for left side A1 neurons shown in (C). Proportion of that neuron’s outputs made in 1 μm bins along the X-axis of the connectome. Views in (B,C) generated using CATMAID (Saalfeld et al., 2009). In (A): scale bars = 50 μm; (B,C): scale bars = 10 μm; scale bars equal for all axes. Throughout, dashed vertical lines: midline. D, dorsal; V, ventral; A, anterior; P, posterior; L, left side; T3, A1, A2, body segment abbreviations.
FIGURE 2
FIGURE 2
Proprioceptors show hemisegmental, but not dorsoventral or within-class, somatotopy. (A) Each proprioceptive neuron’s output synapses from segments T3–A2 or T3–A3 (for ddaD and vbd). Diagram: color scheme for neurons’ outputs from each segment; all other proprioceptor outputs plotted in gray. Note that vbd does not exist in T3. Top-down views are shown for each neuron type individually. Both left and right side neurons’ outputs are plotted. Black (unfilled) arrowheads show locations of segmental overlap for vbd neurons. Scale bars are same for all views. (B) Three views of output synapses from A1 proprioceptive neurons colored by approximate dorsoventral dendrite position at the body wall (diagram). For left side view only, right side neurons are plotted in gray. (C) Two views of output synapses from A1 class I multidendritic neurons, colored according to diagram. (D) Two views of output synapses from A1 bipolar dendrite class neurons, colored according to diagram. (E) Two views of output synapses from stretch-sensing T3–A2 dbd neurons (blue), compared to contraction-sensing proprioceptor output synapses (gray). Throughout: scale bars = 10 μm. Dashed vertical lines: midline.
FIGURE 3
FIGURE 3
Proprioceptor outputs converge in unique combinations in multiple spatial regions. (A) Two views of overlap in output synapses from segments T3–A2, colored according to diagram. (B) Three views of overlap in output synapses from all six left side proprioceptors in A1, colored according to diagram. Right side outputs plotted in gray. (C) Summary diagram of six spatial domains where unique combinations of A1 proprioceptor outputs converge, names and contributing A1 proprioceptors given beneath image. Note that some of these domains will also contain outputs from T3 or A2 proprioceptors. (D) Corresponding dendritic “receptive fields” of the six spatial domains in (C). Depicted for each spatial domain are the segment and cell type identity of the neurons that typically contribute output synapses in that area. Throughout: scale bars = 10 μm.
FIGURE 4
FIGURE 4
Proprioceptors receive few input synapses. (A) Two views of input synapses onto proprioceptive neurons in T3, A1, and A2, colored by cell type according to diagram. Output synapses from same neurons shown in gray. Scale bars = 10 μm. Dashed vertical line: midline. (B) Paired bar plots of input and output synapse counts for each proprioceptive neuron in A1. Dark bars: input synapse counts; light bars: output synapse counts. Counts are shown independently for left and right side A1 neuron of each type. (C) Stacked bar plot of input synapses onto each proprioceptive neuron, summed across T3, A1, and A2. Bottom bars (dark): total input synapses in T3-A2 from sensory neurons. Top bars (light): total input synapses in T3-A2 from other (non-sensory or unidentified) neurons.
FIGURE 5
FIGURE 5
Chordotonal (cho) neurons make fewer axonal outputs than proprioceptors, show partial hemisegmental somatotopy, and receive more inputs than proprioceptors. (A) Diagram of cho dendrites at the body wall in segment A1, and two views of output synapses made by A1 cho neurons in the CNS, colored according to diagram. Black (unfilled) arrowheads indicate locations of axonal output synapses. (B) Percentage of all output synapses that are made along the proximal axon (see section “Materials and methods”) by each proprioceptive and cho neuron in A1. Left bars in each pair: left-side A1 neuron; right bars in each pair: right-side A1 neuron. (C) Top-down view of output synapses made by all cho neurons that have been reconstructed in segments T3, A1, and A2, colored according to diagram. (D) Top-down views of output synapse locations for two example cho neurons in segments T3, A1, and A2. Proprioceptor output synapses plotted in gray for comparison. (E) Top-down view of input synapses onto all cho neurons in segment A1, colored according to diagram. Output synapses made by the same neurons plotted in gray. (F) Paired, grouped bar plot of input and output synapse counts for each proprioceptive and chordotonal neuron in A1. Left bars in each pair (dark): input synapse counts; right bars in each pair (light): output synapse counts. Left pair of bars in each group: left-side A1 neuron; right pair of bars in each group: right-side A1 neuron. Throughout: scale bars = 10 μm. Dashed vertical lines: midline.
FIGURE 6
FIGURE 6
Class IV multidendritic (md cIV) neurons make fewer axonal outputs than proprioceptors, show no hemisegmental somatotopy, and receive more inputs than proprioceptors. (A) Diagram of md cIV dendrites at the body wall in segment A1, and two views of output synapses made by A1 md cIV neurons in the CNS, colored according to diagram. Black (unfilled) arrowheads indicate locations of axonal output synapses. (B) Percentage of all output synapses that are made along the proximal axon by each proprioceptive and md cIV neuron in A1. Left bars in each pair: left-side A1 neuron; right bars in each pair: right-side A1 neuron. (C) Top-down view of output synapses made by all md cIV neurons in segments T3, A1, and A2, colored according to diagram. (D) Top-down views of output synapse locations for the example md cIV neuron ddaC in segments T3, A1, and A2. Proprioceptor output synapses plotted in gray for comparison. (E) Top-down view of input synapses onto all md cIV neurons in segment A1, colored according to diagram. Output synapses made by the same neurons plotted in gray. (F) Paired bar plot of input and output synapse counts for each proprioceptive and md cIV neuron in A1. Left bars in each pair (dark): input synapse counts; right bars in each pair (light): output synapse counts. Left pair of bars in each group: left-side A1 neuron; right pair of bars in each group: right-side A1 neuron. Throughout: scale bars = 10 μm. Dashed vertical lines: midline.
FIGURE 7
FIGURE 7
Subset of dorsal domain output synapses form monosynaptic reflex arcs onto motor neurons. (A) Two views of all output synapses made by A1 proprioceptive neurons. Synapses onto motor neurons colored in blue. (B) Stacked bar plot of output synapses in the three proximal axonal domains. Darker bars: synapses that contact motor neurons. Lighter bars: synapses that do not contact motor neurons. Counts for left- and right-side domains given separately. (C) Counts of A1 motor neurons receiving 0, 1, 2, or 3 input synapses from proprioceptors. No motor neuron received more than 3 such input synapses. (D) Table of proprioceptor synapse counts onto the seven motor neurons receiving direct proprioceptor input. Note that dbd accounts for all proprioceptor input. Rightmost column: percentage of all input synapses onto the motor neurons that come from dbdL/R. Bottom row: percentage of all output synapses made by dbd L and dbd R that are onto motor neurons. (E) Diagram of muscle targets of the two A1 motor neurons receiving bilateral proprioceptor input. Lighter blue: RP2 targets, dorsal muscles 1, 2, 3, 4, 9, 10, 19, 20 (Hoang and Chiba, 2001). Darker blue: MN-4 target, dorsal muscle 4. Although dbd is shown for reference in the adjacent segment, dbd’s motor neuron targets (and their muscle targets) are all located in the same segment. Throughout: scale bars = 10 μm. Dashed vertical lines: midline.

Similar articles

References

    1. Agrawal S., Dickinson E. S., Sustar A., Gurung P., Shepherd D., Truman J. W., et al. (2020). Central processing of leg proprioception in Drosophila. Elife 9:e60299. 10.7554/elife.60299 - DOI - PMC - PubMed
    1. Ainsley J. A., Pettus J. M., Bosenko D., Gerstein C. E., Zinkevich N., Anderson M. G., et al. (2003). Enhanced locomotion caused by loss of the Drosophila DEG/ENaC protein pickpocket1. Curr. Biol. 13 1557–1563. 10.1016/s0960-9822(03)00596-7 - DOI - PubMed
    1. Akay T., Tourtellotte W. G., Arber S., Jessell T. M. (2014). Degradation of mouse locomotor pattern in the absence of proprioceptive sensory feedback. Proc. Natl. Acad. Sci. U.S.A. 111 16877–16882. 10.1073/pnas.1419045111 - DOI - PMC - PubMed
    1. Azim E., Seki K. (2019). Gain control in the sensorimotor system. Curr. Opin. Physiol. 8 177–187. 10.1016/j.cophys.2019.03.005 - DOI - PMC - PubMed
    1. Bidaye S. S., Bockemühl T., Büschges A. (2017). Six-legged walking in insects: How CPGs, peripheral feedback, and descending signals generate coordinated and adaptive motor rhythms. J. Neurophysiol. 119 459–475. 10.1152/jn.00658.2017 - DOI - PubMed

Publication types

LinkOut - more resources