. 2023 Jul 26:14:1188351.
doi: 10.3389/fimmu.2023.1188351. eCollection 2023.

Integrative multi-omics analyses unravel the immunological implication and prognostic significance of CXCL12 in breast cancer

Affiliations

Integrative multi-omics analyses unravel the immunological implication and prognostic significance of CXCL12 in breast cancer

Zhi-Jie Gao et al. Front Immunol. .

Abstract

Background: CXCL12 is a vital factor in physiological and pathological processes, by inducing migration of multiple cells. We aimed to comprehensively detect the role of CXCL12 in breast cancer, and explore novel CXCL12-related biomarkers through integrative multi-omics analyses to build a powerful prognostic model for breast cancer patients.

Methods: Immunohistochemistry analysis of the tissue microarray was performed to evaluate the correlation between CXCL12 expression levels and breast cancer patient outcomes. Combined single-nucleus and spatial transcriptomics data was used to uncover the expression distribution of CXCL12 in breast cancer microenvironment. CXCL12-related genes were identified by WGCNA analysis. Univariate Cox and LASSO regression analyses were then conducted to screen prognostic genes from above CXCL12-related genes, followed by the construction of the CXCL12-related prognostic signature, identification of risk groups, and external validation of the prognostic signature. Analyses of biological function, mutation landscape, immune checkpoint genes and immune cells, were performed to further reveal the differences between high/low-risk groups. Paired single-cell RNA-seq and bulk RNA-seq were analyzed to further disclose the association between the risk score and the complex tumor immune microenvironment. To screen potential therapeutic agents for breast cancer patients, analyses of gene-drug correlation and sensitivity to immunotherapy were conducted.

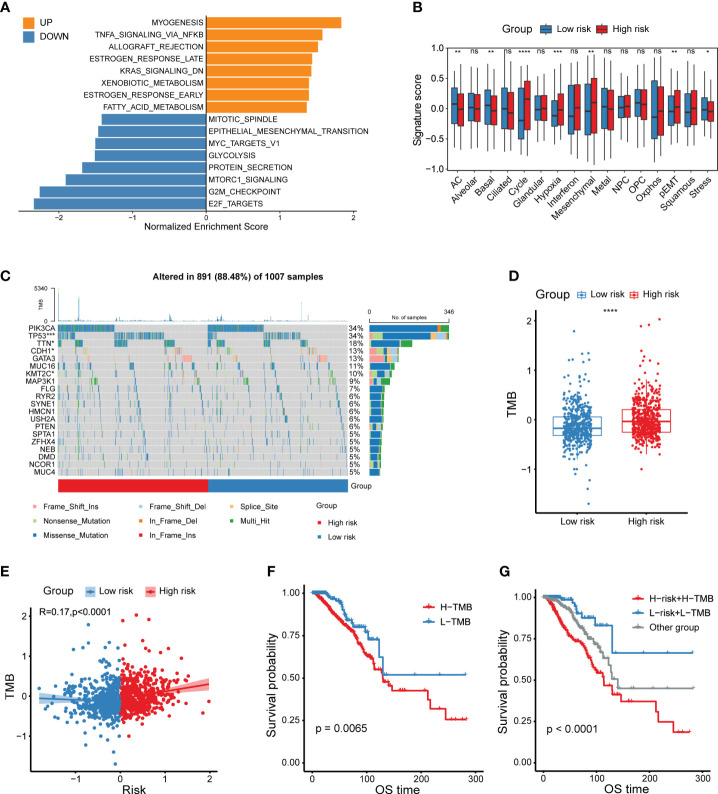
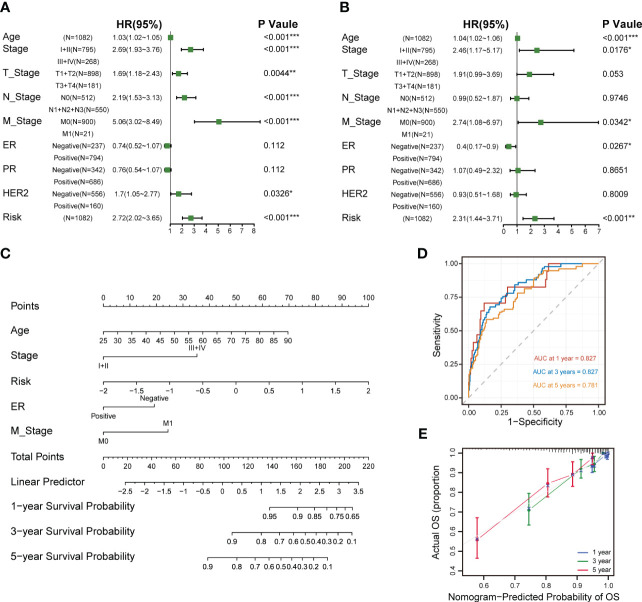
Results: High expression of CXCL12 was linked with a prolonged survival in breast cancer. A total of 402 genes were identified by WGCNA analysis and 11 genes, covering VAT1L, TMEM92, SDC1, RORB, PCSK9, NRN1, NACAD, JPH3, GJA1, BMP8B and ADAMTS2, were screened as the candidate prognostic genes. Next, the prognostic signature was built and validated using these genes to predict the outcomes of breast cancers. The high-risk group patients exhibited significantly inferior prognoses. The combination of the risk score and tumor mutational burden (TMB) had remarkably improved performance in predicting patient outcomes. Besides, high-risk group patients showed higher infiltration of M2-like macrophages. Finally, several potential anticancer drugs were identified. The high-risk group patients were more sensitive to immunotherapy but resistant to docetaxel.

Conclusions: CXCL12 has important immunological implication and prognostic significance in breast cancer. The CXCL12-related prognostic model could well predict the prognosis and treatment response of breast cancers.

Keywords: CXCL12; breast cancer; drug screening; immune landscape; prognostic signature; single-cell RNA-seq.


Conflict of interest statement

The authors declare that the research was conducted in the absence of any commercial or financial relationships that could be construed as a potential conflict of interest.

Figures

Figure 1
Figure 1
Correlation between clinical characteristics and CXCL12 in breast cancer. (A) Expression levels of CXCL12 mRNA of breast cancers in the TCGA cohort. (B, C) Expression levels of CXCL12 mRNA of breast cancers of two GEO datasets. (D–F) Association between CXCL12 and age, tumor stage and molecular subtype of breast cancers in the TCGA breast cancer cohort. (G) Kaplan-Meier survival analysis was performed on the relationship between CXCL12 and OS using the METABRIC cohort. (H) Kaplan-Meier survival analysis was performed on the relationship between CXCL12 and RFS using the METABRIC cohort. (I) Representative immunohistochemical staining of CXCL12 protein in breast cancer tissue microarrays. (J) Kaplan-Meier survival analysis was performed on the relationship between CXCL12 and DFS using our validation cohort.
Figure 2
Figure 2
Combined analysis of snRNA-seq and spatial transcriptomics reveals the expression pattern of CXCL12 in breast cancer. (A) UMAP plot showing the major cell subpopulations in breast cancer. (B) Bubble heatmap showing expression levels of selected signature genes in breast cancer. Dot size indicates fraction of expressing cells, colored based on normalized expression levels. (C) UMAP plot showing the expression of CXCL12 in breast cancer. (D) The spatial image reveals the expression distribution of CXCL12 in breast cancer. (E) Scaled deconvolution values for CAFs overlaid onto tissue spots. (F) Boxplot showing the signature score of CAFs in CXCL12high and CXCL12low spots. Paired two-sided Wilcoxon test.
Figure 3
Figure 3
Screening of CXCL12-related genes and construction as well as validation of a CXCL12-related prognostic signature in breast cancer. (A, B) Correlation analysis of modules with traits yielded eight non-gray modules, with the red module considered to be the most relevant module for CXCL12. (C) Scatter plot of the red module. (D) Kaplan-Meier survival analysis was performed on the relationship between the risk score and OS using the TCGA training cohort. (E) The rank of risk scores in the TCGA training cohort. (F) Survival status in the TCGA training cohort. (G) Time-dependent ROC curve analysis of the prognostic model (1, 2, 3, and 5 years) in the TCGA training cohort. (H) Kaplan-Meier survival analysis was performed on the relationship between the risk score and OS using the GSE19615 validation cohort. (I) The rank of risk scores in the GSE19615 validation cohort. (J) Survival status in the GSE19615 validation cohort. (K) Time-dependent ROC curve analysis of the prognostic model (1-, 2-, 3-, and 5-year) in the GSE19615 validation cohort.
Figure 4
Figure 4
Functional and genomic features of CXCL12-related risk score-based classification. (A) Bar plot showing different pathways enriched in high/low-risk groups of breast cancer calculated by GSEA. (B) Boxplots showing the signature score of 16 cancer cell states in high/low-risk groups of breast cancer scored by GSVA. Paired two-sided Wilcoxon test. (C) Waterfall plot represents the mutation distribution of the most frequently mutated genes in high/low-risk groups. (D) Boxplot showing the levels of TMB in high/low-risk groups. Paired two-sided Wilcoxon test. (E) Scatter plot showing the correlation between the risk score and TMB in the TCGA breast cancer cohort. (F) Kaplan-Meier survival analysis was performed on the relationship between TMB and OS in the TCGA breast cancer cohort. (G) Kaplan-Meier survival analysis was performed on the relationship between combination of TMB and the risk score and OS in the TCGA breast cancer cohort. The asterisks represent the statistical P value (*p<0.05; **p<0.01; ***p <.001; ****p < 0.0001; ns p>0.05).
Figure 5
Figure 5
Dissection of tumor immune microenvironment features based on the CXCL12-related prognostic signature. (A) Bar plot of the correlation between immunomodulators and the risk score in the TCGA breast cancer cohort. (B) Boxplots showing the proportion of 22 immune cells in high/low-risk groups of breast cancer estimated by CIBERSORT. Paired two-sided Wilcoxon test. (C–E) Scatter plots showing the correlation between the risk score and the proportion of M2-like macrophages, CD8+ T cells and activated NK cells in the TCGA breast cancer cohort. The asterisks represent the statistical P value (*p<0.05; **p<0.01; ***p <.001; ****p < 0.0001; ns p>0.05).
Figure 6
Figure 6
scRNA-seq analysis of the tumor immune microenvironment features based on the CXCL12-related prognostic signature. (A) UMAP plot showing the major cell subpopulations in breast cancers. (B) Bubble heatmap showing expression levels of selected signature genes in breast cancers. Dot size indicates fraction of expressing cells, colored based on normalized expression levels. (C) UMAP plot showing the expression of CXCL12 in breast cancer. (D) The rank of risk scores based on the bulk RNA-seq expression in the GSE176078 cohort. (E) Relative proportions of diverse cell types across high/low-risk tumors. (F) UMAP plot showing the diverse subsets of myeloid cells in breast cancers. (G) Bubble heatmap showing expression levels of selected signature genes for myeloid cells in breast cancers. Dot size indicates fraction of expressing cells, colored based on normalized expression levels. (H) Relative proportions of diverse subpopulations of myeloid cells across high/low-risk tumors. (I) Boxplot showing the M2-like macrophage signature scores in the macrophage subset of high/low-risk tumors. Paired two-sided Wilcoxon test. The asterisks represent the statistical P value (****p < 0.0001).
Figure 7
Figure 7
High- and low-risk group patients differ in drug sensitivity and response to immunotherapy. (A) Bubble plot showing the relationship between drugs, risk score, and model genes. (B) Boxplot showing the comparison of IC50 of docetaxel between high- and low-risk groups, and scatter plot showing the correlation between the IC50 of drugs and the risk score in the TCGA breast cancer cohort. (C) Kaplan-Meier survival analysis was performed on the relationship between the risk score and OS in the IMvigor210 immunotherapy cohort.
Figure 8
Figure 8
Establishment and assessment of the nomogram survival model. (A) Univariate analysis for the clinicopathologic characteristics and the risk score in TCGA cohort. (B) Multivariate analysis for the clinicopathologic characteristics and the risk score in the TCGA breast cancer cohort. (C) A nomogram was established to predict the prognostic of breast cancers. (D) Time-dependent ROC curve analysis of the nomogram (1-, 3-, and 5-year) in the TCGA breast cancer cohort. (E) Calibration plots showing the probability of 1-, 3-, and 5-year OS in the TCGA breast cancer cohort (*p<0.05; **p<0.01; ***p <.001; ****p < 0.0001; ns p>0.05).

Similar articles

Cited by

References

    1. Sung H, Ferlay J, Siegel RL, Laversanne M, Soerjomataram I, Jemal A, et al. . Global cancer statistics 2020: GLOBOCAN estimates of incidence and mortality worldwide for 36 cancers in 185 countries. CA Cancer J Clin (2021) 71(3):209–49. doi: 10.3322/caac.21660 - DOI - PubMed
    1. Siegel RL, Miller KD, Fuchs HE, Jemal A. Cancer statistics, 2022. CA A Cancer J Clin (2022) 72(1):7–33. doi: 10.3322/caac.21708 - DOI - PubMed
    1. Ribas A, Wolchok JD. Cancer immunotherapy using checkpoint blockade. Science (2018) 359(6382):1350–5. doi: 10.1126/science.aar4060 - DOI - PMC - PubMed
    1. Griffith JW, Sokol CL, Luster AD. Chemokines and chemokine receptors: positioning cells for host defense and immunity. Annu Rev Immunol (2014) 32:659–702. doi: 10.1146/annurev-immunol-032713-120145 - DOI - PubMed
    1. Bonecchi R, Graham GJ. Atypical chemokine receptors and their roles in the resolution of the inflammatory response. Front Immunol (2016) 7:224. doi: 10.3389/fimmu.2016.00224 - DOI - PMC - PubMed