. 2023 Sep;133(6):484-504.
doi: 10.1161/CIRCRESAHA.123.322929. Epub 2023 Aug 11.

CCND2 Modified mRNA Activates Cell Cycle of Cardiomyocytes in Hearts With Myocardial Infarction in Mice and Pigs

Affiliations

CCND2 Modified mRNA Activates Cell Cycle of Cardiomyocytes in Hearts With Myocardial Infarction in Mice and Pigs

Jiacheng Sun et al. Circ Res. 2023 Sep.

Abstract

Background: Experiments in mammalian models of cardiac injury suggest that the cardiomyocyte-specific overexpression of CCND2 (cyclin D2, in humans) improves recovery from myocardial infarction (MI). The primary objective of this investigation was to demonstrate that our specific modified mRNA translation system (SMRTs) can induce CCND2 expression in cardiomyocytes and replicate the benefits observed in other studies of cardiomyocyte-specific CCND2 overexpression for myocardial repair.

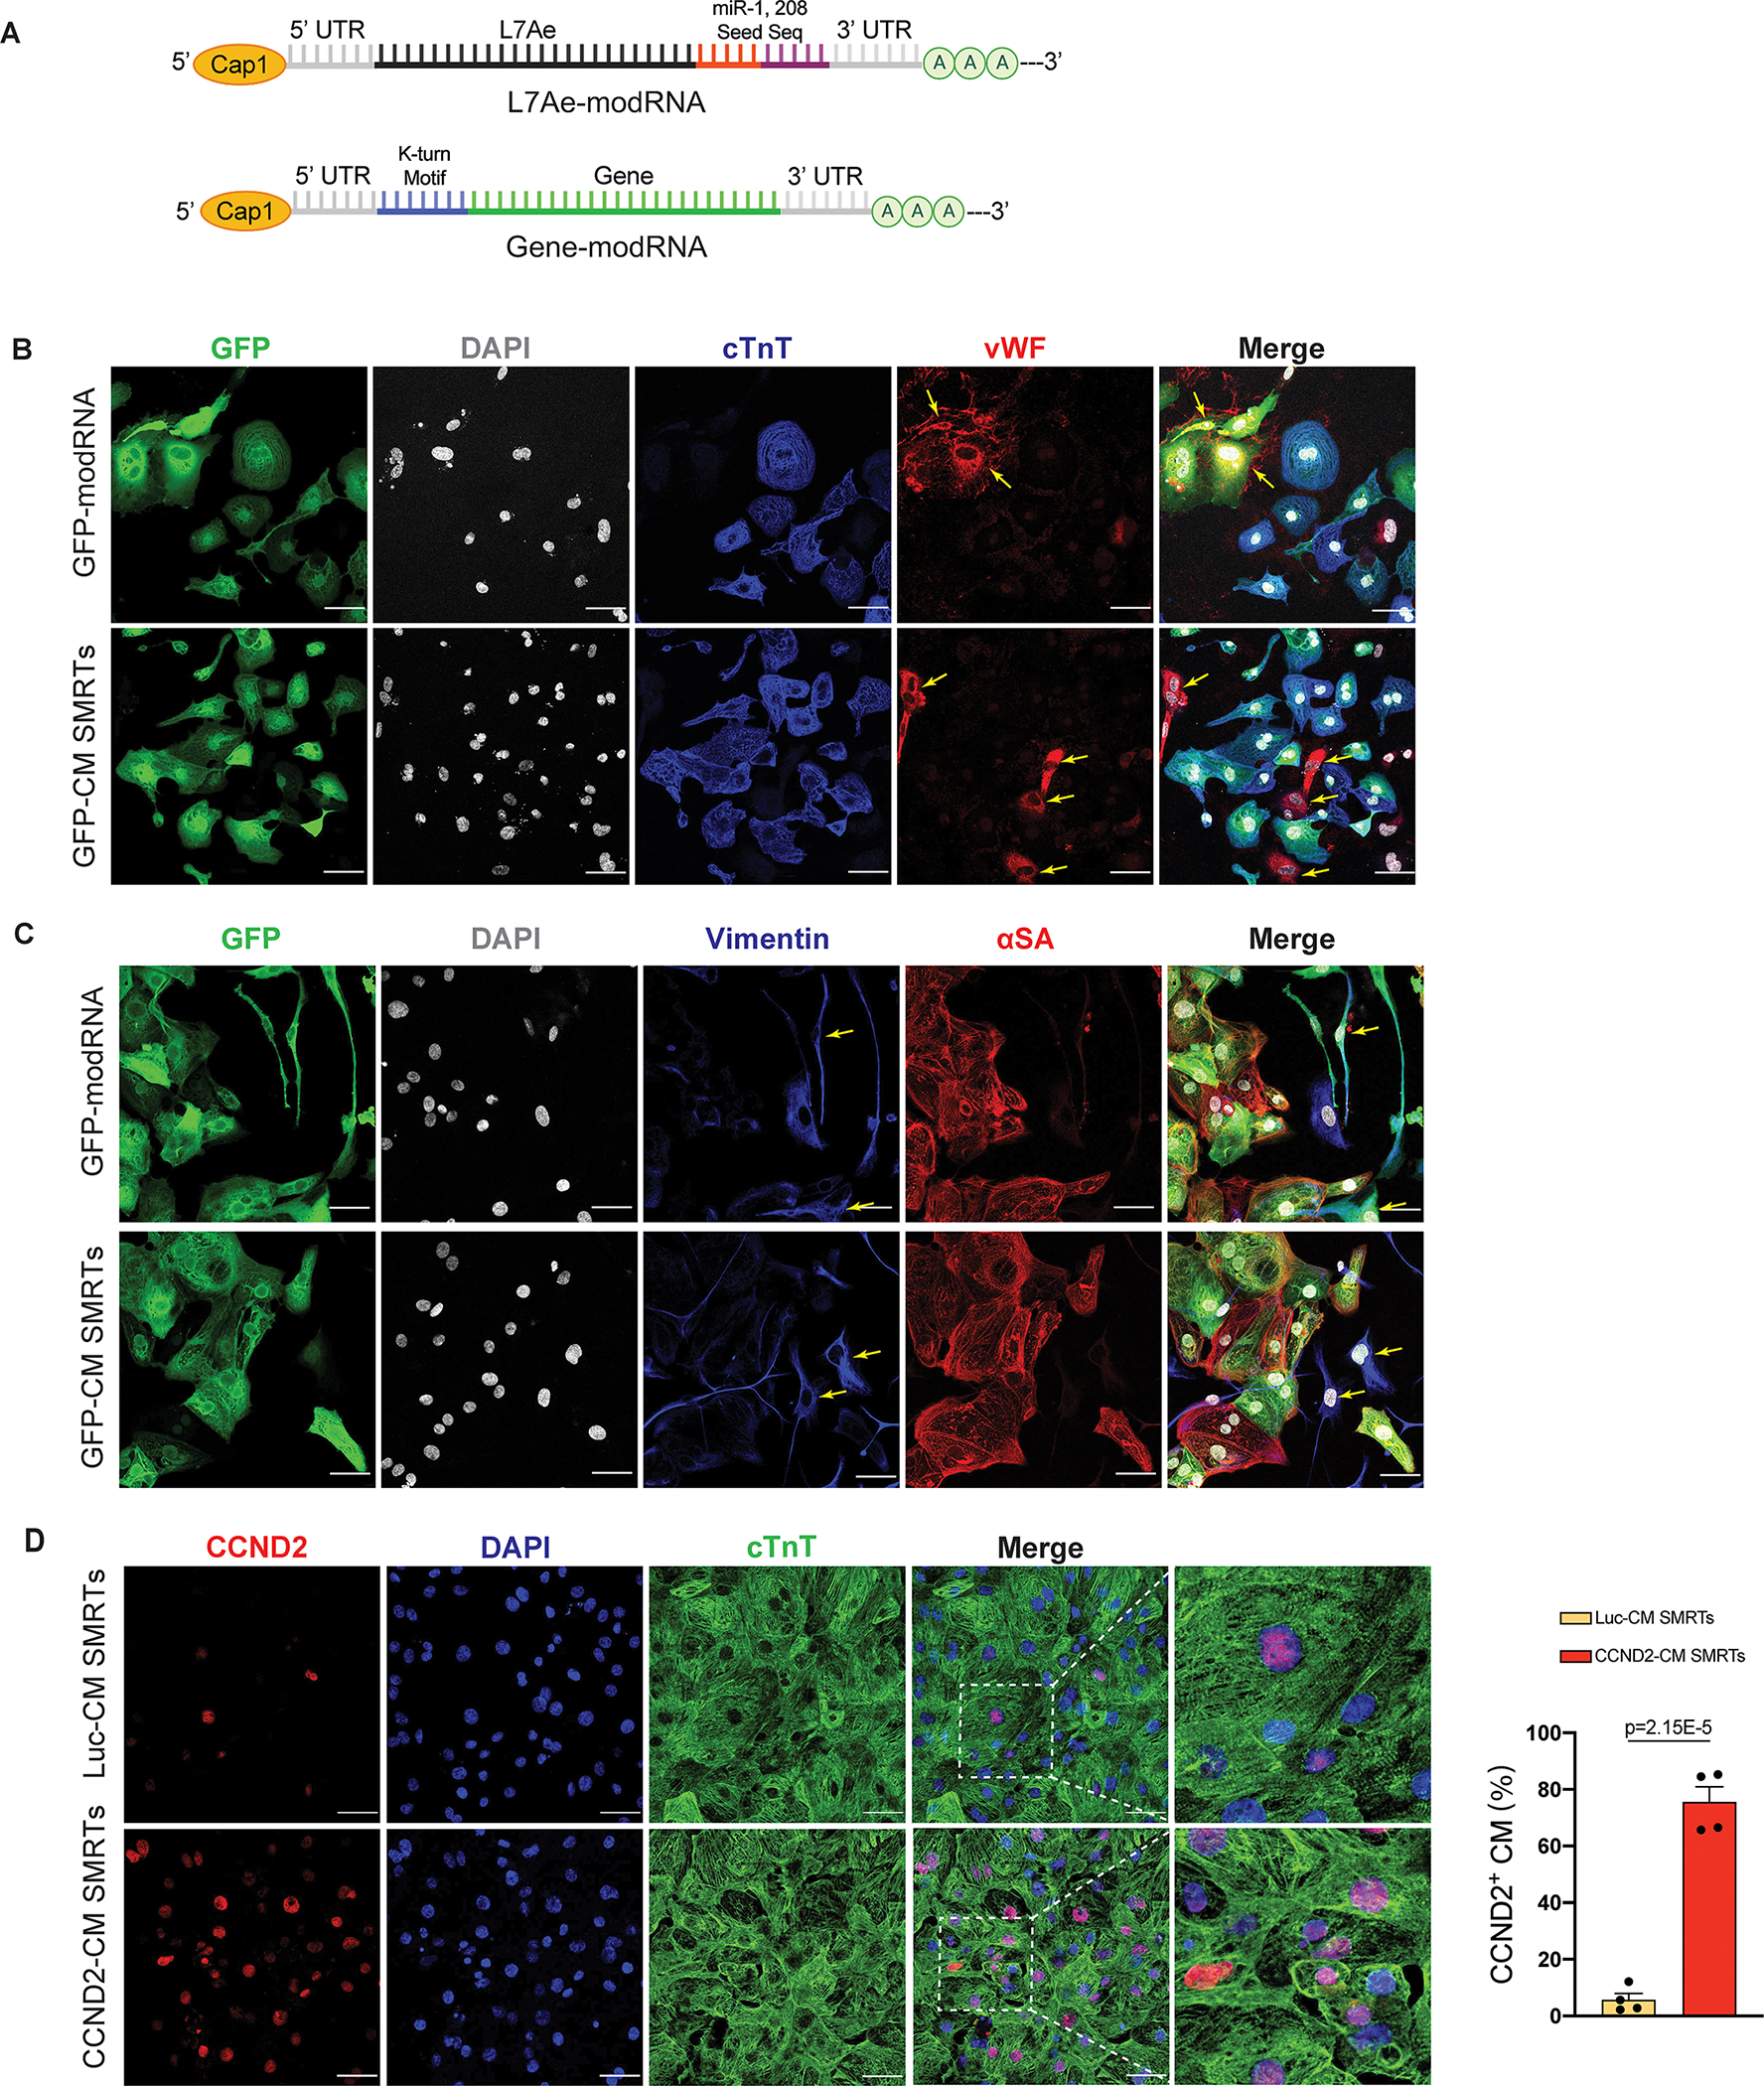
Methods: The CCND2-cardiomyocyte-specific modified mRNA translation system (cardiomyocyte SMRTs) consists of 2 modRNA constructs: one codes for CCND2 and contains a binding site for L7Ae, and the other codes for L7Ae and contains recognition elements for the cardiomyocyte-specific microRNAs miR-1 and miR-208. Thus, L7Ae suppresses CCND2 translation in noncardiomyocytes but is itself suppressed by endogenous miR-1 and -208 in cardiomyocytes, thereby facilitating cardiomyocyte-specific CCND2 expression. Experiments were conducted in both mouse and pig models of MI, and control assessments were performed in animals treated with an SMRTs coding for the cardiomyocyte-specific expression of luciferase or green fluorescent protein (GFP), in animals treated with L7Ae modRNA alone or with the delivery vehicle, and in Sham-operated animals.

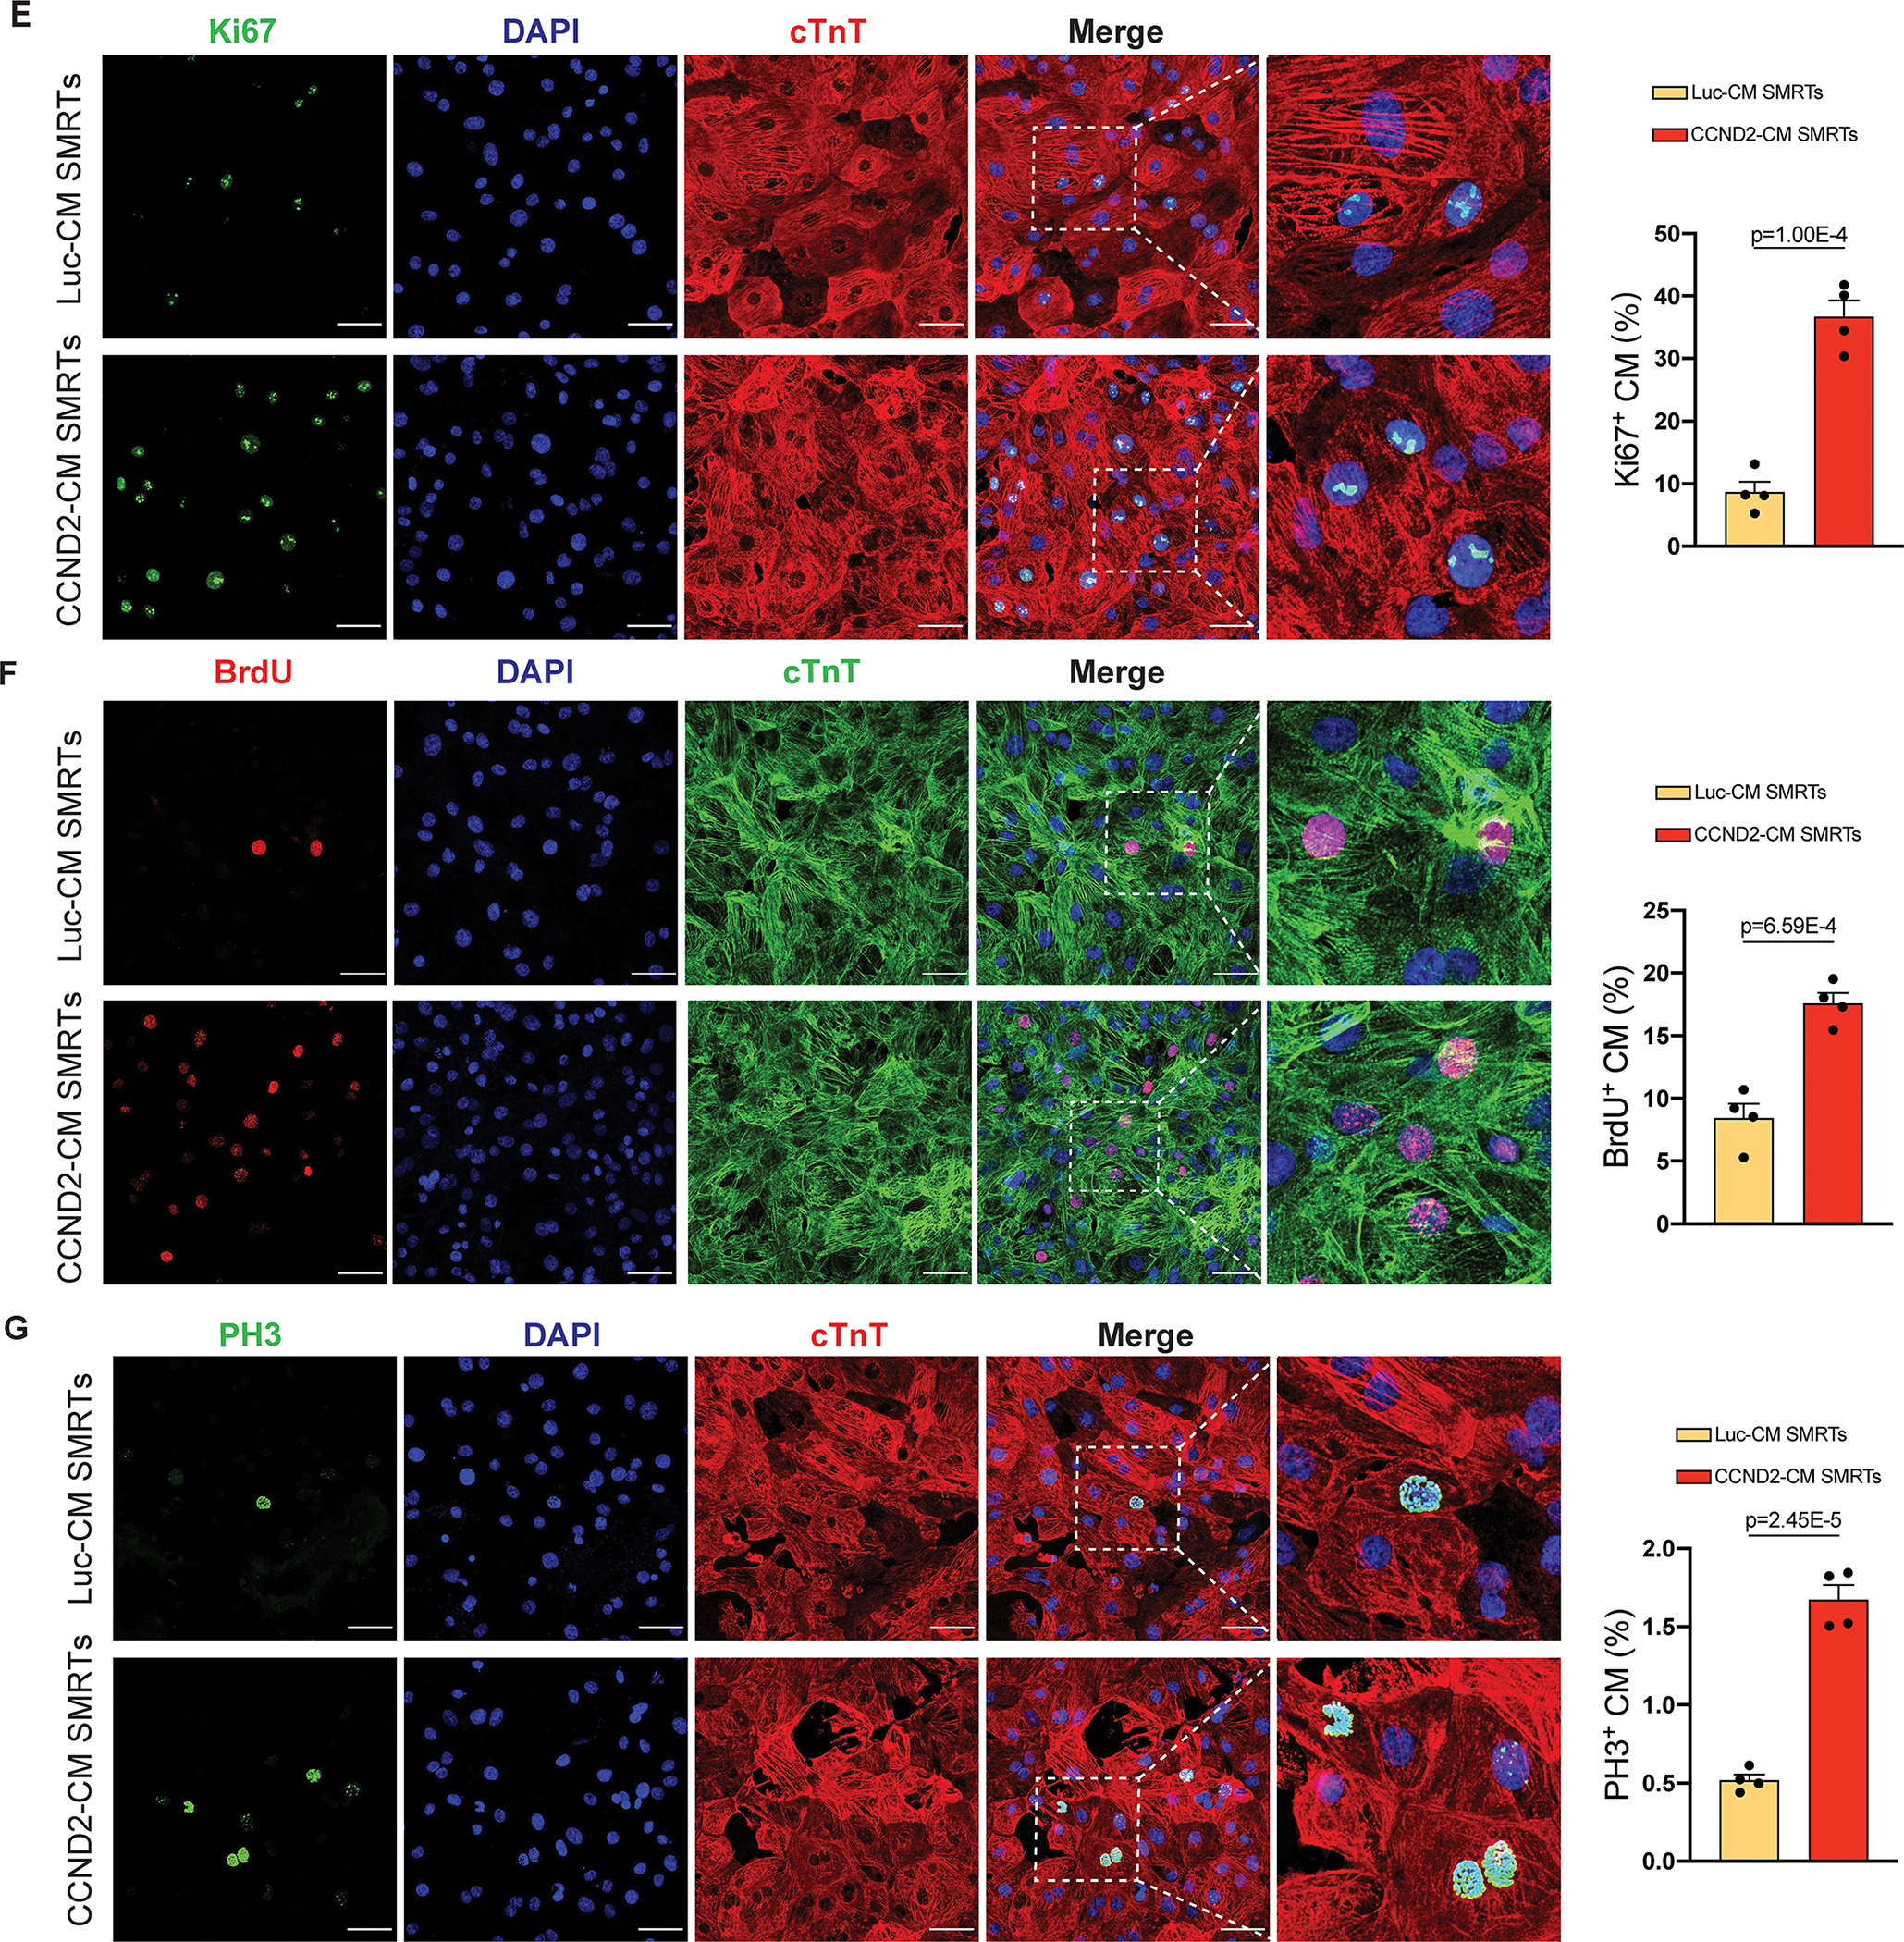
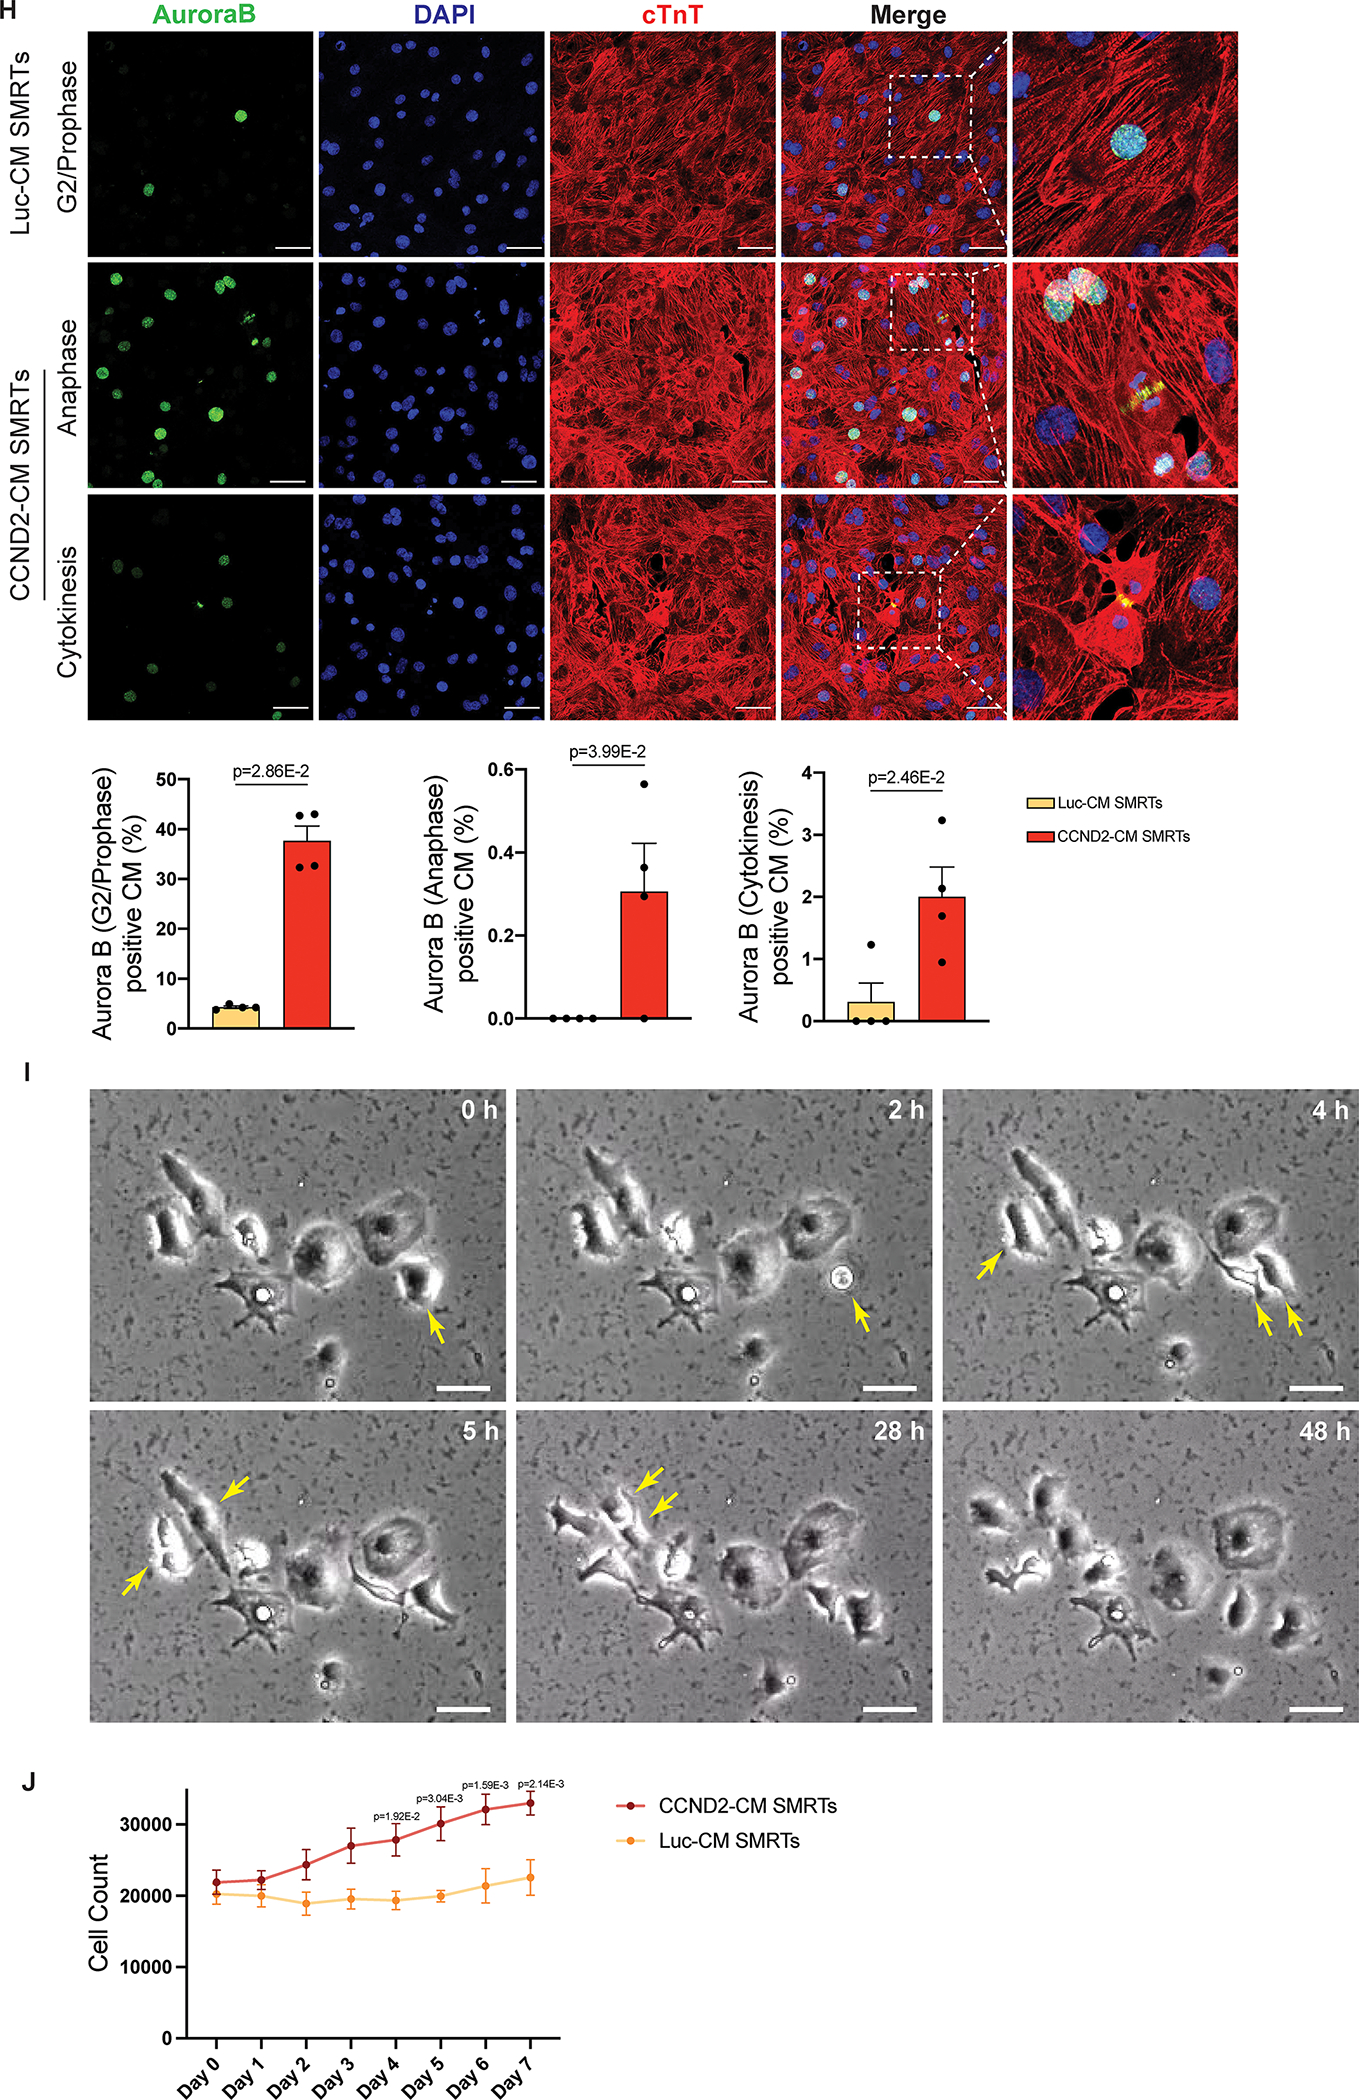
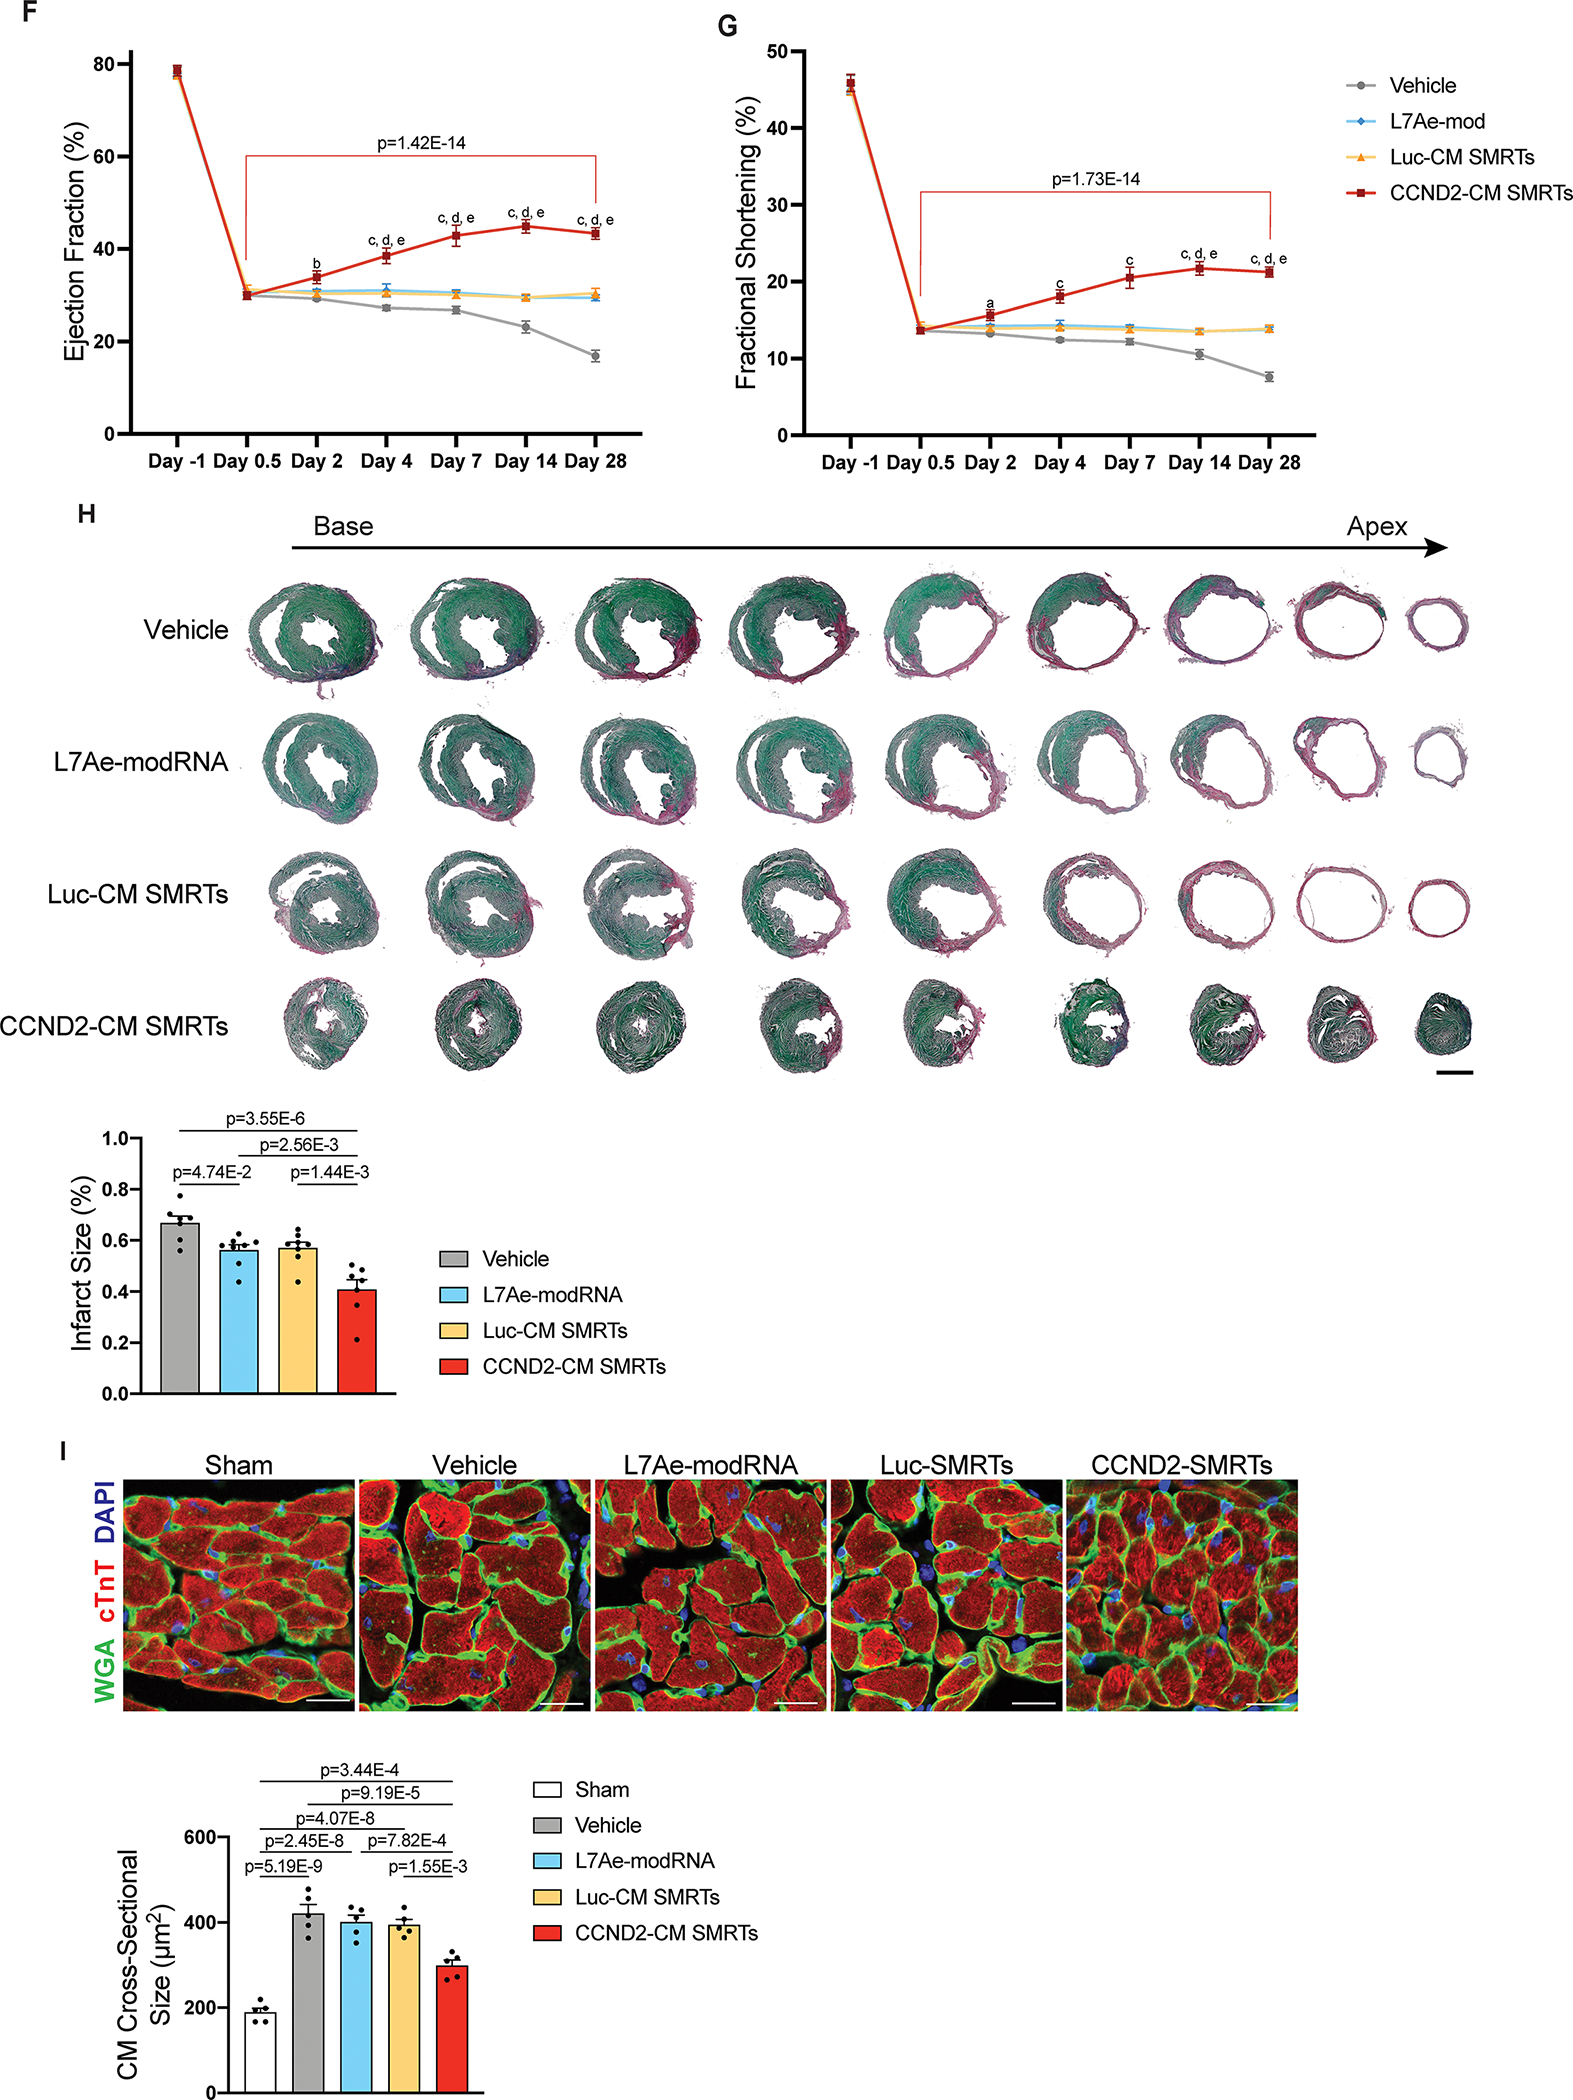
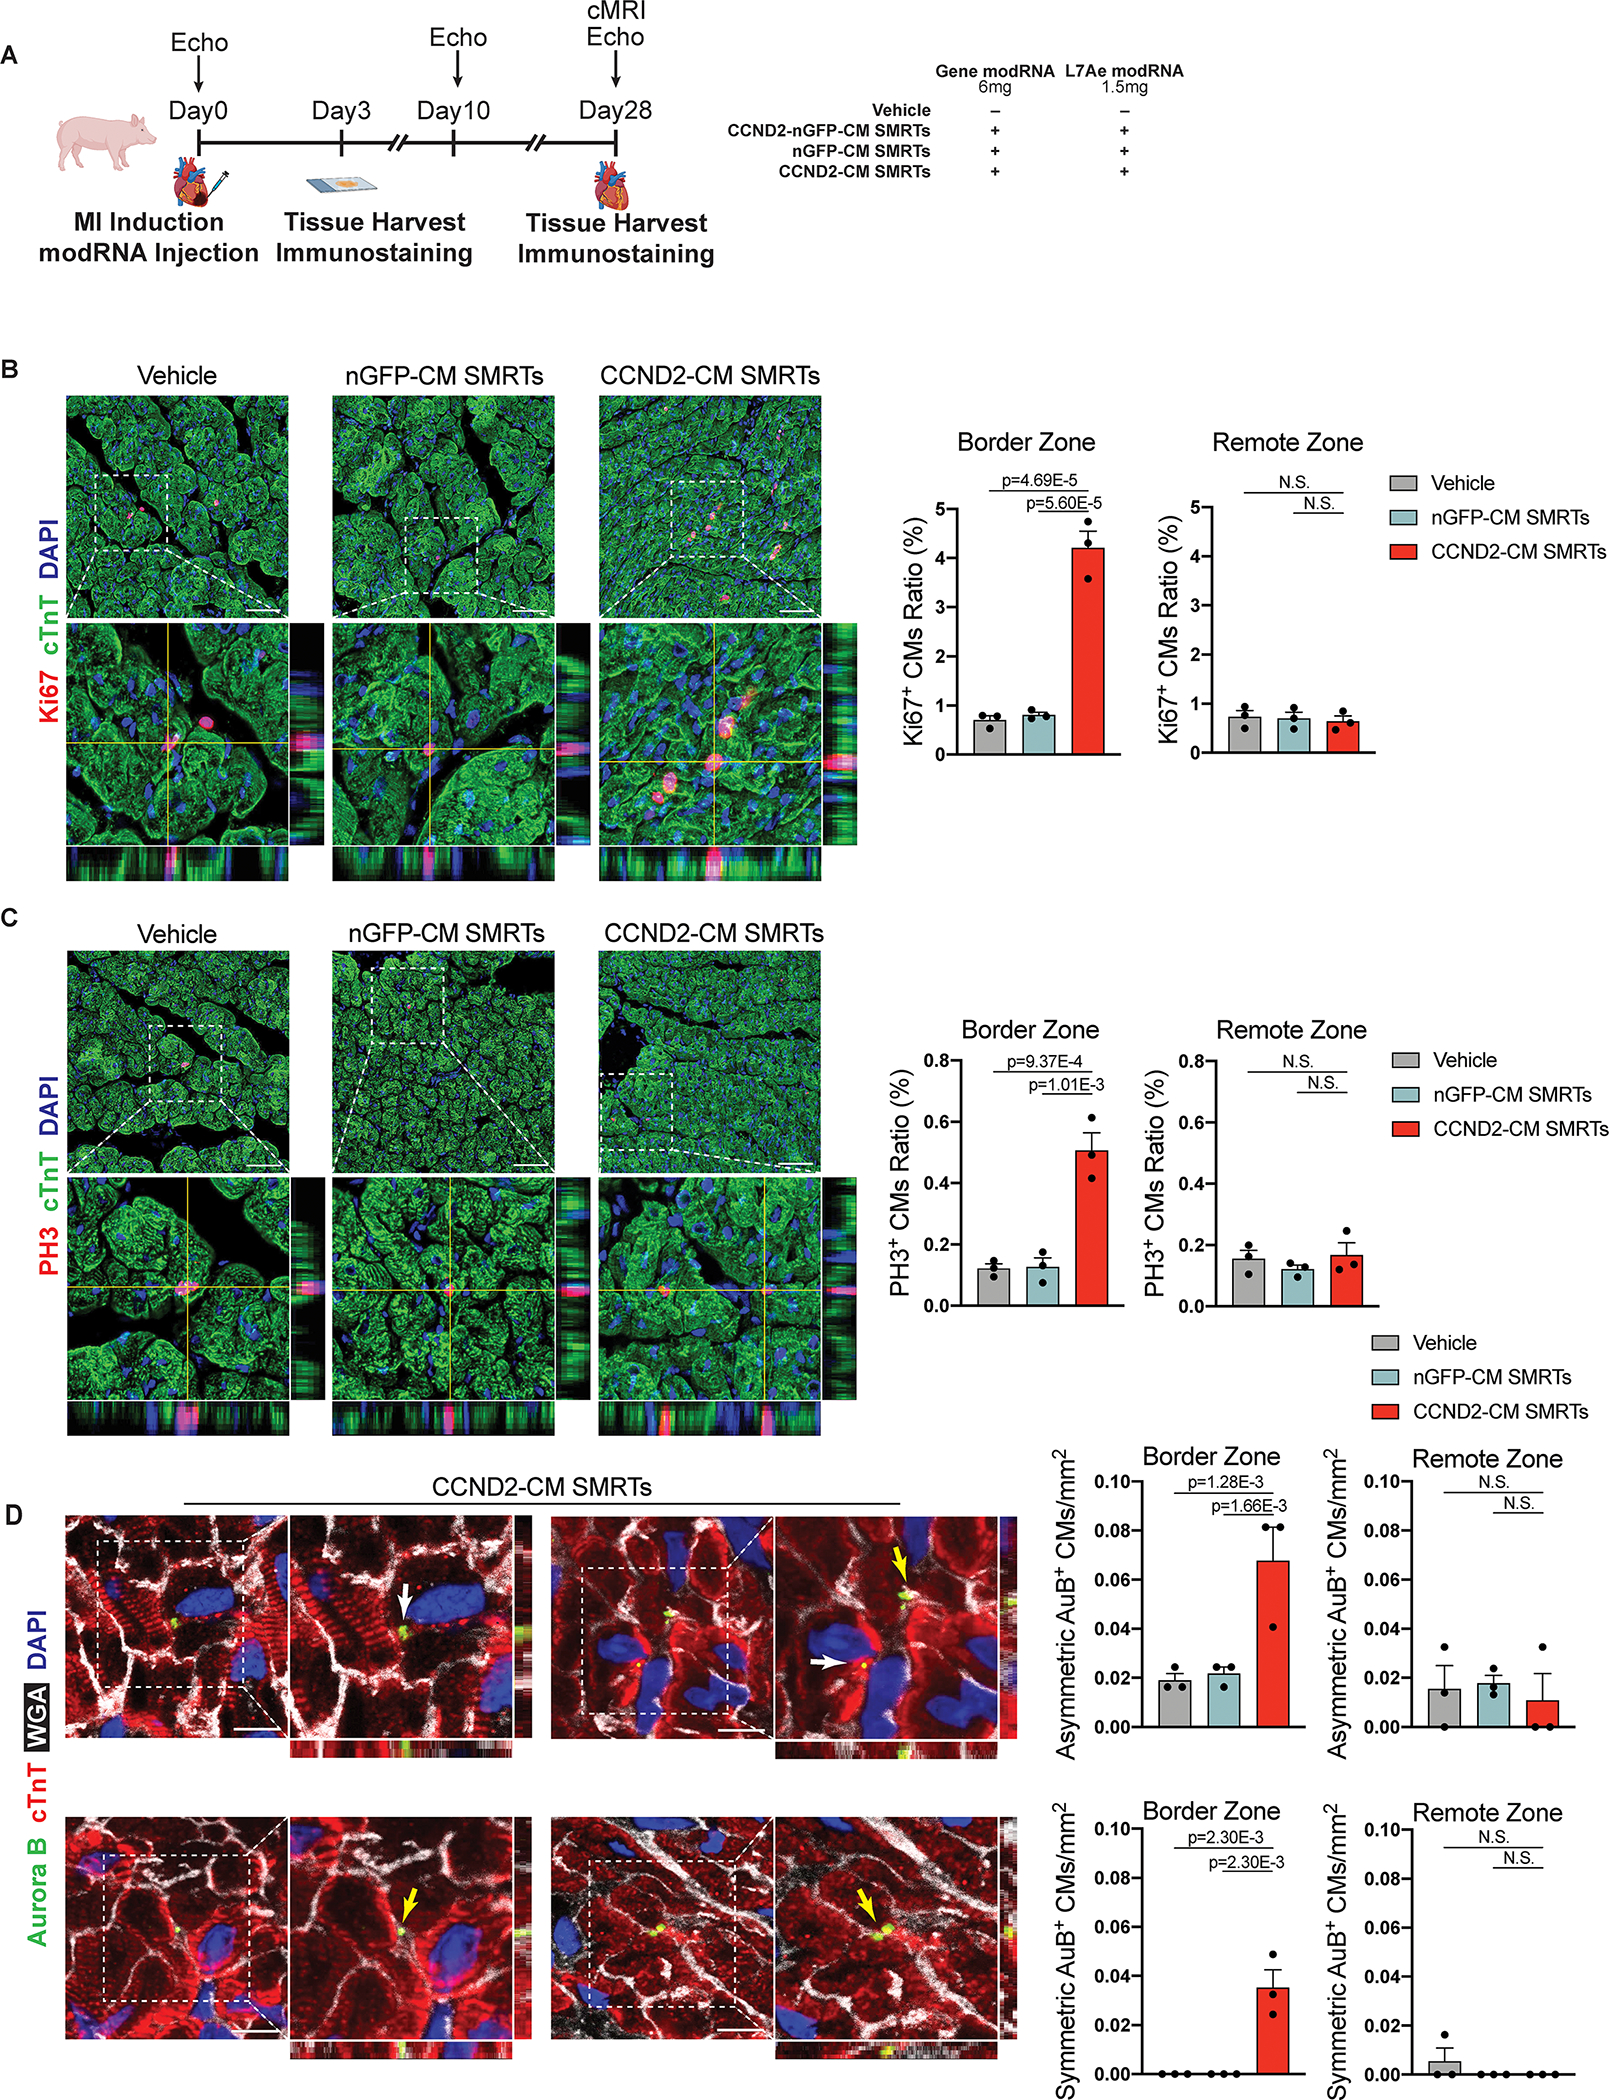
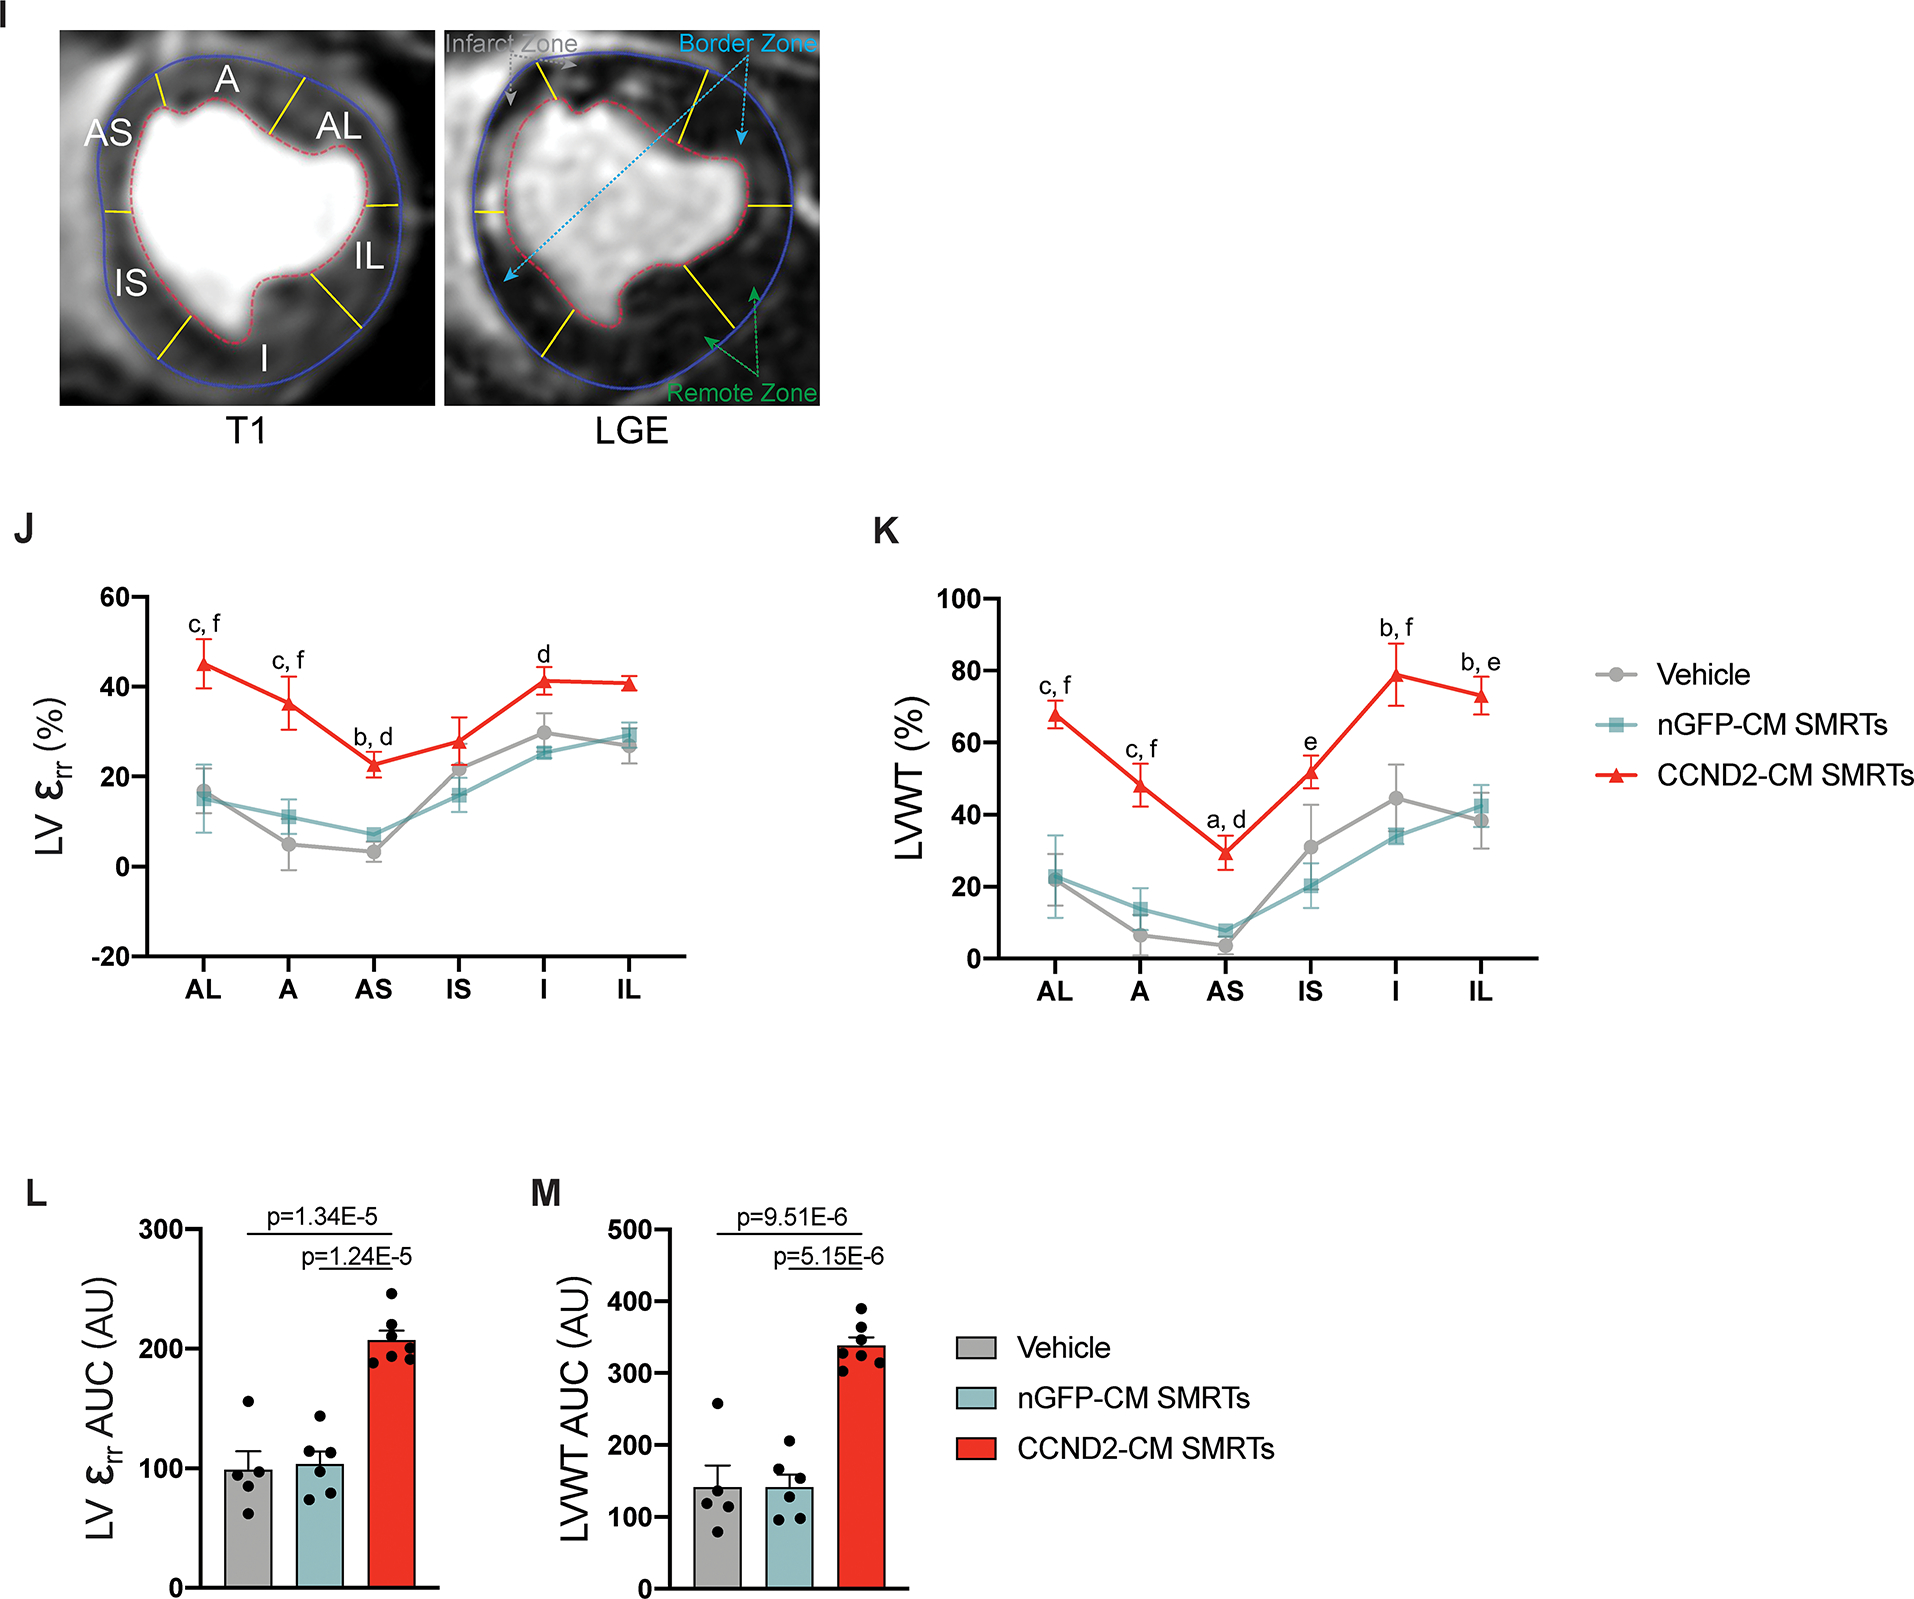
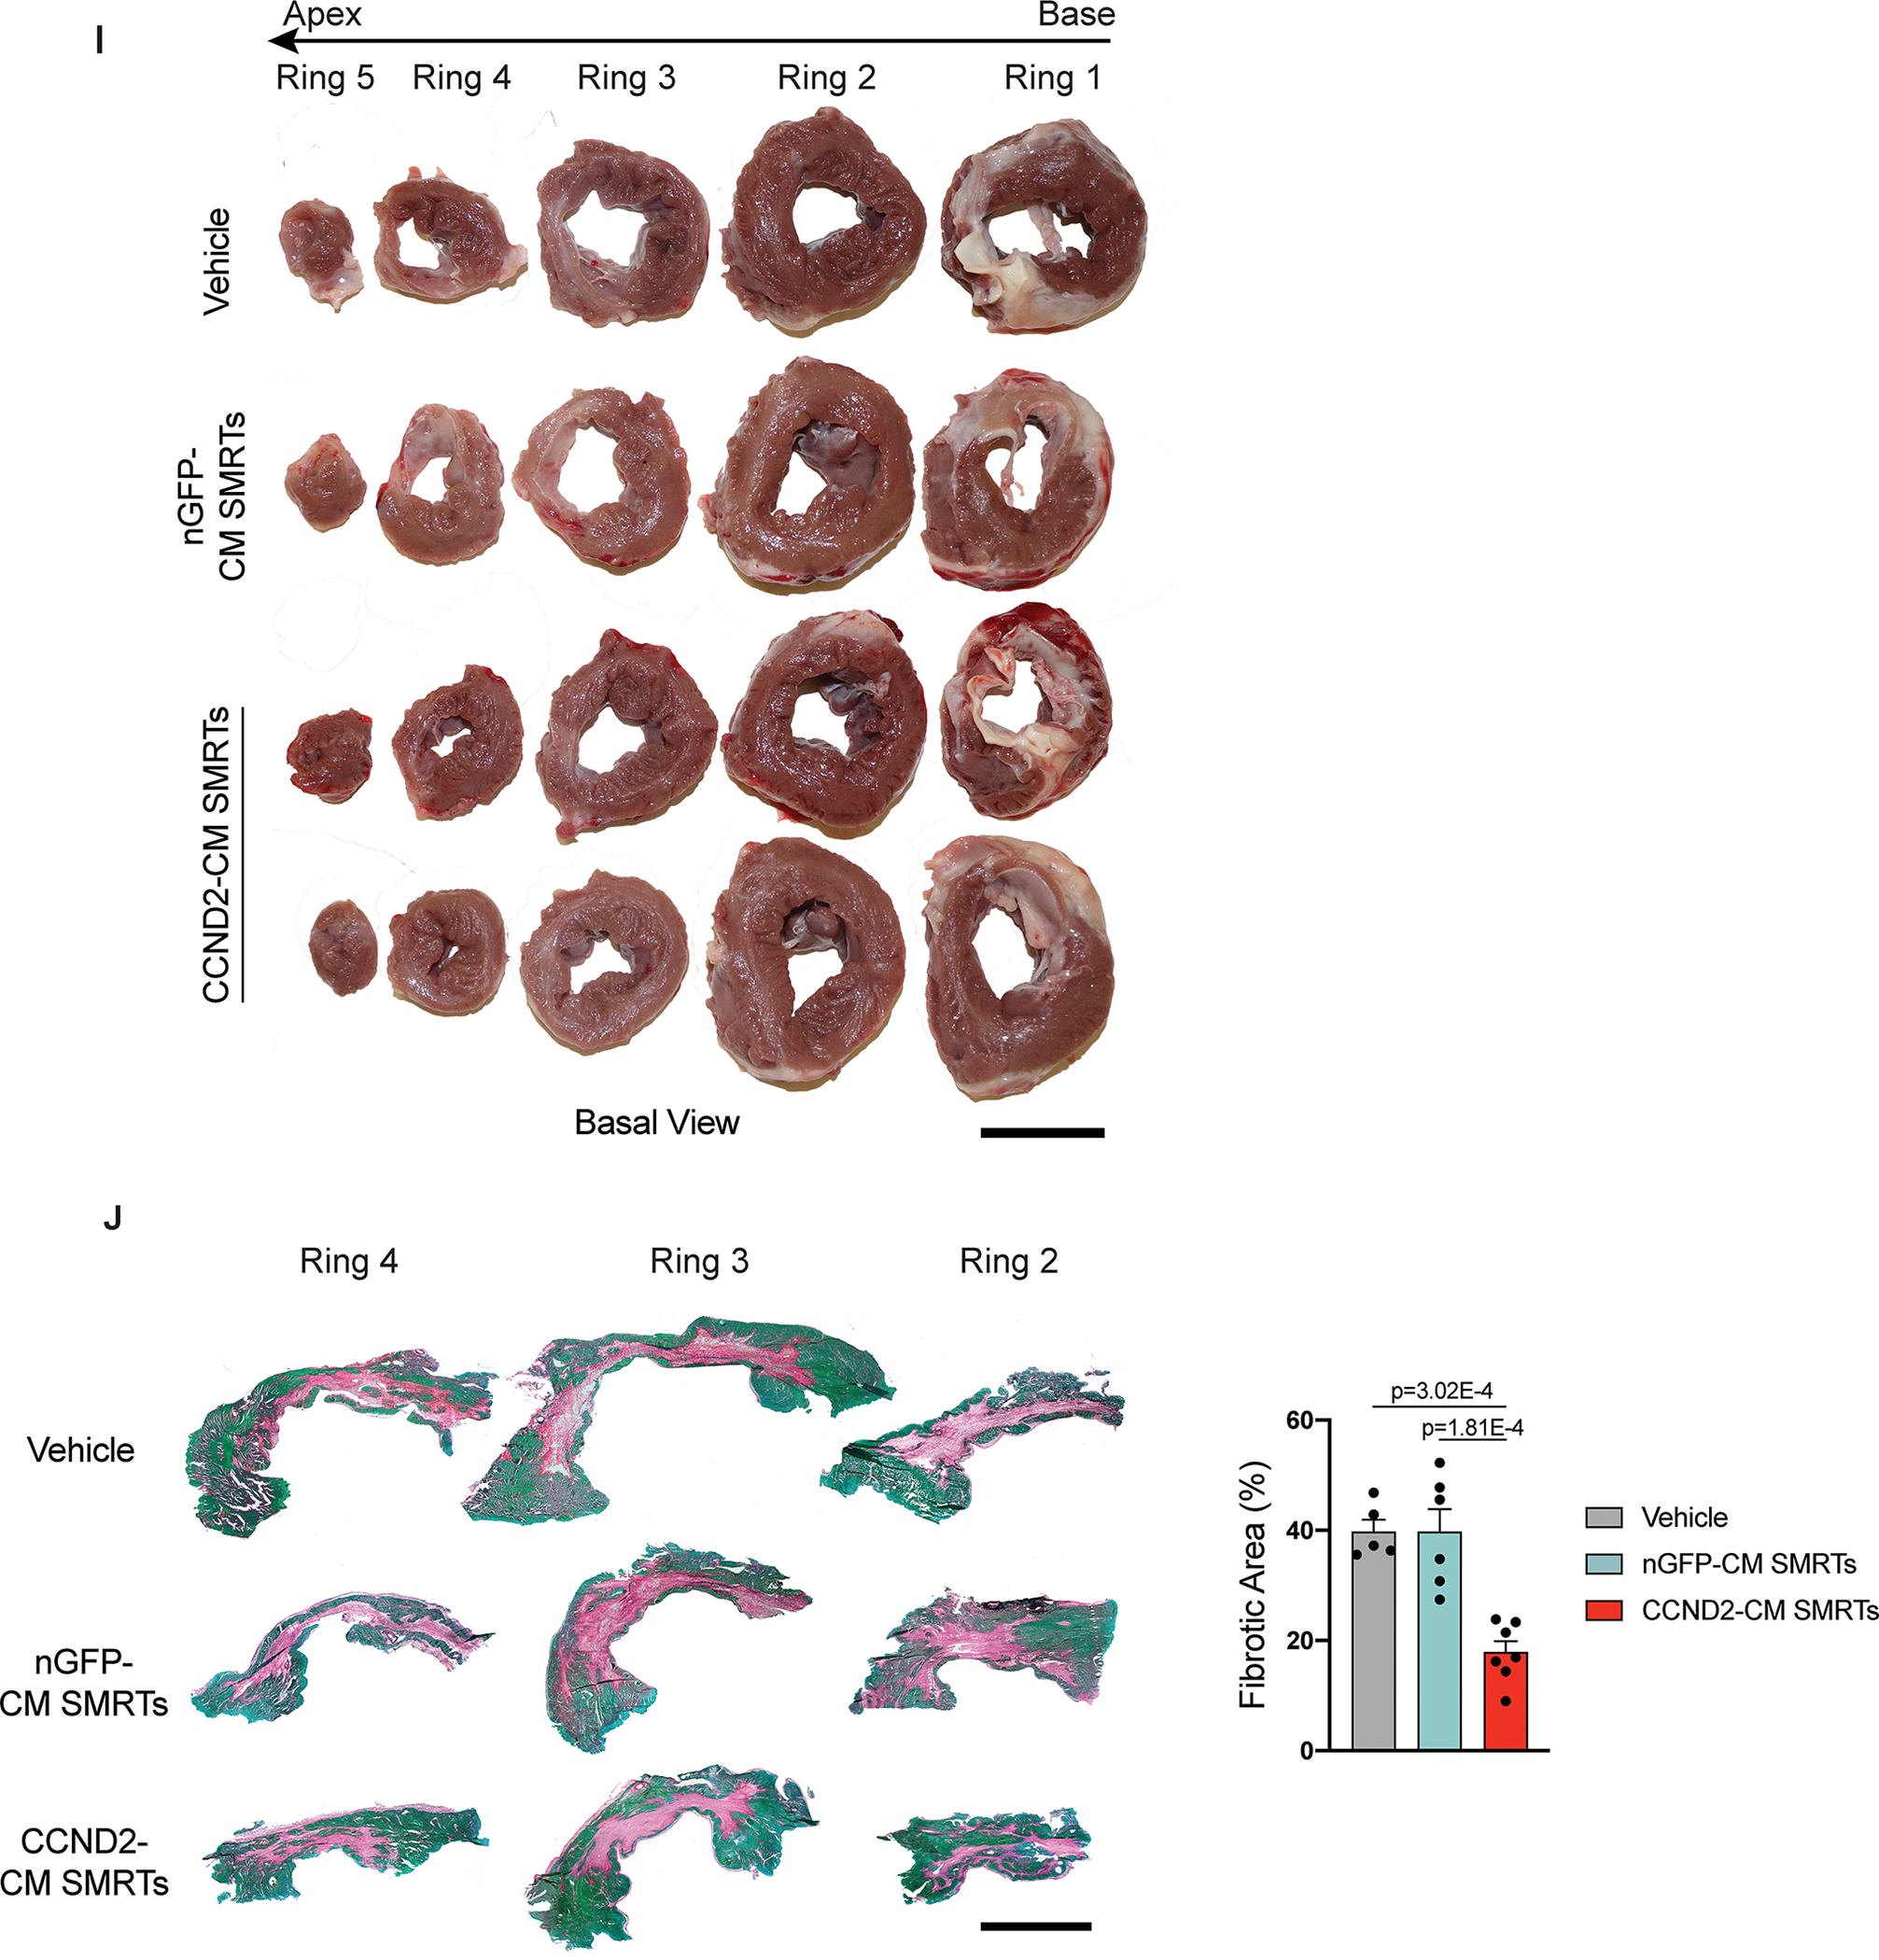
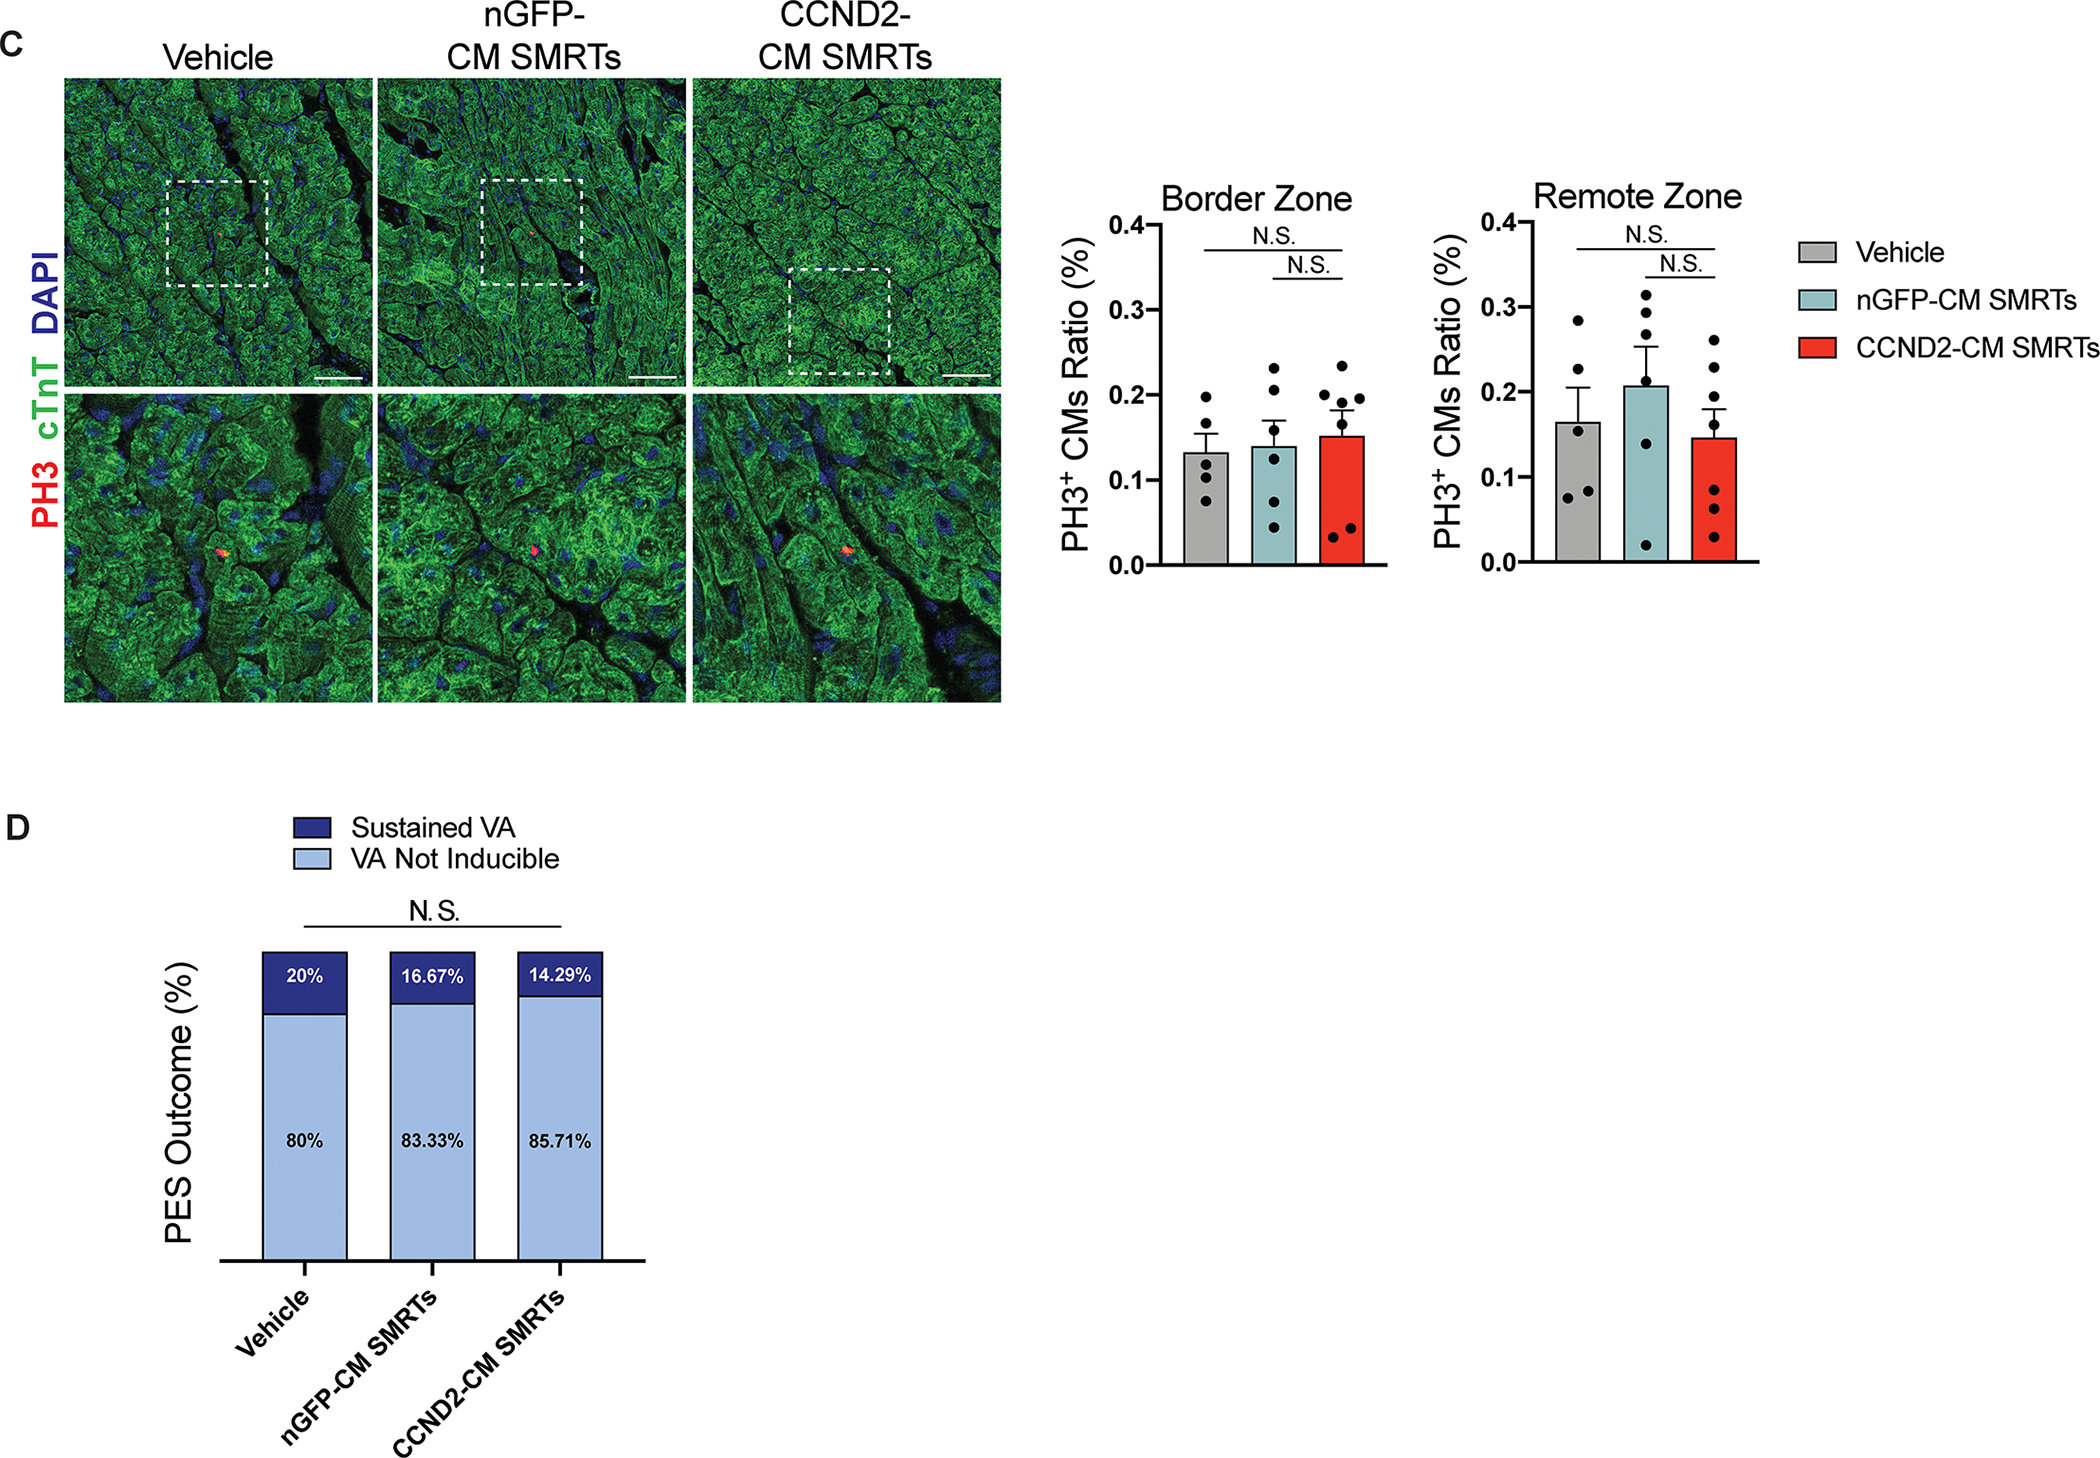
Results: CCND2 was abundantly expressed in cultured, postmitotic cardiomyocytes 2 days after transfection with the CCND2-cardiomyocyte SMRTs, and the increase was accompanied by the upregulation of markers for cell-cycle activation and proliferation (eg, Ki67 and Aurora B kinase). When the GFP-cardiomyocyte SMRTs were intramyocardially injected into infarcted mouse hearts, the GFP signal was observed in cardiomyocytes but no other cell type. In both MI models, cardiomyocyte proliferation (on day 7 and day 3 after treatment administration in mice and pigs, respectively) was significantly greater, left-ventricular ejection fractions (days 7 and 28 in mice, days 10 and 28 in pigs) were significantly higher, and infarcts (day 28 in both species) were significantly smaller in animals treated with the CCND2-cardiomyocyte SMRTs than in any other group that underwent MI induction.

Conclusions: Intramyocardial injections of the CCND2-cardiomyocyte SMRTs promoted cardiomyocyte proliferation, reduced infarct size, and improved cardiac performance in small and large mammalian hearts with MI.

Keywords: cardiomyocyte; cell cycle; heart failure; myocardial infarction.


Conflict of interest statement

Disclosures None.

Figures

Figure 1.
Figure 1.. CCND2-CM SMRTs promoted proliferation in cultured post-mitotic CMs.
A, The Cardiomyocyte Specific ModRNA Translation System (CM SMRTs) consists of two modRNA constructs as illustrated. B-C, Co-cultures of post-mitotic hiPSC-CMs and (B) ECs or (C) FBs were transfected with GFP-modRNA or the GFP-CM SMRTs; then, the cultured cells were immunofluorescently stained for the expression GFP and markers for CMs (cardiac troponin T [cTnT] and α sarcomeric actin [αSA]), ECs (von Willebrand factor [vWF]), and/or FBs (vimentin). Nuclei were counterstained with DAPI. Scale bar=50 μm. Yellow arrows indicate (B) ECs or (C) FBs. D-H, hiPSC-CMs were transfected with the Luc-CM SMRTs or the CCND2-CM SMRTs, stained for cTnT expression and for (D) CCND2 expression, (E) the expression of Ki67 (a proliferation marker), (F) BrdU incorporation (a marker for cell-cycle S-phase), (G) PH3 (a marker for the cell-cycle G2/M phase transition), or (H) the expression of AuB (a karyokinesis/cytokinesis marker). Nuclei were counterstained with DAPI, and the percentage of hiPSC-CMs that were positive for CCND2, Ki67, BrdU, or PH3, and for G2/Prophase-, Anaphase-, or Abscission-like AuB expression, was determined via immunofluorescence staining. Scale bar=50 μm. I, Time-lapse images were obtained of hiPSC-CMs that underwent cell division (yellow arrows) after treatment with the CCND2-CM SMRTs. J, hiPSC-CM cell counts were quantified for 7 days after treatment with the Luc-CM or CCND2-CM SMRTs. Scale bar=50 μm. n=4 biological replication for D-H and J. All data are presented as mean±SEM. p values from unpaired t-test (D-H), or Mann-Whitney U test (Panel H AuroraB (G2/Prophase) positive CM Percentage), or ordinary two-way ANOVA with Šídák multiple comparisons (J).
Figure 2.
Figure 2.. Intramyocardial injections of the CCND2-CM SMRTs promoted CM proliferation and improved measures of cardiac function, infarct size, and hypertrophy in a mouse MI model.
A, Mice with surgically induced MI received intramyocardial injections of the GFP-CM SMRTs (100 μg GFP-modRNA and 50 μg L7Ae-modRNA) and were sacrificed three days later; then, sections of heart tissue from the site of administration were stained for cTnT and GFP expression, and nuclei were counterstained with DAPI. Scale bar=50 μm. B, The experimental protocol in the mouse MI model is shown as a schematic. C-E, Sections of heart tissue from the border zone of the infarct were collected from mice one week after MI surgery and stained for the presence of cTnT and (C) Ki67, (D) PH3, or (E) AuB. AuB staining remains equidistant (symmetric AuB) between the two daughter nuclei during cell division but moves away from the midpoint (asymmetric AuB) during a multinucleation event; daughter nuclei are identified with arrows in panel E. Nuclei were counterstained with DAPI, and then CM proliferation, cell-cycle activity, cytokinesis, and multinucleation were quantified as the percentages of cTnT-positive cells that were also positive for Ki67, PH3, and symmetric and asymmetric AuB, respectively. Scale bar=50 μm for C; Scale bar=10 μm for D; Scale bar=10 μm for E. n=3 animals per group. F-G, Left-ventricular (LV) ejection fraction (EF; F) and fractional shortening (FS; G) were calculated from echocardiographic images obtained 1 day before MI induction and 0.5, 2, 4, 7, 14, and 28 days afterward. n=8 animals per group. H, LVs collected from mice at week 4 were cut into sections and stained with Sirius Red and Fast Green to visualize fibrotic (red) and normal (green) tissue; then, infarct size was quantified as the ratio of the length of LV scar arc to the circumference of the LV and presented as a percentage. Scale bar=1 mm. n=7 animals per group for Vehicle and CCND2-CM SMRTs groups; n=8 animals per group for L7Ae-modRNA and Luc-CM SMRTs groups. I, Sections from the border zone were stained with wheat germ agglutinin (WGA) to visualize cell borders and for the expression of cTnT to visualize CMs. Nuclei were counterstained with DAPI; then, CM cross-sectional sizes were quantified. Scale bar=20 μm. n=5 animals per group. All data are presented as mean±SEM. p values from one-way ANOVA with Tukey test (C-E, H, I), or two-way ANOVA with Šídák multiple comparisons (F, G). a, p<0.05 vs. Vehicle; b, p<0.01 vs. Vehicle; c, p<0.001 vs. Vehicle; d, p<0.001 vs. L7Ae-modRNA; e, p<0.001 vs. Luc-CM SMRTs (F, G).
Figure 3.
Figure 3.. Intramyocardial injections of the CCND2-CM SMRTs promoted CM cell-cycle activity and proliferation in a pig MI model.
A, The protocol for experiments in the pig MI model is shown as a schematic. B-D, Sections of heart tissue from the border zone and remote zone of the infarct were collected from pigs three days after MI and stained for the presence of cTnT and (B) Ki67, (C) PH3, or (D) AuB; then, CM proliferation, cell-cycle activity, cytokinesis, and multinucleation were quantified as the percentages of cTnT-positive cells that were also positive for Ki67, PH3, and symmetric (yellow arrows) and asymmetric (white arrows) AuB, respectively. Scale bar=50 μm for B-C; Scale bar=10 μm for D; n=3 animals per group. All data are presented as mean±SEM. p values from one-way ANOVA with Tukey test (B-D). N.S., not significant.
Figure 4.
Figure 4.. Intramyocardial injections of the CCND2-CM SMRTs improved global and regional measures of cardiac function in infarcted pig hearts.
A-C, Echocardiographic images (A) were obtained for pigs in the CCND2-CM SMRTs, nGFP-CM SMRTs, and Vehicle groups on Day 10 and Day 28 after AMI induction and used to calculate (B) LVEF and (C) LVFS. D-H, cMRI was performed on Day 28 (D) and used to calculate (E) LVEF, (F) Stroke Volume, (G) End-systolic Volume, and (H) End-diastolic Volume. I-M, LGE-cMRI was performed on Day 28 and used to calculate radial strain (εRR) and LV wall thickening (LVWT). (I) Corresponding T1 (left) and LGE (right) images are displayed for a pig in the Vehicle group; the infarcted region and the border and remote zones are identified with arrows in the LGE image. Six-segment curves corresponding to (J) LV radial strain (εRR) and (K) LV wall thickening (LVWT) were plotted, and (L, M) the area under the curve (AUC) of both parameters were calculated. IS: inferoseptal, AS: anteroseptal, A: anterior, AL: anterolateral, IL: inferolateral, I: inferior. n=5 for Vehicle group; n=6 for nGFP-CM SMRTs group; n=7 for CCND2-CM SMRTs group. All data are presented as mean±SEM. p values from ordinary two-way ANOVA with Tukey test (B-C, J-K), or Kruskal-Wallis H test (E), or one-way ANOVA with Tukey test (F-H, L-M). N.S., not significant. a, p<0.05 vs. Vehicle; b, p<0.01 vs. Vehicle; c, p<0.001 vs. Vehicle; d, p<0.05 vs. nGFP-CM SMRTs; e, p<0.01 vs. nGFP-CM SMRTs; f, p<0.001 vs. nGFP-CM SMRTs (J-K).
Figure 5.
Figure 5.. Intramyocardial injections of the CCND2-CM SMRTs reduced infarct size after MI induction in pigs.
A, LGE-cMRI images were obtained in pigs on Day 28 after MI induction; the endocardium is marked with a red line, the epicardium is marked with a blue line, and the infarct area is shaded in yellow. B-D, LGE-cMRI images were used to calculate (B) infarct size, (C) infarct mass, and (D) infarct mass percentage relative to the LV weight; size and mass measurements were presented as a percentage of the entire LV. E, An LGE-cMRI image is displayed showing the region of the infarct core (white zone; shaded in yellow) and the surrounding region of necrotic and viable tissue (gray zone; shaded in purple). F-H, The mass of the (F) infarct core and (G) gray zone, and (H) the ratio of the masses of the core and gray zones were calculated from LGE-cMRI images. I, LVs were collected on Day 28 and cut into five circular sections from the apex to the base. Scale bar=2 cm. J, Sections of the infarct core and the surrounding border zone from infarcted cardiac rings 2, 3, 4 were stained with Picro-Sirius Red and Fast Green to visualize fibrotic (red) and normal (green) tissue; then, infarct size was quantified as the ratio of the area of the fibrotic region to total area of the tissue and presented as a percentage. Scale bar=1 cm. n=5 for Vehicle group; n=6 for nGFP-CM SMRTs group; n=7 for CCND2-CM SMRTs group. All data are presented as mean±SEM. p values from one-way ANOVA with Tukey test (B-F, J), or Kruskal-Wallis H test (G-H). N.S., not significant.
Figure 6.
Figure 6.. Intramyocardial injections of the CCND2-CM SMRTs promoted CM proliferation for less than 28 days and did not increase the risk of arrhythmia in infarcted pig hearts.
A, Sections from border zone and remote zone were stained with cTnT and wheat germ agglutinin (WGA) to visualize CMs and their cell borders. Nuclei were counterstained with DAPI; then, CM cross-sectional size and the percentage of CMs with the indicated number of nuclei were quantified. Scale bar=50 μm. B-C, Sections from the border and remote zones of pig hearts were collected on Day 28 and stained for the presence of cTnT and (B) Ki67 or (C) PH3; then, CM proliferation and cell-cycle activity were quantified as the percentages of cTnT-positive cells that were also positive for Ki67 and PH3, respectively. Scale bar=50 μm. D, Programmed electrical stimulation (PES) was performed in all long-term study pig hearts before sacrifice on Day 28 to evaluate the arrythmia inducibility. Hearts were paced at 400 ms with additional stimuli provided at progressively shorter intervals; PES was halted immediately after an episode of ventricular arrhythmia (VA) was induced. Only one animal in each group demonstrated Sustained VA (≥15 heart beats; including ventricular tachycardia and ventricular fibrillation). The outcome of PES study is shown as percentage. n=5 for Vehicle group; n=6 for nGFP-CM SMRTs group; n=7 for CCND2-CM SMRTs group. All data are presented as mean±SEM. p values from one-way ANOVA with Tukey test (A [Border Zone CM cross-sectional size], B-C), or Kruskal-Wallis H test (A [Remote Zone CM cross-sectional size]), or two-way ANOVA with Tukey test (A [CM nucleation]), or χ2 test (D). N.S., not significant.

Comment in

Similar articles

Cited by

References

    1. Porrello ER, Mahmoud AI, Simpson E, Hill JA, Richardson JA, Olson EN, Sadek HA. Transient regenerative potential of the neonatal mouse heart. Science. 2011;331:1078–1080. doi: 10.1126/science.1200708 - DOI - PMC - PubMed
    1. Porrello ER, Mahmoud AI, Simpson E, Johnson BA, Grinsfelder D, Canseco D, Mammen PP, Rothermel BA, Olson EN, Sadek HA. Regulation of neonatal and adult mammalian heart regeneration by the miR-15 family. Proc Natl Acad Sci U S A. 2013;110:187–192. doi: 10.1073/pnas.1208863110 - DOI - PMC - PubMed
    1. Zhu W, Zhang E, Zhao M, Chong Z, Fan C, Tang Y, Hunter JD, Borovjagin AV, Walcott GP, Chen JY, et al. Regenerative Potential of Neonatal Porcine Hearts. Circulation. 2018;138:2809–2816. doi: 10.1161/circulationaha.118.034886 - DOI - PMC - PubMed
    1. Nakada Y, Zhou Y, Gong W, Zhang EY, Skie E, Nguyen T, Wei Y, Zhao M, Chen W, Sun J, et al. Single Nucleus Transcriptomics: Apical Resection in Newborn Pigs Extends the Time Window of Cardiomyocyte Proliferation and Myocardial Regeneration. Circulation. 2022;145:1744–1747. doi: 10.1161/circulationaha.121.056995 - DOI - PMC - PubMed
    1. Tao Z, Loo S, Su L, Abdurrachim D, Lalic J, Lee TH, Chen X, Tan RS, Zhang J, Ye L. Dexamethasone inhibits regeneration and causes ventricular aneurysm in the neonatal porcine heart after myocardial infarction. J Mol Cell Cardiol. 2020;144:15–23. doi: 10.1016/j.yjmcc.2020.04.033 - DOI - PubMed

Publication types