

WRKY transcription factors and OBERON histone-binding proteins form complexes to balance plant growth and stress tolerance
- PMID: 37565504
- PMCID: PMC10548177
- DOI: 10.15252/embj.2023113639
WRKY transcription factors and OBERON histone-binding proteins form complexes to balance plant growth and stress tolerance
Abstract
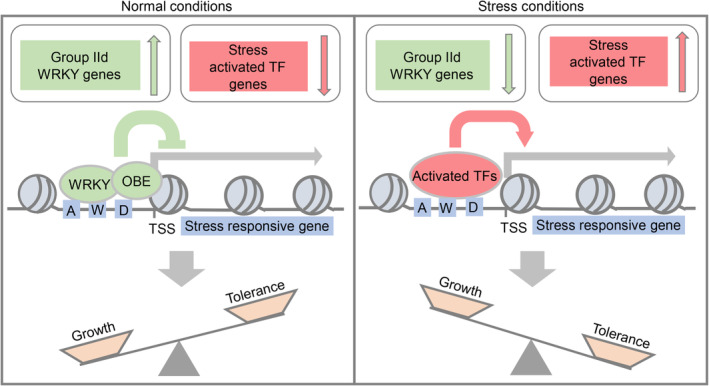
WRKY transcription factors in plants are known to be able to mediate either transcriptional activation or repression, but the mechanism regulating their transcriptional activity is largely unclear. We found that group IId WRKY transcription factors interact with OBERON (OBE) proteins, forming redundant WRKY-OBE complexes in Arabidopsis thaliana. The coiled-coil domain of WRKY transcription factors binds to OBE proteins and is responsible for target gene selection and transcriptional repression. The PHD finger of OBE proteins binds to both histones and WRKY transcription factors. WRKY-OBE complexes repress the transcription of numerous stress-responsive genes and are required for maintaining normal plant growth. Several WRKY and OBE mutants show reduced plant size and increased drought tolerance, accompanied by increased expression of stress-responsive genes. Moreover, expression levels of most of these WRKY and OBE genes are reduced in response to drought stress, revealing a previously uncharacterized regulatory mechanism of the drought stress response. These results suggest that WRKY-OBE complexes repress transcription of stress-responsive genes, and thereby balance plant growth and stress tolerance.
Keywords: development; histone; stress tolerance; transcription factor; transcriptional repression.
© 2023 The Authors.
Conflict of interest statement
The authors declare that they have no conflict of interest.
Figures
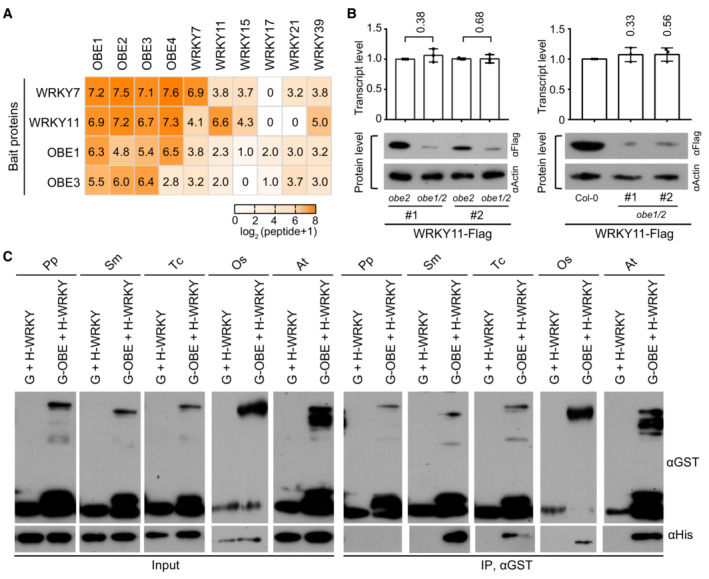
Heatmap showing the abundance of proteins co‐purified with Flag‐tagged WRKY7, WRKY11, OBE1, and OBE3 as determined by AP‐MS in Arabidopsis plants. The number of matched peptides was used to calculate the abundance of purified proteins. Transgenic plants expressing the indicated bait proteins were used for AP‐MS.
Effect of obe1/2 on the protein abundance of WRKY11‐Flag in transgenic Arabidopsis plants. The transcript (top) and protein (bottom) levels of WRKY11‐Flag transgene in obe2 and obe1/2 mutants and wild‐type backgrounds are shown. The actin protein level is shown as a loading control. Values are means ± SD of three biological replicates. P‐values were determined by two‐tailed Student's t‐test.
Determination of the interactions between WRKY11 and OBE1 orthologs from Physcomitrium patens (Pp), Selaginella moellendorffii (Sm), Taxus chinensis (Tc), Oryza sativa (Os), and Arabidopsis thaliana (At) by in vitro pull‐down assays. His‐tagged WRKY11 orthologs and GST‐tagged OBE1 orthologs were expressed and purified from bacteria and then subjected to GST pull‐down assays. G, GST; H, His.
- A
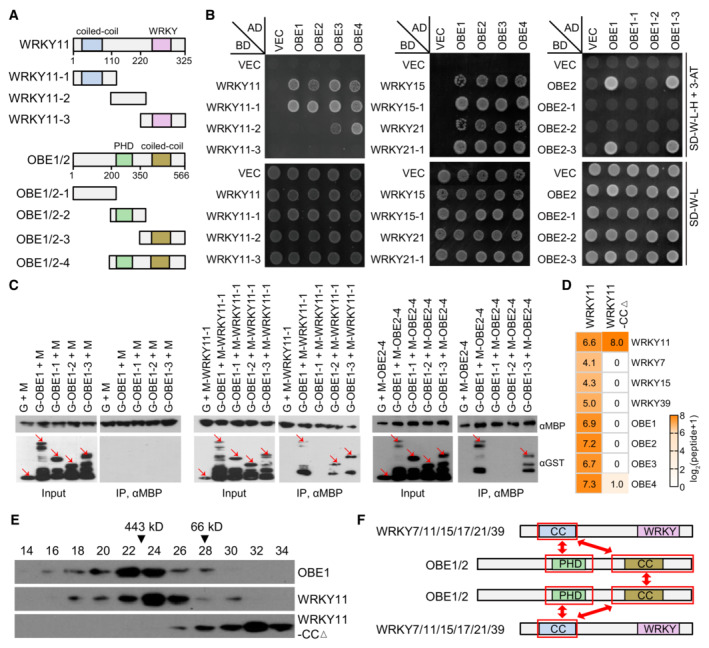
Diagram showing full‐length and truncated versions of WRKY11 and OBE1/2 proteins used in Y2H and/or pull‐down assays. Conserved domains are shown.
- B
Determination of the protein–protein interactions in the WRKY‐OBE complex by Y2H assays. Yeast strains expressing indicated GAL4‐AD‐ and GAL4‐BD‐fused proteins were grown on SD medium lacking Trp and Leu (SD‐W‐L) and SD medium lacking Trp, Leu, and His (SD‐W‐L‐H) supplemented with 3 mM 3‐AT. The yeast strain harboring the empty GAL4‐AD and GAL4‐BD vectors (VEC) was used as a negative control.
- C
Determination of the protein–protein interactions in the WRKY‐OBE complex by pull‐down assays. The bacterially expressed full‐length and/or truncated versions of WRKY11, OBE1, and OBE2 fused with GST or MBP tags were subjected to MBP pull‐down assays. G, GST; M, MBP. Arrows point to the indicated proteins.
- D, E
Deletion of the CC domain from WRKY11 disrupts the WRKY‐OBE complex formation as determined by AP‐MS and gel filtration. In AP‐MS assays (D), transgenic plants expressing Flag‐tagged wild‐type WRKY11 and WRKY11‐CCΔ proteins were independently used for identifying the WRKY‐OBE complex. The abundance of purified proteins is represented by identified peptides as detected by AP‐MS. For gel filtration (E), proteins extracted from indicated Flag‐tagged transgenic plants were separated in a Superose 6 column (10/300 GL; GE Healthcare Life Sciences) and were detected by immunoblotting.
- F
Diagrams showing the interaction regions of WRKY and OBE proteins in the WRKY‐OBE complex as determined by Y2H and pull‐down assays. The interaction regions are labeled by red frames.
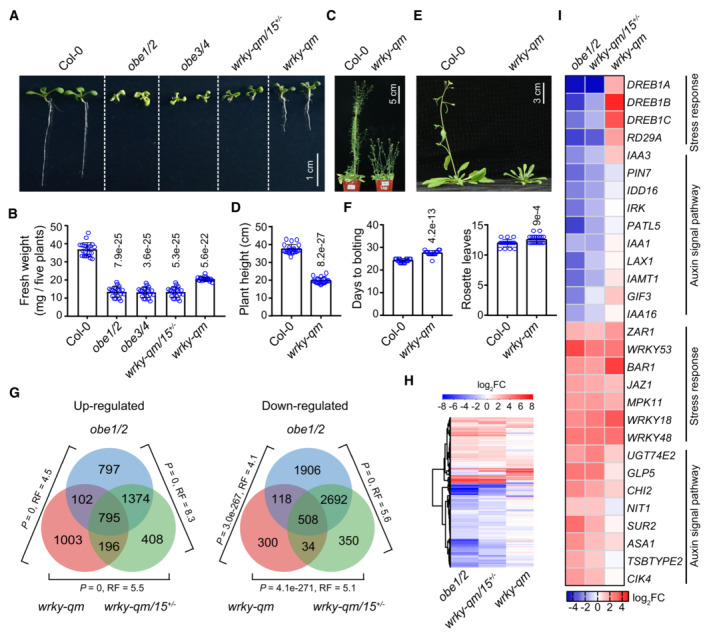
Morphological phenotypes of wild‐type, obe1/2, obe3/4, wrky‐qm/15 +/−, and wrky‐qm mutant plants. Two‐week‐old plants of the indicated genotypes are shown. The wrky7/11/17/21/39 quintuple mutant is referred to as wrky‐qm.
Effect of obe1/2, obe3/4, wrky‐qm/15 +/−, and wrky‐qm on plant growth. Fresh weight per five plants as a group was determined. The fresh weight was calculated from a minimum of 20 groups.
Morphological phenotypes of adult plants of wild type and wrky‐qm mutant.
Effect of wrky‐qm on plant height. The height was calculated from a minimum of 20 plants.
Flowering time phenotypes of wild‐type and wrky‐qm mutant plants.
Flowering time was measured by counting the days to bolting and the number of rosette leaves at bolting. The data were calculated from a minimum of 20 plants.
The overlap of differentially expressed genes (DEGs) in the wrky‐qm/15 +/−, obe1/2, and wrky‐qm mutants relative to the wild type, as identified by RNA‐seq. RNA was extracted from 11‐day‐old seedlings. P‐values were determined by the hypergeometric test (one‐tailed). RF (representation factor) represents the number of observed overlapping genes divided by the number of expected overlapping genes drawn from two independent groups.
The expression change (log2FC) of DEGs identified in the wrky‐qm/15 +/−, obe1/2, and wrky‐qm mutants relative to the wild type. Red and blue represent up‐ and downregulated genes, respectively.
The expression change (log2FC) of representative DEGs in indicated mutants relative to the wild type. Red and blue represent up‐ and downregulated genes, respectively.
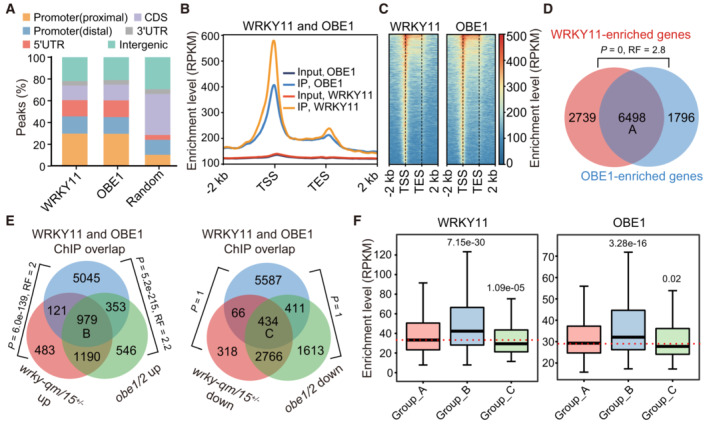
Distribution of WRKY11 and OBE1 ChIP‐seq peaks in distal promoter, proximal promoter, 5′ UTR, CDS (coding sequence), 3′ UTR, and intergenic regions. Distal and proximal promoters represent 401–1,000 and 0–400 bp upstream of transcription start sites, respectively. The distribution of random genomic regions is shown as a control.
Metaplots showing WRKY11 and OBE1 ChIP‐seq occupancy over protein‐coding genes. TSS, transcription start site; TES, transcription end site. The ChIP‐seq data of WRKY11 and OBE1 are from two independent biological replicates. The input genomic DNA is shown as a negative control.
Heatmaps showing the enrichment of WRKY11 and OBE1 ChIP‐seq reads over protein‐coding genes. TSS, transcription start site; TES, transcription end site.
Venn diagram showing the overlap between WRKY11‐ and OBE1‐enriched genes. The overlapping genes are defined as group A genes. P‐values were determined by the hypergeometric test (one‐tailed). RF (representation factor) represents the number of observed overlapping genes divided by the number of expected overlapping genes drawn from two independent groups.
Venn diagrams showing the overlap between WRKY11 and OBE1 co‐enriched genes and up‐ or downregulated genes in the wrky‐qm/15 +/− and obe1/2 mutants. Group B and group C genes represent the overlap between WRKY11 and OBE1 co‐enriched genes and co‐upregulated genes (left) or co‐downregulated genes (right) in the wrky‐qm/15 +/− and obe1/2 mutants. P‐values were determined by the hypergeometric test (one‐tailed). RF (representation factor) represents the number of observed overlapping genes divided by the number of expected overlapping genes drawn from two independent groups.
Box plots of WRKY11‐ and OBE1‐enriched levels at group A, group B, and group C genes. Sample size of each box plot: group A (n = 6,498), group B (n = 979), and group C (n = 434). In box plots, center lines and box edges are medians and the interquartile range (IQR), respectively. Whiskers extend within 1.5 times the IQR. P‐values were determined by two‐tailed Mann–Whitney U‐test (unpaired) for non‐normally distributed data.
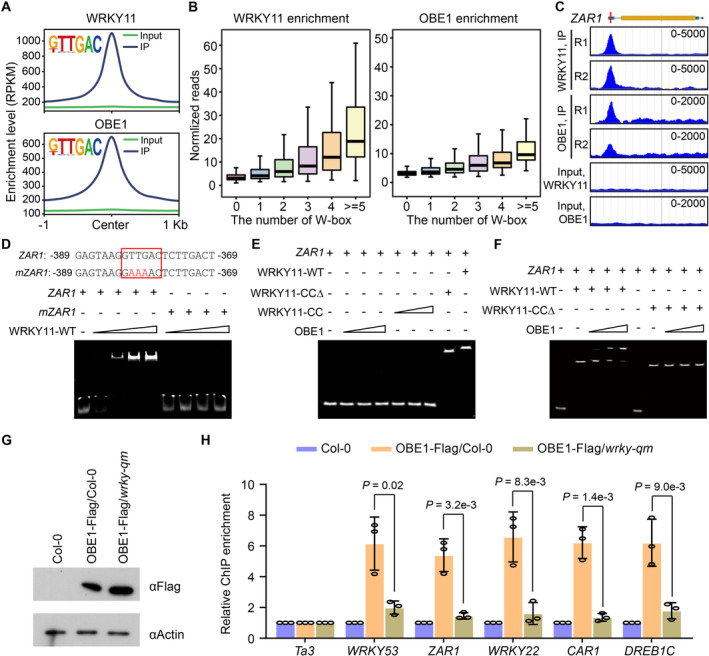
Metaplots showing WRKY11 and OBE1 ChIP‐seq signals at WRKY11‐ and OBE‐bound regions centered by the W‐box motif. The signals of input genomic DNA are shown as controls.
Enriched levels of WRKY11 and OBE1 at the WRKY11‐ and OBE1‐bound regions harboring different numbers of W‐box motifs. Relative enrichment level is referred to as the fold change of ChIP‐seq reads and input reads. In box plots, the sample size of WRKY11‐bound regions is n (0) = 5,491, n (1) = 3,972, n (2) = 1,384, n (3) = 369, n (4) = 137, and n (≥5) = 54; the sample size of OBE1‐bound regions is n (0) = 5,554, n (1) = 2,920, n (2) = 1,029, n (3) = 268, n (4) = 103, and n (≥5) = 40). In box plots, center lines and box edges are medians and the interquartile range (IQR), respectively. Whiskers extend within 1.5 times the IQR.
Genome browser view of WRKY11 and OBE1 ChIP‐seq signals at the representative target gene ZAR1. The scale of RPKM is indicated for each panel.
Effect of W‐box mutation on binding of the WRKY protein to DNA as determined by EMSA. A W‐box‐containing DNA from ZAR1 was labeled by Cy5 and used as the DNA probe. The W‐box was mutated as indicated. The wild‐type and mutated W‐boxes are labeled by red boxes.
The binding of full‐length WRKY11, WRKY11‐CCΔ, the CC domain of WRKY11 (WRKY11‐CC), and full‐length OBE1 to DNA as determined by EMSA.
Determination of the binding of full‐length and CC‐truncated WRKY11 proteins to DNA by EMSA, in the presence or absence of OBE1.
The protein level of OBE1‐Flag in the wild‐type (Col‐0) and wrky‐qm mutant backgrounds determined by immunoblotting. The actin protein level is shown as a loading control.
Enrichment of OBE1‐Flag at WRKY53, ZAR1, WRKY22, CAR1, and DREB1C loci as determined by quantitative ChIP–PCR in the wild‐type (Col‐0) and wrky‐qm mutant backgrounds. Values are means ± SD of three independent biological replicates. P‐values were determined by two‐tailed Student's t‐test.
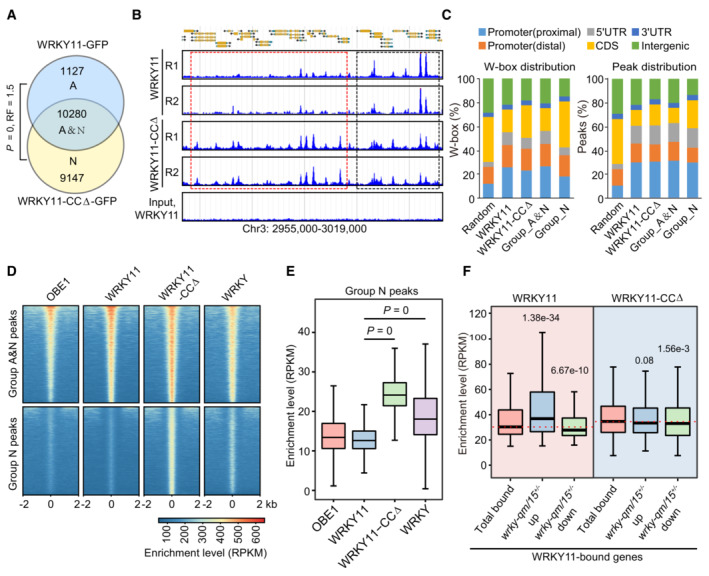
Venn diagram showing the overlap between WRKY11 and WRKY11‐CCΔ peaks as determined by ChIP‐seq. The overlap between WRKY11 and WRKY11‐CCΔ peaks is defined as group_A&N. WRKY11‐ and WRKY11‐CCΔ‐specific peaks are defined as group_A and group_N peaks, respectively. P‐values were determined by the hypergeometric test (one‐tailed). RF (representation factor) represents the number of observed overlapping genes divided by the number of expected overlapping genes drawn from two independent groups.
Genome browser view of the ChIP‐seq signals of WRKY11 and WRKY11‐CCΔ at randomly selected genomic regions. WRKY11 and WRKY11‐CCΔ shared peaks are labeled by black boxes, and WRKY11‐CCΔ‐specific peaks are labeled by red boxes. Two replicates of ChIP‐seq are shown.
Distribution of the WRKY11 and WRKY11‐CCΔ W‐box distribution and peaks distribution in different genomic regions. Distal and proximal promoters represent 401–1,000 and 0–400 bp upstream of transcription start sites, respectively. The distribution of random genomic regions is shown as a control.
Heatmaps showing the ChIP‐seq signals of WRKY11, WRKY11‐CCΔ, OBE1, and general WRKY TFs over group A&N and group N peaks. The enrichment level is indicated by RPKM as determined by ChIP‐seq.
Box plots showing the enrichment levels of WRKY11, WRKY11‐CCΔ, OBE1, and general WRKY TFs at group N peaks (n = 9,147).
Box plots of WRKY11‐ and WRKY11‐CCΔ‐enriched levels at total WRKY11‐bound genes and at the overlap between WRKY11‐bound genes and up‐ or downregulated genes in wrky‐qm/15 +/−. Sample size of each box plot: total WRKY11‐bound genes (n = 9,237), WRKY11‐bound genes and upregulated (n = 1,424), WRKY11‐bound genes and downregulated (n = 773).
- A
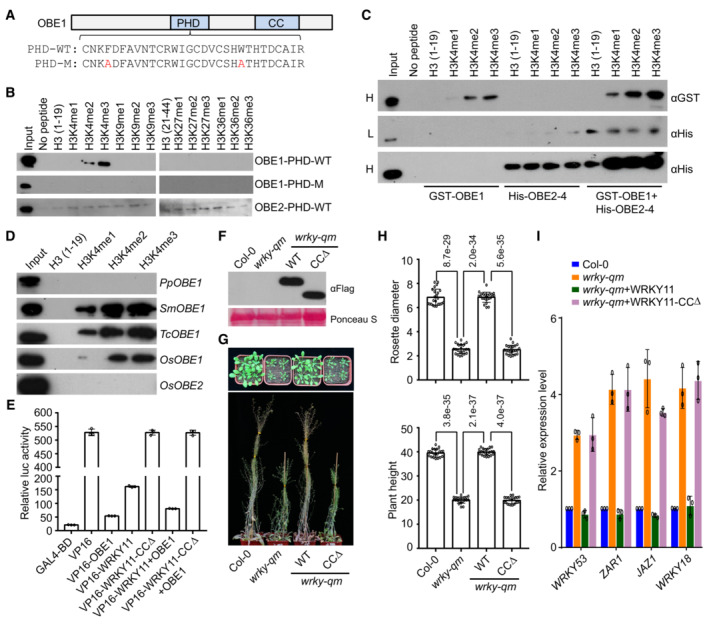
Diagram of the wild‐type and mutated PHD domains in OBE1. Mutated residues in the PHD domain are shown in red.
- B
Interaction of the PHD domains of OBE1 and OBE2 with histone peptides as determined by pull‐down assays. The wild‐type and mutated PHD domains in OBE1 and the wild‐type PHD domain in OBE2 were purified and then mixed with indicated histone peptides for pull‐down assays.
- C
Interaction of GST‐OBE1, His‐OBE2, and the GST‐OBE1 and His‐OBE2 mixture with histone peptides as determined by pull‐down assays. H, high exposure; L, low exposure.
- D
Interaction of OBE1 and/or OBE2 orthologs with histone peptides as determined by pull‐down assays. PpOBE1, SmOBE1, TcOBE1, and OsOBE1 are OBE1 orthologs in Physcomitrium patens (Pp), Selaginella moellendorffii (Sm), Taxus chinensis (Tc), and Oryza sativa (Os), respectively. OsOBE2 is an OBE2 ortholog in Oryza sativa.
- E
Determination of the transcriptional repression activity of OBE1, WRKY11, WRKY11‐CCΔ, and the mixture of WRKY11 or WRKY11‐CCΔ with OBE1 by a luciferase reporter assay. The transcriptional repression activity of OBE1, WRKY11‐WT, and WRKY11‐CCΔ was determined by fusing with the transcription factor VP16. Values are means ± SD of three independent biological replicates.
- F
The expression levels of Flag‐tagged wild‐type WRKY11 and WRKY‐CCΔ proteins determined by immunoblotting. The ribosome protein stained by Ponceau S is indicated as a loading control.
- G, H
Restoration of the developmental defects of the wrky‐qm mutant by WRKY11 and WRKY11‐CCΔ transgenes. Morphological phenotype (G) and the statistical data of rosette diameter and plant height (H) are shown. The data were calculated from a minimum of 20 plants. Values are means ± SD. P‐values were determined by two‐tailed Student's t‐test and are indicated above columns.
- I
Expression levels of representative stress‐responsive genes in wild‐type, wrky‐qm, and WRKY11 and WRKY11‐CCΔ transgenic lines. Values are means ± SD of three biological replicates.
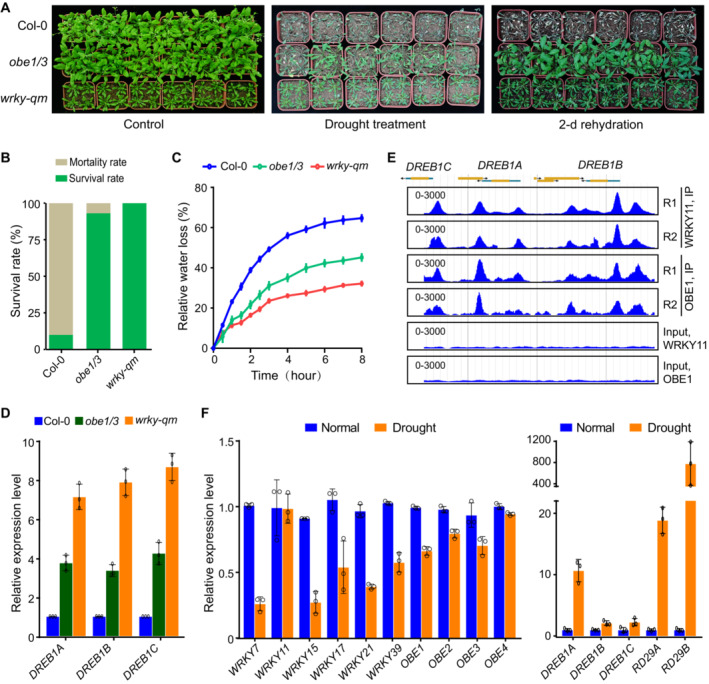
The morphological phenotype of wild type and obe1/3 and wrky‐qm mutants under well‐watered and drought stress conditions. Nine‐day‐old seedlings were transferred from MS medium to soil and then subjected to drought treatment until the mortality of Col‐0 occurred. The morphological phenotype is shown before and 2 days after rehydration. The well‐watered plants are shown as a control.
The survival rate of wild type and obe1/3 and wrky‐qm mutants under drought stress conditions. The survival rate was calculated from a minimum of 25 plants after rehydration.
Relative water loss of detached leaves from wild type and obe1/3 and wrky‐qm mutants. Values are means ± SD of three biological replicates.
Effect of wrky‐qm and obe1/3 on the expression of DREB1A, DREB1B, and DREB1C as determined by quantitative RT‐PCR. Values are means ± SD of three biological replicates.
Genome browser view of WRKY11 and OBE1 ChIP‐seq peaks at DREB1A, DREB1B, and DREB1C. The scale of RPKM is indicated in each panel. Two replicates are shown.
The expression levels of indicated genes under non‐stress and drought stress conditions as determined by RNA‐seq. Well‐watered and drought‐treated Arabidopsis Col‐0 plants were grown at 22°C under long‐day conditions (16 h light/8 h dark) for 28 days. Values are means ± SD of three biological replicates.
References
-
- Arrano‐Salinas P, Dominguez‐Figueroa J, Herrera‐Vasquez A, Zavala D, Medina J, Vicente‐Carbajosa J, Meneses C, Canessa P, Moreno AA, Blanco‐Herrera F (2018) WRKY7, ‐11 and ‐17 transcription factors are modulators of the bZIP28 branch of the unfolded protein response during PAMP‐triggered immunity in Arabidopsis thaliana . Plant Sci 277: 242–250 - PubMed
-
- Bi G, Su M, Li N, Liang Y, Dang S, Xu J, Hu M, Wang J, Zou M, Deng Y et al (2021) The ZAR1 resistosome is a calcium‐permeable channel triggering plant immune signaling. Cell 184: 3528–3541 - PubMed
-
- Birkenbihl RP, Kracher B, Ross A, Kramer K, Finkemeier I, Somssich IE (2018) Principles and characteristics of the Arabidopsis WRKY regulatory network during early MAMP‐triggered immunity. Plant J 96: 487–502 - PubMed
-
- Bowman JL, Kohchi T, Yamato KT, Jenkins J, Shu S, Ishizaki K, Yamaoka S, Nishihama R, Nakamura Y, Berger F et al (2017) Insights into land plant evolution garnered from the Marchantia polymorpha genome. Cell 171: 287–304 - PubMed
Publication types
MeSH terms
Substances
Associated data
- Actions
LinkOut - more resources
Full Text Sources
Molecular Biology Databases
