

Hepatic transcriptome signatures in mice and humans with nonalcoholic fatty liver disease
- PMID: 37565549
- PMCID: PMC10486336
- DOI: 10.1002/ame2.12338
Hepatic transcriptome signatures in mice and humans with nonalcoholic fatty liver disease
Abstract
Background: Nonalcoholic fatty liver disease (NAFLD) is the main reason for cirrhosis and hepatocellular carcinoma. As a starting point for NAFLD, the treatment of nonalcoholic fatty liver (NAFL) is receiving increasing attention. Mice fed a high-fat diet (HFD) and hereditary leptin deficiency (ob/ob) mice are important NAFL animal models. However, the comparison of these mouse models with human NAFL is still unclear.
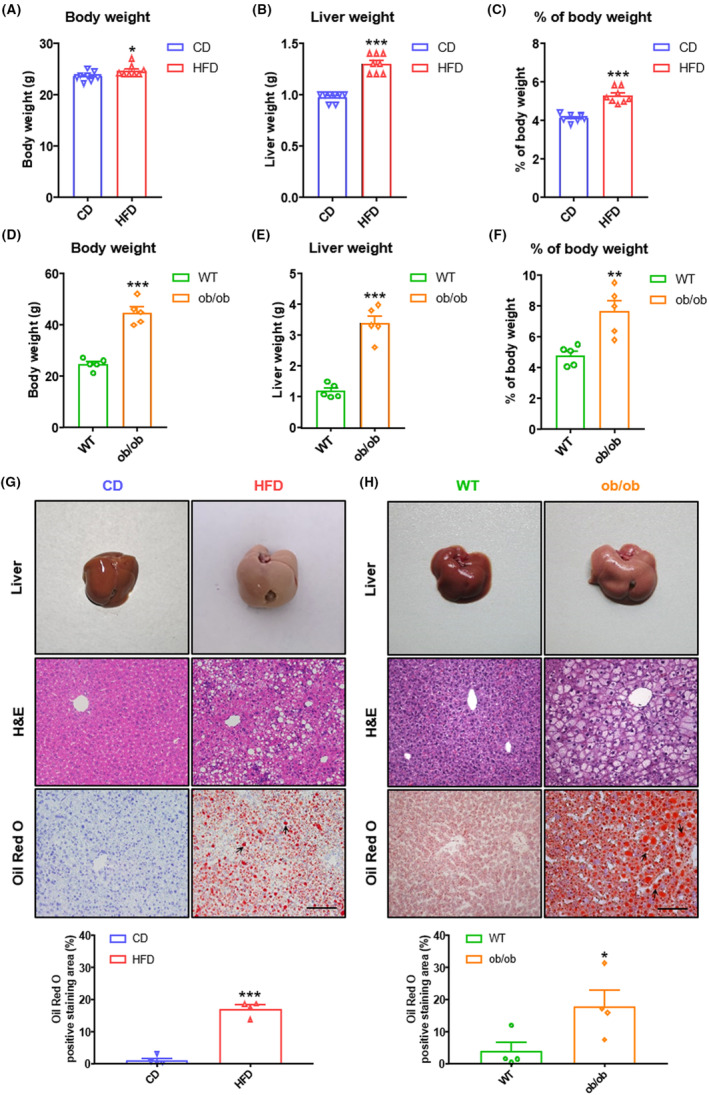
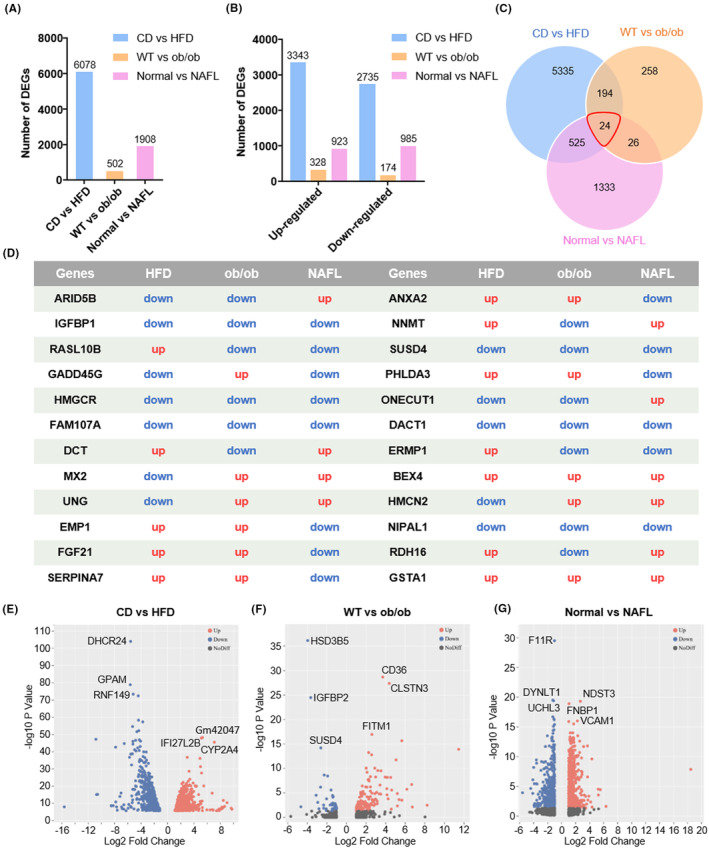
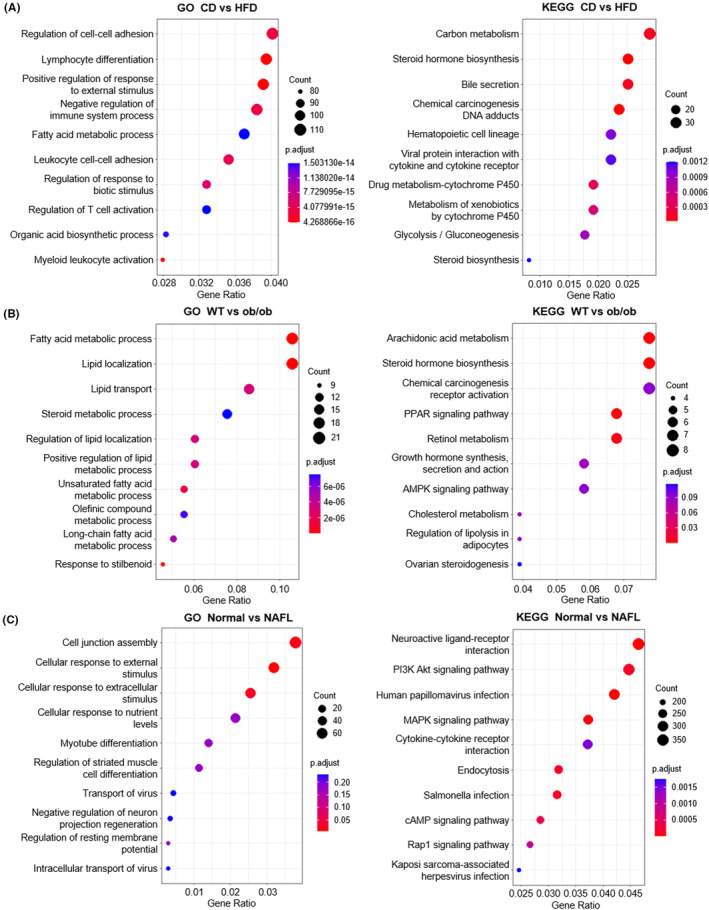
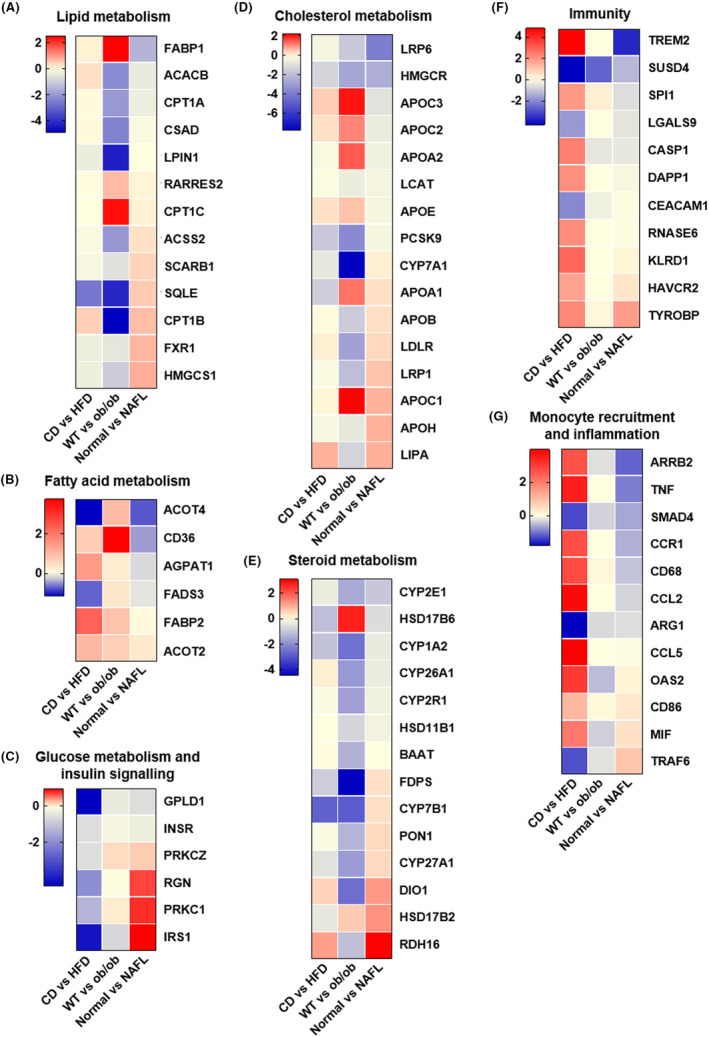
Methods: In this study, HFD-fed mice and ob/ob mice were used as NAFL animal models. Liver histopathological characteristics were compared, and liver transcriptome from both mouse models was performed using RNA sequencing (RNA-seq). RNA-seq data obtained from the livers of NAFL patients was downloaded from the GEO database. Global gene expression profiles in the livers were further analyzed using functional enrichment analysis and the Kyoto Encyclopedia of Genes and Genomes (KEGG) pathway.
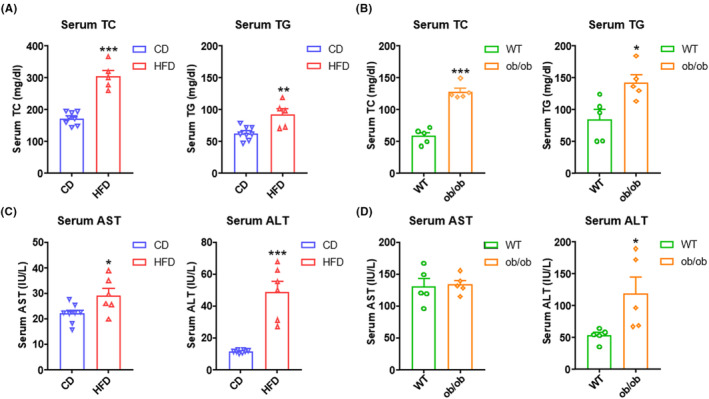
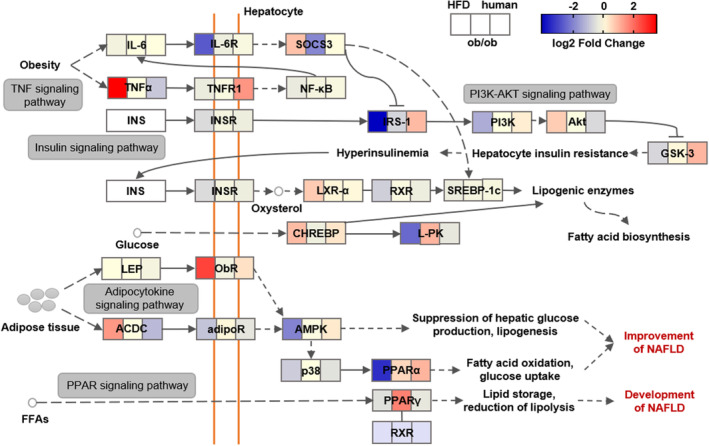
Results: Our results showed that the biochemical parameters of both mouse models and human NAFL were similar. Compared with HFD-fed mice, ob/ob mice were more similar in histologic appearance to NAFL patients. The liver transcriptome characteristics partly overlapped in mice and humans. Furthermore, in the NAFL pathway, most genes showed similar trends in mice and humans, thus demonstrating that both types of mice can be used as models for basic research on NAFL, considering the differences.
Conclusion: Our findings show that HFD-fed mice and ob/ob mice can mimic human NAFL partly in pathophysiological process. The comparative analysis of liver transcriptome profile in mouse models and human NAFL presented here provides insights into the molecular characteristics across these NAFL models.
Keywords: animal model; high-fat diet; nonalcoholic fatty liver disease; ob/ob mice; transcriptomics.
© 2023 The Authors. Animal Models and Experimental Medicine published by John Wiley & Sons Australia, Ltd on behalf of The Chinese Association for Laboratory Animal Sciences.
Conflict of interest statement
The authors declare no conflicts of interest.
Figures
Similar articles
-
Bioinformatics analysis reveals novel core genes associated with nonalcoholic fatty liver disease and nonalcoholic steatohepatitis.Gene. 2020 Jun 5;742:144549. doi: 10.1016/j.gene.2020.144549. Epub 2020 Mar 14. Gene. 2020. PMID: 32184169
-
Hepatic transcriptome signatures in patients with varying degrees of nonalcoholic fatty liver disease compared with healthy normal-weight individuals.Am J Physiol Gastrointest Liver Physiol. 2019 Apr 1;316(4):G462-G472. doi: 10.1152/ajpgi.00358.2018. Epub 2019 Jan 17. Am J Physiol Gastrointest Liver Physiol. 2019. PMID: 30653341
-
Nonalcoholic Fatty Liver Disease Demonstrates a Pre-fibrotic and Premalignant Molecular Signature.Dig Dis Sci. 2019 May;64(5):1257-1269. doi: 10.1007/s10620-018-5398-4. Epub 2018 Dec 5. Dig Dis Sci. 2019. PMID: 30519850 Free PMC article.
-
A Comparison of the Gene Expression Profiles of Non-Alcoholic Fatty Liver Disease between Animal Models of a High-Fat Diet and Methionine-Choline-Deficient Diet.Molecules. 2022 Jan 27;27(3):858. doi: 10.3390/molecules27030858. Molecules. 2022. PMID: 35164140 Free PMC article. Review.
-
Nonalcoholic Fatty Liver Disease vs. Nonalcoholic Steatohepatitis: Pathological and Clinical Implications.Curr Vasc Pharmacol. 2018;16(3):214-218. doi: 10.2174/1570161115666170621075157. Curr Vasc Pharmacol. 2018. PMID: 28676025 Review.
Cited by
-
Heterozygous GAA knockout is nonconsequential on metabolism and the spatial liver transcriptome in high-fat diet-induced obese and prediabetic mice.Physiol Rep. 2025 Mar;13(6):e70276. doi: 10.14814/phy2.70276. Physiol Rep. 2025. PMID: 40108792 Free PMC article.
-
Expression of immune related genes and possible regulatory mechanisms in different stages of non-alcoholic fatty liver disease.Front Immunol. 2024 Mar 8;15:1364442. doi: 10.3389/fimmu.2024.1364442. eCollection 2024. Front Immunol. 2024. PMID: 38524129 Free PMC article.
-
Pathogenicity and transcriptomic profiling reveals immunology molecular hallmarks after CA10 virus infection.Animal Model Exp Med. 2024 Oct;7(5):717-731. doi: 10.1002/ame2.12415. Epub 2024 May 15. Animal Model Exp Med. 2024. PMID: 38747004 Free PMC article.
-
Feasibility of Serum Galectin-1 as a Diagnostic Biomarker for Metabolic Dysfunction-Associated Steatotic Liver Disease: A Study on a Segment of the Chinese Population Using Convenience Sampling.Biomedicines. 2025 Feb 10;13(2):425. doi: 10.3390/biomedicines13020425. Biomedicines. 2025. PMID: 40002838 Free PMC article.
-
Therapeutic Effects of Mesenchymal Stromal Cells Require Mitochondrial Transfer and Quality Control.Int J Mol Sci. 2023 Oct 31;24(21):15788. doi: 10.3390/ijms242115788. Int J Mol Sci. 2023. PMID: 37958771 Free PMC article. Review.
References
-
- Powell EE, Wong VW, Rinella M. Non‐alcoholic fatty liver disease. Lancet. 2021;397(10290):2212‐2224. - PubMed
-
- Le MH, Le DM BTC, et al. Global incidence of non‐alcoholic fatty liver disease: a systematic review and meta‐analysis of 63 studies and 1,201,807 persons. J Hepatol. 2023;79:287‐295. - PubMed
-
- Lazarus JV, Mark HE, Anstee QM, et al. Advancing the global public health agenda for NAFLD: a consensus statement. Nat Rev Gastroenterol Hepatol. 2022;19(1):60‐78. - PubMed
-
- Younossi Z, Anstee QM, Marietti M, et al. Global burden of NAFLD and NASH: trends, predictions, risk factors and prevention. Nat Rev Gastroenterol Hepatol. 2018;15(1):11‐20. - PubMed
Publication types
MeSH terms
LinkOut - more resources
Full Text Sources
Medical
Research Materials
Miscellaneous
