. 2023 Dec 13;214(3):235-248.
doi: 10.1093/cei/uxad095.

Compartment-driven imprinting of intestinal CD4 T cells in inflammatory bowel disease and homeostasis

Affiliations

Compartment-driven imprinting of intestinal CD4 T cells in inflammatory bowel disease and homeostasis

Lisanne Lutter et al. Clin Exp Immunol. .

Abstract

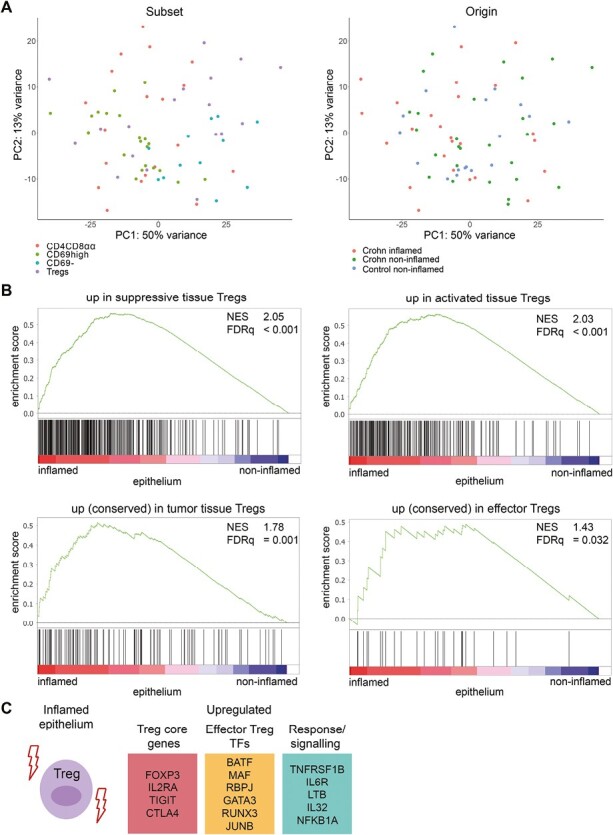
The mucosal immune system is implicated in the etiology and progression of inflammatory bowel diseases. The lamina propria and epithelium of the gut mucosa constitute two separate compartments, containing distinct T-cell populations. Human CD4 T-cell programming and regulation of lamina propria and epithelium CD4 T cells, especially during inflammation, remain incompletely understood. We performed flow cytometry, bulk, and single-cell RNA-sequencing to profile ileal lamina propria and intraepithelial CD4 T cells (CD4CD8αα, regulatory T cells (Tregs), CD69- and CD69high Trm T cells) in controls and Crohn's disease (CD) patients (paired non-inflamed and inflamed). Inflammation results in alterations of the CD4 T-cell population with a pronounced increase in Tregs and migrating/infiltrating cells. On a transcriptional level, inflammation within the epithelium induced T-cell activation, increased IFNγ responses, and an effector Treg profile. Conversely, few transcriptional changes within the lamina propria were observed. Key regulators including the chromatin remodelers ARID4B and SATB1 were found to drive compartment-specific transcriptional programming of CD4 T(reg) cells. In summary, inflammation in CD patients primarily induces changes within the epithelium and not the lamina propria. Additionally, there is compartment-specific CD4 T-cell imprinting, driven by shared regulators, between the lamina propria and the epithelium. The main consequence of intraepithelial adaptation, irrespective of inflammation, seems to be an overall dampening of broad (pro-inflammatory) responses and tight regulation of lifespan. These data suggest differential regulation of the lamina propria and epithelium, with a specific regulatory role in the inflamed epithelium.

Keywords: CD4 T cells; RNA-sequencing; adaptation; inflammatory bowel diseases; small intestine.


Conflict of interest statement

The authors declare no competing interest.

Figures

Graphical Abstract
Graphical Abstract
Figure 1.
Figure 1.
T-cell composition of the human ileum in health and Crohn’s disease. (A) Relative composition of T-cell receptor (TCR)γδ, CD8, CD4 effector (Teff, CD127+CD25), CD4CD8αα (CD4+CD8α+), CD4 regulatory T cells (Tregs, CD127lowCD25high), and TCRγδCD8CD4 cells in the epithelium (upper row) and lamina propria (lower row) of control subjects (C), non-inflamed (NI), and inflamed (I) ileum of Crohn’s disease (CD) patients. Lines connect the paired non-inflamed and inflamed datapoints from the patients with CD. Control subjects n = 5, CD n = 8. (B) Relative composition within CD4 effector T cells of tissue-resident memory (CD45RACD69+), memory (CD45RACD69), CD4 naive (CD45RA+CD69), and recently activated (CD45RA+CD69+) T cells, similar to A. Control subjects n = 5, CD n = 8. Comparisons were performed with a two-tailed Mann–Whitney U test for control subject versus non-inflamed CD and Wilcoxon test for paired non-inflamed versus inflamed CD
Figure 2.
Figure 2.
Effector Treg profile in the inflamed epithelium. (A) Unsupervised principal component analysis of all CD4 T-cell subsets analyzed by bulk RNA-sequencing colored on subset (ie, CD4CD8αα T cells, CD69high Trm cells, CD69 T cells and Tregs, left)), and status (ie, CD inflamed, CD non-inflamed, and  control non-inflamed; right). (B) Gene set enrichment analysis of suppressive [19] (upper left), activated [19] (upper right), tumor-derived tissue Treg [18] (lower left), and conserved human effector Treg [20] (lower right) signatures in pairwise comparisons of Tregs derived from non-inflamed and inflamed ileum of CD patients, represented by the normalized enrichment score (NES) and FDR statistical value (FDRq). (C) Selected genes upregulated in Tregs in the inflamed epithelium. TFs: transcription factors. CD inflamed/non-inflamed n = 4, control n = 3
Figure 3.
Figure 3.
Mucosal sub-compartment shapes the transcriptomic profile of CD4 T cells. (A) Unsupervised principal component analysis of all CD4 T-cell subsets analyzed by bulk RNA-sequencing colored on compartment of residence (i.e. epithelium and lamina propria). (B) Selected biological process terms related to the upregulated genes in the lamina propria for CD69high Trm cells, and in the epithelium for CD4CD8αα T cells and Tregs. CD inflamed/non-inflamed n = 4, control n = 3
Figure 4.
Figure 4.
CD4 T-cell clusters in the paired non-inflamed and inflamed ileum. (A) Dimensionality reduction of all CD4 T cells (CD3+TCRγδCD4+) from the epithelium and lamina propria of four patients with Crohn’s disease. Cells are colored based on the assigned cluster. (B) As per A colored on the compartment (IEL = intraepithelial T cell, LPL = lamina propria T cell) and status (I = inflamed, NI = non-inflamed). (C) As per A colored on surface marker-based identification. CD4CD8αα T cell = CD4+CD8α+, effector T cell (Teff) = CD4+CD127+CD25, Treg = CD127CD25+. (D) Reproducible composition of the CD4 T cells across the four included patients. y-axis: fraction of cells colored on the cluster as shown in A and separated per patient on the x-axis. (E) Composition of the compartment (epithelium/lamina propria) and status (non-inflamed/inflamed) origins per cluster. y-axis: fraction of cells colored on compartment and separated per cluster as shown in A on the x-axis. (F) Composition of CD69 protein expression among non-inflamed (NI) and inflamed (I) derived CD4 T cells for all clusters, separated by low (negative), intermediate, and high CD69 expression. y-axis: fraction of cells colored on CD69 expression, and separated per cluster, and non-inflamed/inflamed ileum. CD inflamed/non-inflamed n = 4
Figure 5.
Figure 5.
Predicted key regulators of epithelial adaptation of CD4 T cells. (A) Network inference of key-regulators driving adaptation of CD4 T cells to the epithelium on RNA level, based on unsupervised gene regulatory network analysis followed by gene set enrichment analysis of the transcription factors (TFs) and co-factors (pink = upregulation, blue = downregulation). The gray lines indicate connections between regulators (TFs) and their downstream targets (only TFs are shown); the line thickness represents the correlation weight (thicker = higher correlation). Square size indicates −log10(p) for each comparison, with the P(-value) derived from differential expression analysis (log2 fold change >0.5 and P-adjusted value <0.1); text size represents the RegEnrich score; for both, larger indicates higher scores (Supplementary Table S3). CD inflamed, non-inflamed, and control subjects combined n = 11

Similar articles

Cited by

References

    1. Chang JT. Pathophysiology of inflammatory bowel diseases. N Engl J Med 2020, 383, 2652–64. doi:10.1056/NEJMra2002697 - DOI - PubMed
    1. Mowat AM, Agace WW.. Regional specialization within the intestinal immune system. Nat Rev Immunol 2014, 14, 667–85. doi:10.1038/nri3738 - DOI - PubMed
    1. Lutter L, Hoytema van Konijnenburg DP, Brand EC, Oldenburg B, van Wijk F.. The elusive case of human intraepithelial T cells in gut homeostasis and inflammation. Nat Rev Gastroenterol Hepatol 2018, 15, 637–49. doi:10.1038/s41575-018-0039-0 - DOI - PubMed
    1. Kumar B V, Ma W, Miron M, Granot T, Guyer RS, Carpenter DJ, et al. . Human tissue-resident memory T cells are defined by core transcriptional and functional signatures in lymphoid and mucosal sites. Cell Rep 2017, 20, 2921–34. doi:10.1016/j.celrep.2017.08.078 - DOI - PMC - PubMed
    1. Fiocchi C, Battisto JR, Farmer RG.. Gut mucosal lymphocytes in inflammatory bowel disease: isolation and preliminary functional characterization. Dig Dis Sci 1979, 24, 705–17. doi:10.1007/BF01314469 - DOI - PubMed

Publication types