. 2023 Aug 11;19(8):e1011356.
doi: 10.1371/journal.pcbi.1011356. eCollection 2023 Aug.

Influence of cell type specific infectivity and tissue composition on SARS-CoV-2 infection dynamics within human airway epithelium

Affiliations

Influence of cell type specific infectivity and tissue composition on SARS-CoV-2 infection dynamics within human airway epithelium

Benjamin Raach et al. PLoS Comput Biol. .

Abstract

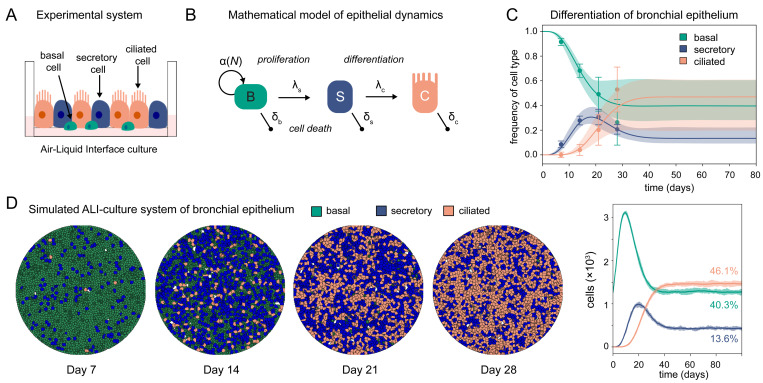
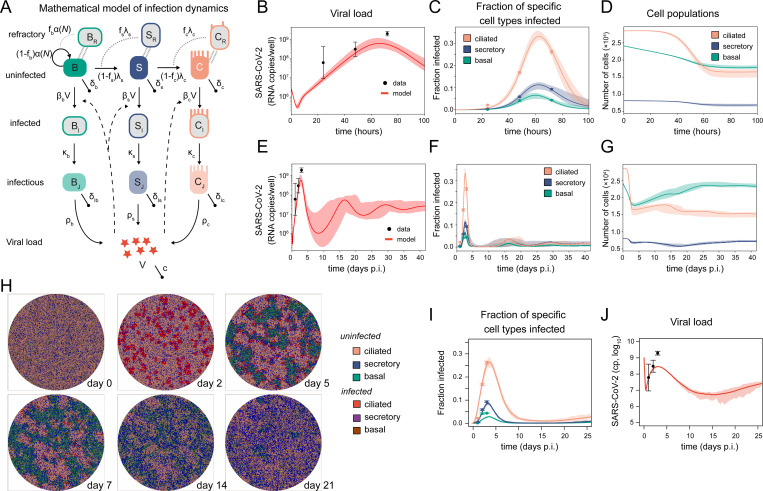
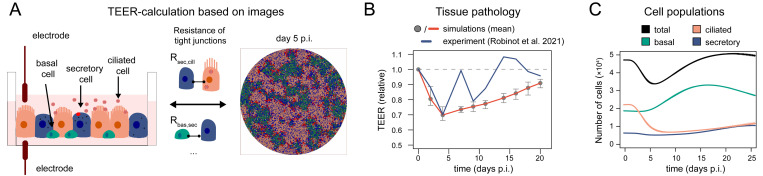
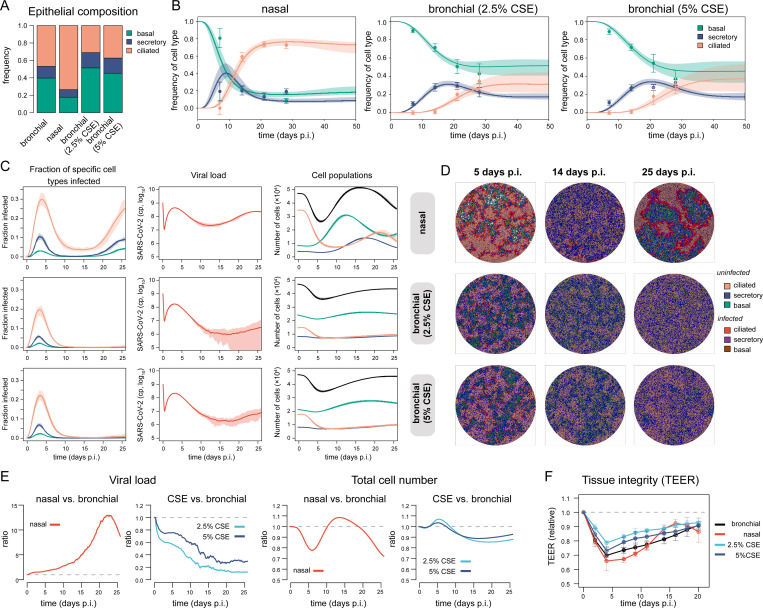
Human airway epithelium (HAE) represents the primary site of viral infection for SARS-CoV-2. Comprising different cell populations, a lot of research has been aimed at deciphering the major cell types and infection dynamics that determine disease progression and severity. However, the cell type-specific replication kinetics, as well as the contribution of cellular composition of the respiratory epithelium to infection and pathology are still not fully understood. Although experimental advances, including Air-liquid interface (ALI) cultures of reconstituted pseudostratified HAE, as well as lung organoid systems, allow the observation of infection dynamics under physiological conditions in unprecedented level of detail, disentangling and quantifying the contribution of individual processes and cells to these dynamics remains challenging. Here, we present how a combination of experimental data and mathematical modelling can be used to infer and address the influence of cell type specific infectivity and tissue composition on SARS-CoV-2 infection dynamics. Using a stepwise approach that integrates various experimental data on HAE culture systems with regard to tissue differentiation and infection dynamics, we develop an individual cell-based model that enables investigation of infection and regeneration dynamics within pseudostratified HAE. In addition, we present a novel method to quantify tissue integrity based on image data related to the standard measures of transepithelial electrical resistance measurements. Our analysis provides a first aim of quantitatively assessing cell type specific infection kinetics and shows how tissue composition and changes in regeneration capacity, as e.g. in smokers, can influence disease progression and pathology. Furthermore, we identified key measurements that still need to be assessed in order to improve inference of cell type specific infection kinetics and disease progression. Our approach provides a method that, in combination with additional experimental data, can be used to disentangle the complex dynamics of viral infection and immunity within human airway epithelial culture systems.


Conflict of interest statement

The authors have declared that no competing interests exist.

Figures

Fig 1
Fig 1. Cell differentiation dynamics in ALI-culture systems of human airway epithelium.
(A) Sketch of human airway epithelial culture system. (B) Schematic of a mathematical model describing cell differentiation and turnover for human airway epithelial cell cultures distinguishing between basal (B), secretory (S) and ciliated (C) cells. For details see Materials and Methods. (C) Relative proportion of each cell type during differentiation of ALI-cultures of bronchial epithelium. Mean and standard deviation of the experimental data from [21] (dots/whiskers), with the predicted dynamics obtained when fitting the model shown in (B) to these data. The best fit (solid line) and 90%-prediction intervals for each cell type are shown (basal-green, secretory-blue, ciliated-orange). (D) Cellular Potts model of ALI-culture system mimicking pseudo-stratified epithelium at different time points during differentiation. Basal cells (green) are “overgrown” by secretory (blue) and ciliated (orange) cells. For graphical clarity, a reduced cell culture system is simulated starting with only ~1265 cells in total with Nmax = 4085 cells. The average and range of n = 10 individual simulations using the best parameterization (Table 1) are shown with numbers indicating the average frequency of each cell type around day 80 post seeding (basal: 40.3% [39.3%, 42.5%], secretory: 13.6% [12.7%, 14.8%], ciliated: 46.1% [44.3%, 47.8%] (mean [min-max] across 10 simulations) (see also Movie1 at https://github.com/GrawLab/SARS-ALIculture).
Fig 2
Fig 2. Cell-type specific infection kinetics.
(A) Schematic of a viral dynamics model for SARS-CoV-2 infection within human airway epithelium considering uninfected (X), infected (XI) and infectious/productively infected cells (XJ) for each of the different cell types X∈{B,S,C}. In addition, a population of cells being refractory to infection (XR) is considered for each cell type to account for spatial separation and possible innate immune protection of cells (grey arrows). (B-D) Measured (dots) and predicted (lines/shaded area) for the viral load (B), relative proportion of infected cell types (C) and total cell count for each cell type (D) by fitting the model shown in (A) to data on SARS-CoV-2 infection of ALI-cultures of bronchial epithelium analyzed by scRNA-seq [27] are shown. Model predictions for the best estimate (solid line) and prediction bands (shaded area) based on the 90%-credible intervals of parameter estimates in the last ABC-generation (Table 3) are shown. (E-G) Predicted long-term oscillatory dynamics of the individual components. (H) Snapshots of the individual-cell based model simulating SARS-CoV-2 infection dynamics within bronchial epithelial tissue considering ~4.7×10⁴ cells in total (see also Movie2 at https://github.com/GrawLab/SARS-ALIculture). (I-J) Relative proportion of infected cells (I) and viral load dynamics (J) with the mean (solid line) and maximal range (shaded area) over 10 independent simulated cultures.
Fig 3
Fig 3. Determining tissue integrity.
(A) Schematic of relating experimental measurements of transepithelial electrical resistance to image data based on individual cell tight junctions and spatial patterns. (B) TEER-dynamics for simulations of bronchial tissue (grey dots/red line) in comparison to previous experimental measurements from the literature (blue line) [12]. Data points indicate the mean (dots/red solid line) and min-max range (whiskers) across 10 independent simulation runs. (C) Corresponding dynamics of total and cell type specific cell numbers across the 10 simulations (mean–solid line, range–shaded area). Variations are minor with regard to the population sizes making the ranges hardly visible.
Fig 4
Fig 4. Tissue composition and infection kinetics.
(A) Composition of bronchial and nasal airway epithelium, including bronchial epithelium exposed to cigarette smoke extract (CSE) at different concentrations [21,36]. (B) Relative proportion of each cell type during differentiation of ALI-cultures of the particular epithelium based on previous experimental data (mean/standard deviation = dots/whiskers) [21,36] with model predictions fitting the regeneration model shown in Fig 1B to the data. The best fit (solid line) and 90%-prediction intervals for each cell type are shown (basal-green, secretory-blue, ciliated-orange) with parameter estimates given in Table 3. (C) Simulated dynamics for the relative proportion of specific cell types infected, viral load, and total cell numbers during SARS-CoV-2 infection given different ALI-culture conditions. The mean and range (min-max) over 10 independent simulations for each condition are shown. (D) Corresponding snapshots of infection patterns at specific time points (see also Movie 3–5 at https://github.com/GrawLab/SARS-ALIculture). (E) Relative size of viral load and total cell population of the different tissue conditions using bronchial epithelium as a baseline. The ratio of the means across 10 simulations each are calculated. (F) TEER measurements across 5 (nasal, CSE) and 10 (bronchial) independent simulations for each condition relative to each TEER measurement at day 0.

Similar articles

References

    1. Mulay A, Konda B, Garcia G Jr., Yao C, Beil, Villalba JM, et al.. SARS-CoV-2 infection of primary human lung epithelium for COVID-19 modeling and drug discovery. Cell Rep. 2021;35(5):109055. Epub 20210413. doi: 10.1016/j.celrep.2021.109055 ; PubMed Central PMCID: PMC8043574. - DOI - PMC - PubMed
    1. V’Kovski P, Kratzel A, Steiner S, Stalder H, Thiel V. Coronavirus biology and replication: implications for SARS-CoV-2. Nat Rev Microbiol. 2021;19(3):155–70. Epub 20201028. doi: 10.1038/s41579-020-00468-6 ; PubMed Central PMCID: PMC7592455. - DOI - PMC - PubMed
    1. Davis JD, Wypych TP. Cellular and functional heterogeneity of the airway epithelium. Mucosal Immunol. 2021;14(5):978–90. Epub 20210219. doi: 10.1038/s41385-020-00370-7 ; PubMed Central PMCID: PMC7893625. - DOI - PMC - PubMed
    1. Crystal RG, Randell SH, Engelhardt JF, Voynow J, Sunday ME. Airway epithelial cells: current concepts and challenges. Proc Am Thorac Soc. 2008;5(7):772–7. doi: 10.1513/pats.200805-041HR ; PubMed Central PMCID: PMC5820806. - DOI - PMC - PubMed
    1. Herriges M, Morrisey EE. Lung development: orchestrating the generation and regeneration of a complex organ. Development. 2014;141(3):502–13. doi: 10.1242/dev.098186 ; PubMed Central PMCID: PMC3899811. - DOI - PMC - PubMed

Publication types