. 2023 Aug 22;120(34):e2306153120.
doi: 10.1073/pnas.2306153120. Epub 2023 Aug 11.

Transcriptomic analysis of the ocular posterior segment completes a cell atlas of the human eye

Affiliations

Transcriptomic analysis of the ocular posterior segment completes a cell atlas of the human eye

Aboozar Monavarfeshani et al. Proc Natl Acad Sci U S A. .

Abstract

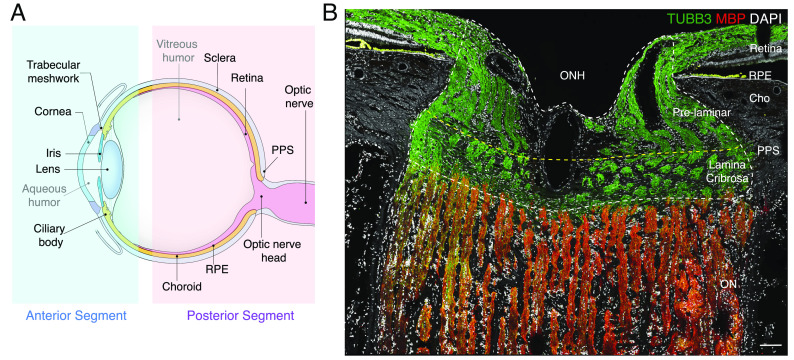
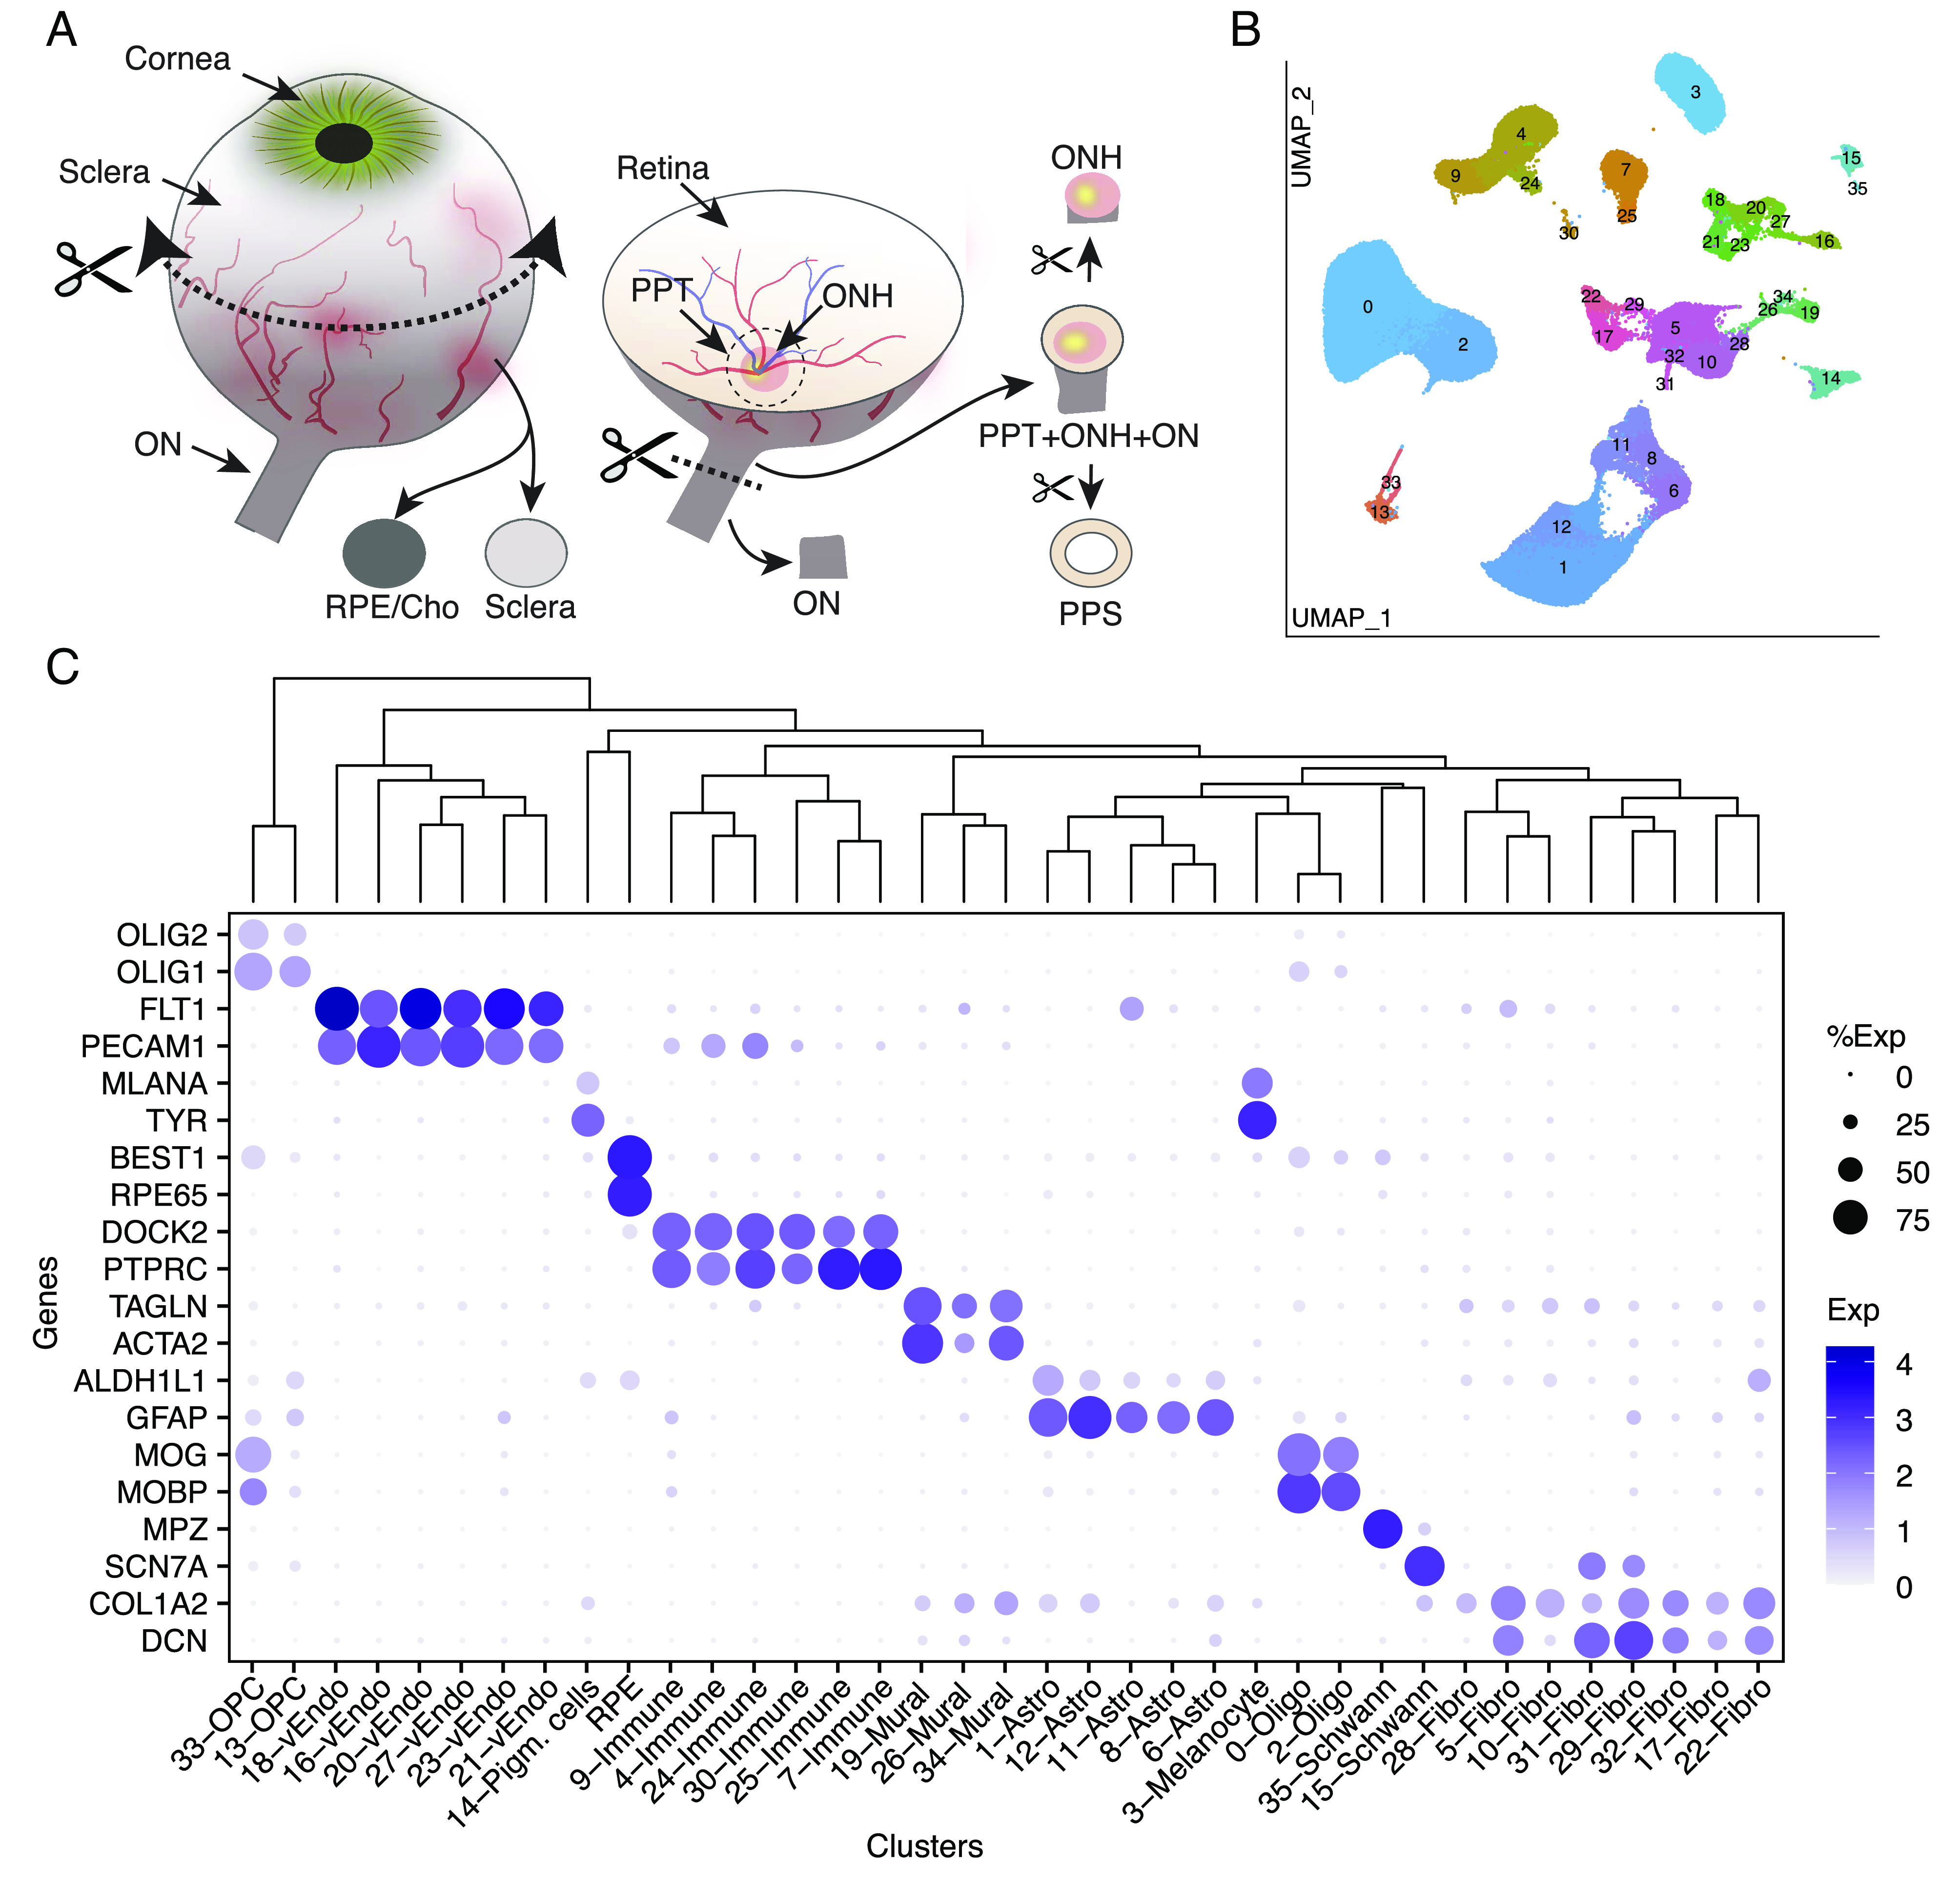
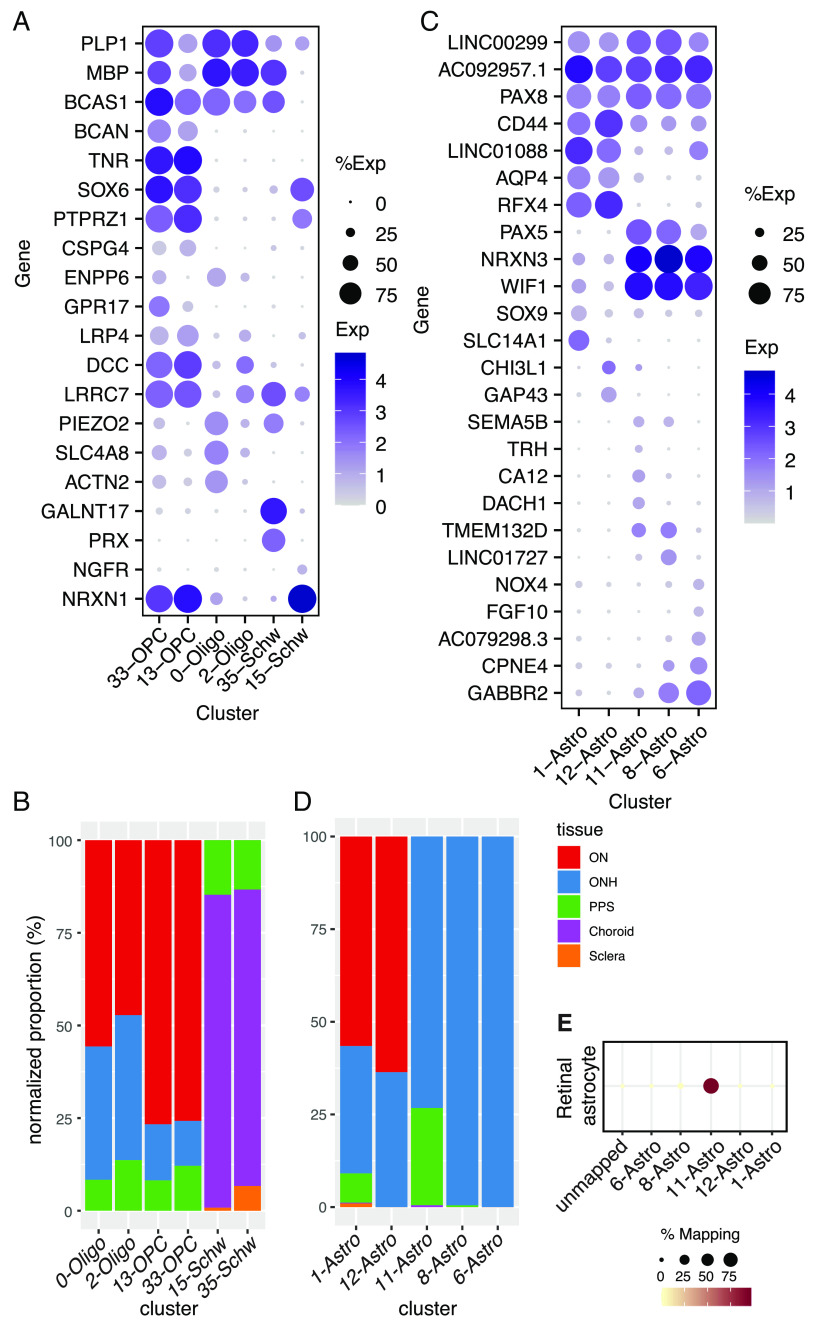
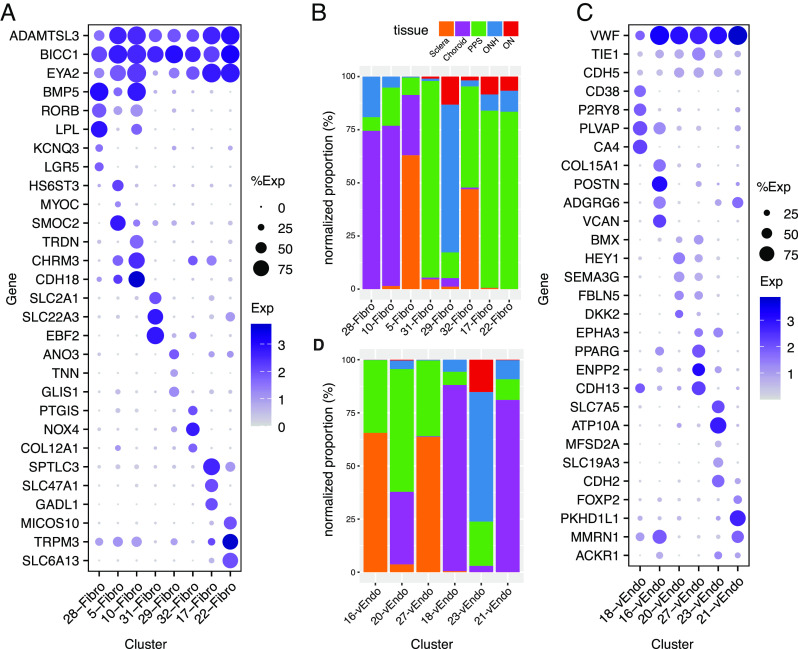
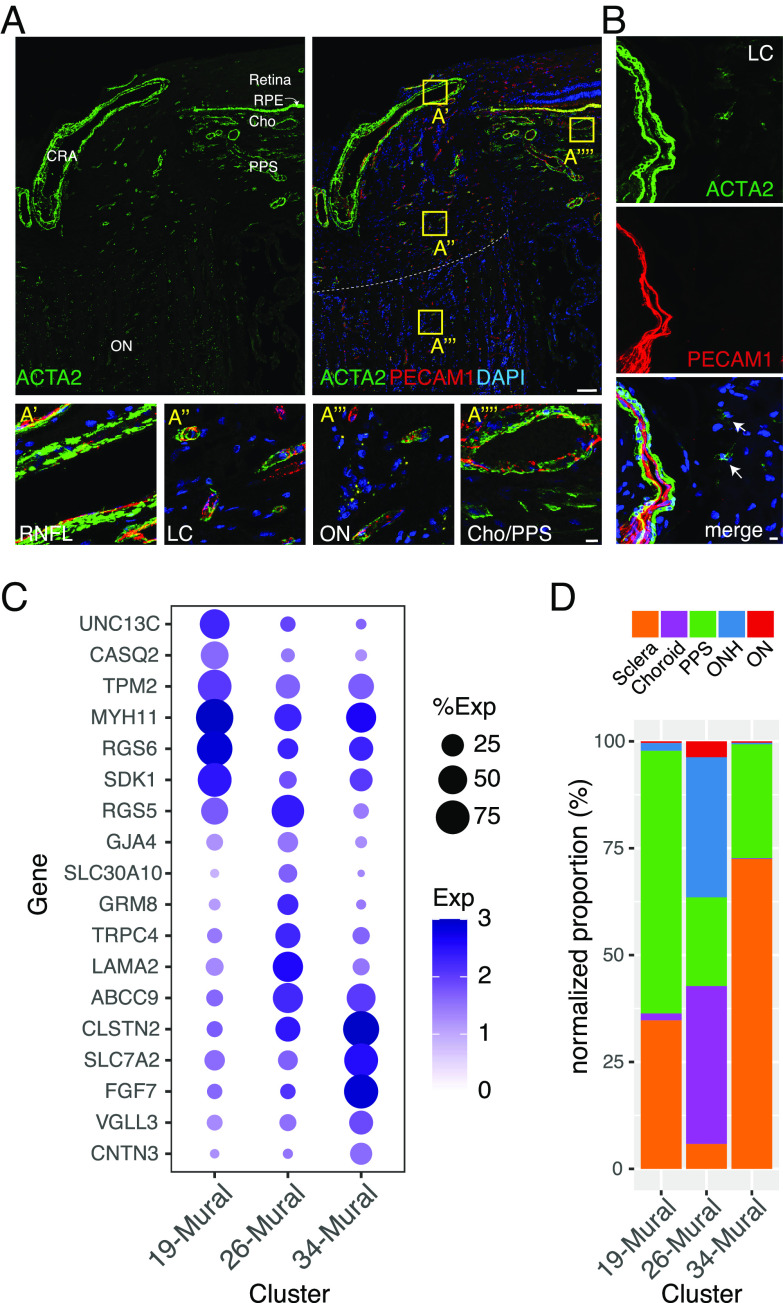
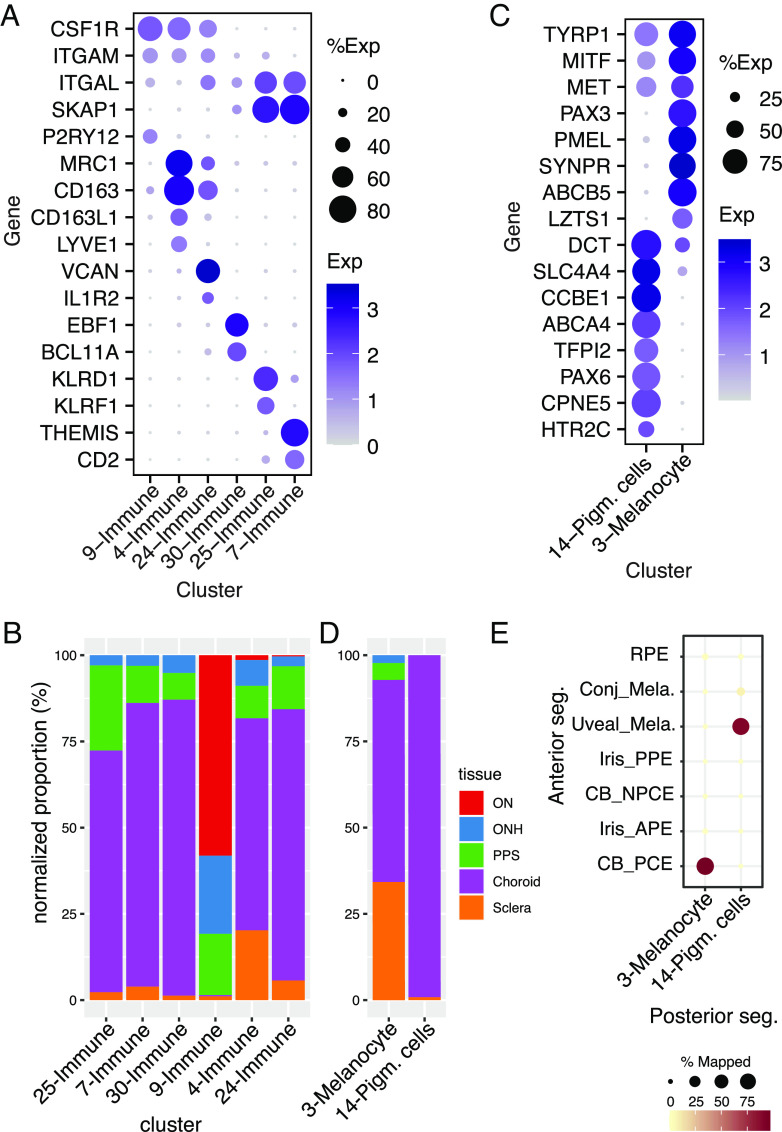
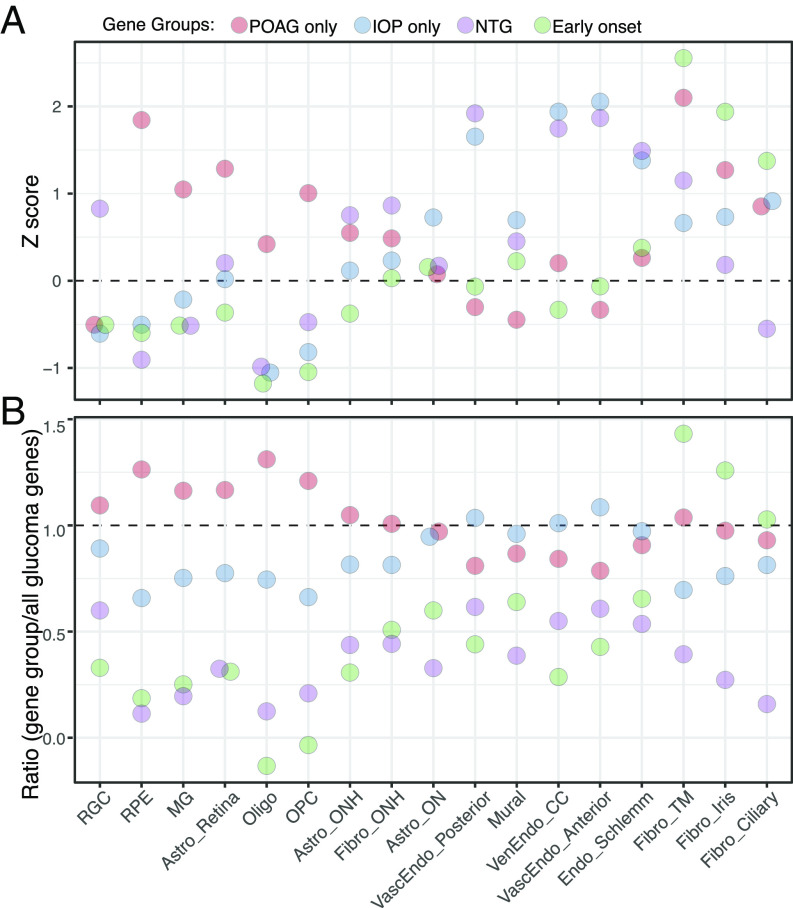
Although the visual system extends through the brain, most vision loss originates from defects in the eye. Its central element is the neural retina, which senses light, processes visual signals, and transmits them to the rest of the brain through the optic nerve (ON). Surrounding the retina are numerous other structures, conventionally divided into anterior and posterior segments. Here, we used high-throughput single-nucleus RNA sequencing (snRNA-seq) to classify and characterize cells in six extraretinal components of the posterior segment: ON, optic nerve head (ONH), peripheral sclera, peripapillary sclera (PPS), choroid, and retinal pigment epithelium (RPE). Defects in each of these tissues are associated with blinding diseases-for example, glaucoma (ONH and PPS), optic neuritis (ON), retinitis pigmentosa (RPE), and age-related macular degeneration (RPE and choroid). From ~151,000 single nuclei, we identified 37 transcriptomically distinct cell types, including multiple types of astrocytes, oligodendrocytes, fibroblasts, and vascular endothelial cells. Our analyses revealed a differential distribution of many cell types among distinct structures. Together with our previous analyses of the anterior segment and retina, the data presented here complete a "Version 1" cell atlas of the human eye. We used this atlas to map the expression of >180 genes associated with the risk of developing glaucoma, which is known to involve ocular tissues in both anterior and posterior segments as well as the neural retina. Similar methods can be used to investigate numerous additional ocular diseases, many of which are currently untreatable.

Keywords: astrocytes; choroid; glaucoma; lamina cribrosa; optic nerve head.


Conflict of interest statement

A.V.S. coauthored a paper (30) that included data provided by a consortium of which J.J.S. and D.J.Z. were members.

Figures

Fig. 1.
Fig. 1.
Anterior and posterior tissues of the human eye. (A) Diagram of the human eye and the optic nerve, depicted in sagittal cross-section. Structures represented in the ocular cell atlas are labeled. (B) Section of the optic nerve head (ONH) and surrounding tissues immunostained for myelin basic protein (MBP, red) and beta-tubulin (TUBB3, green). TUBB3 highlights bundles of axons in the retina and ONH, and MBP highlights myelinating oligodendrocytes in the optic nerve (ON). The scale bar shows 100 µm. PPS, peripapillary sclera; RPE, retinal pigment epithelium; Cho, choroid.
Fig. 2.
Fig. 2.
Collection of tissues from the posterior segment and initial transcriptomic analysis. (A) Schematic showing how tissues were dissected. Circumferential incision at the pars plana separated anterior and posterior segments, and tissues were dissected from the posterior segment using fine scissors and trephine tissue punches. (B) Clustering of single-nucleus expression profiles from all tissues visualized by UMAP. Each tissue was processed separately. RPE and cells from neural retina were removed before the remaining ~140 k nuclei were pooled together to generate the UMAP. (C) Dot plot showing genes selectively expressed by each cell type. In this and subsequent figures, the size of each circle is proportional to the percentage of nuclei within a cluster expressing the gene, and the color intensity depicts the average normalized transcript count in expressing cells. The dendrogram above the graph shows transcriptional relationships among cell types. ON, optic nerve; ONH, optic nerve head; PPT, peripapillary tissues; PPS, peripapillary sclera; RPE, retinal pigment epithelium; Cho, choroid; Oligo, oligodendrocytes; Endo, vascular endothelium; OPC, oligodendrocyte progenitor cell.
Fig. 3.
Fig. 3.
Glial cells. (A) Dot plot showing the expression of selected genes in oligodendrocyte, oligodendrocyte precursor cell (OPC), and Schwann cell clusters based on canonical markers (Fig. 2C). (B) Histogram showing the relative abundance of oligodendrocytes (Oligo), OPC, and Schwann clusters in five tissues. (C) Dot plot showing genes selectively expressed by all or some astrocyte types. (D) Histogram showing the relative abundance of each type of astrocyte in each tissue. (E) Transcriptional relationship of the astrocyte types identified in this study to retinal astrocytes profiled in van Zyl et al. (9). The color and size of each dot reflect the percentage of cells in retinal astrocytes (column) mapped to a corresponding type of astrocyte in the ON/ONH (rows).
Fig. 4.
Fig. 4.
Fibroblasts and vascular endothelial cells. (A) Dot plot showing genes selectively expressed by all or each fibroblast cluster. (B) Histogram showing the relative abundance of each type of fibroblasts in each tissue. (C) Dot plot showing genes selectively expressed by all or each vascular endothelial cell type. (D) Histogram showing the abundance of each endothelial cell type in each tissue.
Fig. 5.
Fig. 5.
Mural cells. (A and B) Immunostaining for ACTA2 (green) and/or PECAM1 (red) in the whole ONH (A) and LC region (B). Boxed areas in A are shown at higher magnification in lower panels. (C) Dot plot showing genes selectively expressed by cells in each mural cell cluster. (D) Histogram showing the abundance of the three mural types in each tissue. CRA, central retinal artery; RNFL, retinal nerve fiber layer. Bars show 100 µm in top panel A and 10 µm in B and lower panels of A.
Fig. 6.
Fig. 6.
Immune and pigmented cells. (A) Dot plot showing genes selectively expressed by each of the immune-related cell types. (B) Histogram showing the relative abundance of each immune-related cluster in each tissue. (C) Dot plot showing genes selectively expressed by each type of melanocytes. (D) Histogram showing the abundance of the pigmented cell clusters C3 and C14 in each tissue. (E) Confusion matrix showing transcriptional correspondence of C3 and C14 in the current dataset to those in the anterior segment described in van Zyl et al. (9) and to RPE.
Fig. 7.
Fig. 7.
Expression of genes implicated in glaucoma. (A) Cell-type specific enrichment z scores of groups of genes that have been associated with POAG but not IOP, IOP but not POAG, normal tension glaucoma (NTG), or early-onset/congenital glaucoma. (B) The ratio of cell-type specific enrichment scores of each gene group to cell-type specific enrichment scores of all glaucoma-associated genes (shown in SI Appendix, Fig. S7B and Table S5). CC, collector channel; MG, Müller glia, Vasc, vascular; Ven, venous; Endo, endothelium.

Update of

References

    1. Goel M., Picciani R. G., Lee R. K., Bhattacharya S. K., Aqueous humor dynamics: A review. Open Ophthalmol. J. 4, 52 (2010). - PMC - PubMed
    1. Nickla D. L., Wallman J., The multifunctional choroid. Prog. Retin. Eye Res. 29, 144–168 (2010). - PMC - PubMed
    1. Forrester J., et al. , Anatomy of the Eye and Orbit, the Eye Basic Sciences in Practice (Elsevier, 2016).
    1. Steinmetz J. D., et al. , Causes of blindness and vision impairment in 2020 and trends over 30 years, and prevalence of avoidable blindness in relation to VISION 2020: the Right to Sight: An analysis for the Global Burden of Disease Study. Lancet Glob Health 9, e144–e160 (2021). - PMC - PubMed
    1. Freund K. B., Sarraf D., Mieler W. F., Yannuzzi L. A., The retinal Atlas E-book (Elsevier Health Sciences, 2016).

Publication types