Case Reports
. 2023 Aug 11;19(8):e1011394.
doi: 10.1371/journal.pcbi.1011394. eCollection 2023 Aug.

Collaborative nowcasting of COVID-19 hospitalization incidences in Germany

Affiliations
Case Reports

Collaborative nowcasting of COVID-19 hospitalization incidences in Germany

Daniel Wolffram et al. PLoS Comput Biol. .

Abstract

Real-time surveillance is a crucial element in the response to infectious disease outbreaks. However, the interpretation of incidence data is often hampered by delays occurring at various stages of data gathering and reporting. As a result, recent values are biased downward, which obscures current trends. Statistical nowcasting techniques can be employed to correct these biases, allowing for accurate characterization of recent developments and thus enhancing situational awareness. In this paper, we present a preregistered real-time assessment of eight nowcasting approaches, applied by independent research teams to German 7-day hospitalization incidences during the COVID-19 pandemic. This indicator played an important role in the management of the outbreak in Germany and was linked to levels of non-pharmaceutical interventions via certain thresholds. Due to its definition, in which hospitalization counts are aggregated by the date of case report rather than admission, German hospitalization incidences are particularly affected by delays and can take several weeks or months to fully stabilize. For this study, all methods were applied from 22 November 2021 to 29 April 2022, with probabilistic nowcasts produced each day for the current and 28 preceding days. Nowcasts at the national, state, and age-group levels were collected in the form of quantiles in a public repository and displayed in a dashboard. Moreover, a mean and a median ensemble nowcast were generated. We find that overall, the compared methods were able to remove a large part of the biases introduced by delays. Most participating teams underestimated the importance of very long delays, though, resulting in nowcasts with a slight downward bias. The accompanying prediction intervals were also too narrow for almost all methods. Averaged over all nowcast horizons, the best performance was achieved by a model using case incidences as a covariate and taking into account longer delays than the other approaches. For the most recent days, which are often considered the most relevant in practice, a mean ensemble of the submitted nowcasts performed best. We conclude by providing some lessons learned on the definition of nowcasting targets and practical challenges.


Conflict of interest statement

The authors have declared that no competing interests exist.

Figures

Fig 1
Fig 1. Illustration of the nowcasting task.
Data available in real time (colored lines) is incomplete, and especially for recent dates, the values are considerably lower than the final corrected values (black line). Nowcasts (blue-shaded areas) aim to predict in real time what the final data points will be. The light gray line shows the initially reported value as available on the respective date.
Fig 2
Fig 2. Illustration of 7-day hospitalization incidences via individual-level timelines.
The reference date by which hospitalizations are counted is the date when the positive test of an ultimately hospitalized person is reported (green dots). However, hospitalizations only become known after they take place (red triangles) and are reported (blue squares). Individuals A-E are included in the 7-day hospitalization incidence of date t because their reference date falls within a 7-day window from t − 6 until t, even though some are reported as hospitalized later (individuals D and E). These hospitalizations only appear in the data with a delay and thus need to be predicted using a nowcasting method on day t. In principle, it is also possible that positive test, hospitalization and reporting all take place on the same day, as for individual C. In this case, there is no delay problem. We note that even though individuals F and G are hospitalized or reported within the period t − 6 to t, they are not counted in the 7-day hospitalization incidence for day t because the positive test is reported before t − 6. Individual H is not included because its reference date is after t.
Fig 3
Fig 3. Completeness of 7-day hospitalization incidences 0 to 70 days after the respective reference date.
First panel: temporal development over the considered study period, aggregated over states and age groups. Second: by state, ordered by initial reporting completeness (see Fig A1 in S1 Appendix for the definition of abbreviations). Third: by age group. Fourth: by weekday.
Fig 4
Fig 4. Illustration of an ensemble approach.
A set of individual nowcasts can be combined into an ensemble nowcast with different aggregation approaches. Here, the ensemble is computed as the quantile-wise mean of all nowcasts.
Fig 5
Fig 5. Nowcasts with a horizon of 0 days back.
Same-day nowcasts of the 7-day hospitalization incidence as issued on each day of the study period. Nowcasts are shown for the German national level.
Fig 6
Fig 6. Nowcasts with a horizon of 14 days back.
Nowcasts of the 7-day hospitalization incidence as issued 14 days after the respective date. Nowcasts are shown for the German national level.
Fig 7
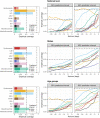
Fig 7. Score-based performance.
Shown is the mean WIS for the national level (top) and averaged across states (middle) and age groups (bottom). The first panel in each row displays the average across all horizons (on the absolute and relative scales). The decomposition into nowcast spread, underprediction, and overprediction (see Section 2.5) is represented by blocks of different color intensities. The absolute error is indicated by a diamond (⋄). The second and third panels in each row show the mean WIS and the relative WIS, respectively, stratified by horizon.
Fig 8
Fig 8. Empirical coverage of the prediction intervals.
Shown is the coverage for the national level (top), across states (middle), and across age groups (bottom). The first panel in each row displays the overall coverage of the 50% and 95% prediction intervals across all horizons. The second and third panels in each row show the empirical coverage of the 50% and 95% prediction intervals, respectively, stratified by horizon. The dashed lines indicate the desired nominal levels.
Fig 9
Fig 9. Scores and coverage on short horizons.
Shown are the mean WIS with absolute errors (top) and the empirical coverage (bottom) across horizons from 0 to -7 days.
Fig 10
Fig 10. Examples of time points when delay distributions were subject to sudden changes.
(A) Saxony, nowcast made on 22 November 2021: overwhelmed hospitals lead to severe underreporting and thus too low nowcasts. (B) Bremen, nowcast made on 11 January 2022: some incorrect entries got removed from the records, resulting in a downward correction and thus too high nowcasts. (C) Germany, nowcast made on 19 April 2022: following the Easter weekend with lower than usual initial reporting coverage, nowcasts were considerably too low. (D) Lower Saxony, nowcasts made on 20 April: after the Easter weekend, Epiforecasts issued very wide nowcast intervals, presumably due to numerical problems. The dashed lines indicate the time when the nowcasts were made. (Incidentally, in example (A), the horizons of 0 days and 1 day back were missing, see Table A3 in S1 Appendix).
Fig 11
Fig 11. Evaluation of retrospective model variations.
Comparison of variations of the ILM, KIT, LMU, and RKI models and the same models as submitted in real time. Shown are the mean WIS with absolute errors (top) and the empirical coverage (bottom). Results are comparable to those from Figs 7 and 8.
Fig 12
Fig 12. Sensitivity of the scores to the chosen “final” data.
Shown is the mean WIS computed with different data versions as the target. The version prespecified in the study protocol is 8 August 2022, marked by a vertical line. Top left: national level. Top right: averaged over states. Bottom left: averaged over age groups. The bottom right panel overlays the national-level data as of 8 August and 31 December to illustrate the importance of late revisions.
Fig 13
Fig 13. Performance based on the alternative target with a maximum delay of 40 days.
Shown are the mean WIS with absolute errors (top) and the empirical coverage (bottom) computed with respect to a revised target defined as the number of hospitalizations reported with a delay of up to 40 days. For the ILM model we used the revised model with a maximum delay of 42 days and also recomputed the ensembles with these revised nowcasts. For the other models, the assumed maximum delays are approximately aligned with the redefined target, see Table 1.

References

    1. Giannone D, Reichlin L, Small D. Nowcasting: The real-time informational content of macroeconomic data. Journal of Monetary Economics. 2008;55(4):665–676. doi: 10.1016/j.jmoneco.2008.05.010 - DOI
    1. England PD, Verrall RJ. Stochastic claims reserving in general insurance. British Actuarial Journal. 2002;8(3):443–518. doi: 10.1017/S1357321700003809 - DOI
    1. Cox DR, Medley GF. A process of events with notification delay and the forecasting of AIDS. Philosophical Transactions of the Royal Society of London B, Biological Sciences. 1989;325(1226):135–145. doi: 10.1098/rstb.1989.0078 - DOI - PubMed
    1. Höhle M, an der Heiden M. Bayesian nowcasting during the STEC O104:H4 outbreak in Germany, 2011. Biometrics. 2014;70(4):993–1002. doi: 10.1111/biom.12194 - DOI - PubMed
    1. Donker T, van Boven M, van Ballegooijen W, van’t Klooster T, Wielders C, Wallinga J. Nowcasting pandemic influenza A/H1N1 2009 hospitalizations in the Netherlands. European Journal of Epidemiology. 2011;26(3):195–201. doi: 10.1007/s10654-011-9566-5 - DOI - PMC - PubMed

Publication types