. 2023 Aug 11;9(32):eadg8869.
doi: 10.1126/sciadv.adg8869. Epub 2023 Aug 11.

Temporal scaling of dopamine neuron firing and dopamine release by distinct ion channels shape behavior

Affiliations

Temporal scaling of dopamine neuron firing and dopamine release by distinct ion channels shape behavior

Barbara Juarez et al. Sci Adv. .

Abstract

Dopamine is broadly implicated in reinforcement learning, but how patterns of dopamine activity are generated is poorly resolved. Here, we demonstrate that two ion channels, Kv4.3 and BKCa1.1, regulate the pattern of dopamine neuron firing and dopamine release on different time scales to influence separate phases of reinforced behavior in mice. Inactivation of Kv4.3 in VTA dopamine neurons increases ex vivo pacemaker activity and excitability that is associated with increased in vivo firing rate and ramping dynamics before lever press in a learned instrumental paradigm. Loss of Kv4.3 enhances performance of the learned response and facilitates extinction. In contrast, loss of BKCa1.1 increases burst firing and phasic dopamine release that enhances learning of an instrumental response and enhances extinction burst lever pressing in early extinction that is associated with a greater change in activity between reinforced and unreinforced actions. These data demonstrate that disruption of intrinsic regulators of neuronal activity differentially affects dopamine dynamics during reinforcement and extinction learning.


Figures

Fig. 1.
Fig. 1.. Targeted mutagenesis of Kcnd3 and Kcnma1 in dopamine neurons.
(A and B) RNAScope in situ hybridization for Kcnd3, Kcnma1, and Th. White arrows: Representative Th/Kcnd3/Kcnma1 overlap. Scale bars, 100 μm (A) and 50 μm (B). (C) Quantification of overlap for Kcnd3, Kcnma1, and Th in the VTA (N = 3 mice). (D) Schematic of AAV1-FLEX-SaCas9-sgKcnd3 targeting virus vector. (E) Proportion of targeted deep sequencing reads with indel mutations following sgKcnd3 targeting (N = 5 mice). (F) Average pre- and post-AmmTx A-type currents (IA) from control (left) and sgKcnd3 (right)–targeted mice (N = 4 cells per group; three mice per group) and corresponding depolarization step to elicit IA. (G) Average peak IA from (F) in control and sgKcnd3-targeted mice [two-way repeated measures (RM) analysis of variance (ANOVA), interaction effect: F1,6 =18.96, P < 0.01; group effect F1,6 = 22.6, P < 0.01; drug effect F1,6 = 16.1, P < 0.01; Sidak’s multiple comparison test; ***P < 0.001; Ncontrol = 4 cells, three mice, NsgKcnd3 = 4 cells, three mice]. (H) Schematic of AAV1-FLEX-SaCas9-sgKcnma1 targeting virus vector. (I) Proportion of targeted deep sequencing reads with indel mutations following sgKcnma1 targeting (N = 5 mice). (J) Average pre- and post-iberiotoxin potassium currents (IK) from control (left) and sgKcnma1 (right)–targeted mice (Ncontrol = 10 cells, four mice; NsgKcnma1 = 10 cells, three mice) and corresponding depolarization step to elicit IK. (K) Peak IK from (J) in control and sgKcnma1-targeted mice before (−) and after (+) iberiotoxin (two-way RM ANOVA, interaction effect: F1,18 = 18.37, P < 0.001; Sidak’s multiple comparison test, *P < 0.05 and ***P < 0.001; Ncontrol = 10 cells, four mice; NsgKcnma1 = 10 cells, three mice). Box and whisker graphs are presented as minimum-to-maximum. DAPI, 4′,6-diamidino-2-phenylindole; TTX, tetrodotoxin; ACSF, artificial cerebrospinal fluid; CMV, cytomegalovirus; ITR, inverted terminal repeat.
Fig. 2.
Fig. 2.. Kv4.3 and BKCa1.1 LOF alter the dopamine action potential waveform and activity.
(A) Average action potential waveform from spontaneously active VTA dopamine neurons (Ncontrol = 21 cells, seven mice; NKv4.3LOF = 16 cells, six mice; and NBKCa1.1 = 19 cells, seven mice). (B) Representative phase plane plot of action potential dynamics. (C) Action potential half width in control, Kv4.3 LOF, and BKCa1.1 LOF cells (one-way ANOVA: F2,53= = 9.109, P < 0.001; Dunnet’s multiple comparison test to controls, ***P < 0.001). (D) Decay kinetics of the action potential (one-way ANOVA: F2,53 = 10.67, P < 0.0001; Dunnet’s multiple comparison test to controls, ***P < 0.001). (E) After-hyperpolarization of the action potential (one-way ANOVA: F2,53 = 5.686, P < 0.01, Dunnet’s multiple comparison test to controls, *P < 0.05). (F) Resting membrane potential (one-way ANOVA: F2,53 = 6.026, P < 0.01, Dunnet’s multiple comparison test to controls, **P < 0.01). (G) Representative evoked excitability traces. (H) Current-voltage plot (two-way ANOVA, interaction effect: F16,408 = 1.143, P = 0.3126; Group effect: F2,51 = 4.495, P < 0.05; current effect: F8,408 = 69.36, P < 0.0001; Dunnet’s multiple comparison test to controls: *P < 0.05, **P < 0.01; Ncontrol = 19 cells, NKv4.3LOF = 15 cells, and NBKCa1.1LOF = 20 cells). (I) Representative spontaneous activity traces. (J) Firing rate of spontaneous activity (one-way ANOVA: F2,53 = 3.379, P < 0.05; Dunnet’s multiple comparison test to controls, *P < 0.05). (K) Coefficient of variation in the interspike interval (CV-ISI) of spontaneous activity (one-way ANOVA: F2,53 = 3.606, P < 0.05; Dunnet’s multiple comparison test to controls, *P < 0.05). [(C) to (F) and (J) and (K) Ncontrol = 21 cells, seven mice; NKv4.3LOF = 16 cells, six mice; NBKCa1.1 = 19 cells, seven mice]. (L) Burst rate in VTA dopamine neurons in vivo (one-way ANOVA: F2,116 = 5.673, P < 0.01; Dunnet’s multiple comparison test to controls, **P < 0.001). (M) Burst duration in VTA dopamine neurons in vivo (one-way ANOVA: F2,116 = 5.586, P < 0.01; Dunnet’s multiple comparison test to controls, *P < 0.05). [(L) and (M) Ncontrol = 28 cells, 7 mice; NKv4.3 LOF = 50 cells, 10 mice; and NBKCa1.1 = 41 cells, 9 mice]. Trace averages in (A) are presented as means + SEM, the inset traces are presented as averages. Box and whisker graphs are presented as min-to-max.
Fig. 3.
Fig. 3.. Instrumental reinforcement learning in control, Kv4.3, and BKCa1.1 LOF mice.
(A) Schematic of instrumental FR1 conditioning paradigm. (B) LPs across days (two-way RM ANOVA, interaction effect: F4,106 = 2.781, P < 0.05; Dunnet’s multiple comparison test to controls, **P < 0.01). (C) Cumulative LPs during day 1 (left) and day 3 (right) (two-way RM ANOVA, day 1: interaction effect: F118,3127 = 3.769, ****P < 0.0001; Dunnet’s multiple comparison test to controls, control versus BKCa1.1 LOF: P < 0.05 for 35 to 42 min and P < 0.01 for 43 to 60 min; day 3: interaction effect: F118,3127 = 1.455, **P < 0.01; Dunnet’s multiple comparison test to controls, control versus Kv4.3 LOF: P < 0.05 for 6 to 26 min and P < 0.01 for 3 to 5 min). (D) Day 1 LP ethograms. (E) Day 1 frequency distribution of IPI during the two halves of the session (two-way RM ANOVA, first half: interaction effect: F34,901 = 2.549, ****P < 0.0001; Dunnet’s multiple comparison test to controls, 30 s: P < 0.05 for control versus Kv4.3 LOF; second half: interaction effect: F72,1908 = 1.012, P = 0.4510). (F) Day 3 LP ethograms. (G) Day 3 frequency distribution of IPI during the two halves of the session [two-way RM ANOVA, first half: interaction effect: F72,1908 = 1.923, P < 0.0001; Dunnet’s multiple comparison test to controls, control versus Kv4.3 LOF (125 s), P < 0.0.05; second half: interaction effect: F72,1908 = 1.037, P = 0.3950]. [(B) to (G) Ncontrol = 19, NKv4.3LOF = 24, and NBKCa1.1LOF = 13]. (B) and (C) Data presented as means ± SEM. (E) and (G) Data presented as means ± SEM.
Fig. 4.
Fig. 4.. Differential action potential firing in putative dopamine neurons from control, Kv4.3 LOF, and BKCa1.1 LOF mice during instrumental conditioning.
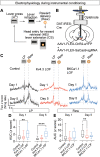
(A) Schematic of instrumental conditioning paradigm. (B) Illustration of optetrode microdrive placement in the VTA and injections of AAV1-FLEX-ChR2-eYFP + AAV1-FLEX-SaCas9-sgRNA injection in DAT-IRES-Cre mice. (C) Average peri-event z score for putative dopamine neurons responsive to LP in the VTA for day 1 (top row) and day 5 (middle row and bottom row) (day 1: Ncontrol = 17 cells, two mice; NKv4.3LOF = 39 cells, five mice; and NBKCa1.1LOF = 13 cells, three mice; day 5: Ncontrol = 8 cells, three mice; NKv4.3LOF = 16 cells, three mice; and NBKCa1.1LOF = 15 cells, three mice). (D) Average area under the curve (AUC) for the peri-event z score action potential firing post-LP period on day 1 (one-way ANOVA, F2,66 = 6.29, P = 0.0031, Fisher’s direct comparison to controls, **P < 0.01; Ncontrol = 17, two mice; NKv4.3LOF = 39 cell, five mice; and NBKCa1.1LOF = 13 cells, three mice) and day 5 (one-way ANOVA, F2,44 = 25.56, P < 0.001, Fisher’s direct comparison to controls, **P < 0.05, Ncontrol = 8 cells, two mice; NKv4.3LOF = 16 cells, three mice; and NBKCa1.1LOF = 15 cells, three mice). (E) Average AUC for the z score of action potential firing for post-Rew period on days 1 and 5 (day 1, one-way ANOVA, F2,66 = 4.07, P = 0.022; day 1: Ncontrol = 17 cells, two mice; NKv4.3LOF = 39 cells, five mice; and NBKCa1.1LOF = 13 cells, three mice; day 5: one-way ANOVA, F2,44 = 3.875, P = 0.028, Fisher’s direct comparison to controls, **P < 0.01; Ncontrol = 8 cells, three mice; NKv4.3LOF = 16 cells, three mice; and NBKCa1.1LOF = 15 cells, three mice). Averaged traces are presented as means + SEM. Box and whisker graphs are presented as min-to-max.
Fig. 5.
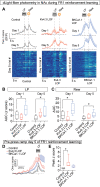
Fig. 5.. Differential dopamine dynamics in the NAc of control, Kv4.3 LOF, and BKCa1.1 LOF mice during instrumental conditioning.
(A) Average peri-event z score for dLight1.3b signals in the NAc for day 1 (top row) and day 5 (middle row and bottom row). (B) Average AUC for the perievent z score dLight1.3b signals post-LP period (3 s) (day 1, one-way ANOVA F2,14 = 4.456, P < 0.05; day 5, one-way ANOVA F2,14 = 2.867, P = 0.09, Fisher’s direct comparison to controls, *P < 0.05). (C) Average AUC for the perievent z score dLight1.3b signals post-Rew period (day 1, one-way ANOVA F2,14 = 6.701, P < 0.01; day 5, one-way ANOVA F2,14 = 2.468, P = 0.12, Fisher’s direct comparison to controls, *P < 0.05). (D) Zoomed average peri-event z score on day 5 for dLight1.3b in the NAc from panel A showing ramping in the pre-LP period. (E) Average ramp to peak z score from dLight1.3b signals in the NAc for pre-LP period (one-way ANOVA, F2,14 = 3.848, P < 0.05, Fisher’s direct comparisons to controls *P < 0.05). [(A) to (E) Ncontrol = 6 mice, NKv4.3LOF = 6 mice, and NBKCa1.1LOF = 5 mice]. Averaged traces are presented as means + SEM. Box and whisker graphs are presented as min-to-max.
Fig. 6.
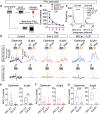
Fig. 6.. Extinction behavior and dopamine signal diametrically changes in Kv4.3 and BKCa1.1 LOF mice.
(A) Schematic of instrumental FR1 extinction paradigm. (B) LPs during days 1 to 5 of extinction training (two-way RM ANOVA, interaction effect: F8,132 = 7.180, P < 0.0001; Dunnet’s multiple comparison test to controls, ***P < 0.001 Kv4.3 versus control and BKCa1.1 versus control). (C) Frequency distribution of LPs during the first and second half of the conditioning session for day 1 of extinction (two-way RM ANOVA, first half: interaction effect: F72,1152 = 10.31, ****P < 0.0001; Dunnet’s multiple comparison test to controls, 5 s: P < 0.01 for control versus Kv4.3LOF; 45 s: P < 0.05 for control versus BKCa1.1 LOF; second half: interaction effect: F72,1152 = 5.047, P < 0.0001; Dunnet’s multiple comparison test to controls, 5 s: P < 0.05 for control versus Kv4.3 LOF). [(B) and (C) Ncontrol = 13, NKv4.3LOF = 10, and NBKCa1.1LOF = 12]. (D) Average z score for putative dopamine neurons in the VTA during FR1 day 1 following LP (top) compared to average z score following LP on day 1 of extinction (FR1 day 1, Ncontrol = 17 cells, two mice; NKv4.3LOF = 39 cells, five mice; and NBKCa1.1LOF = 13 cells, five mice; first day of extinction (Ext D1), Ncontrol = 10 cells, three mice; NKv4.3LOF = 27 cells, five mice; and NBKCa1.1LOF = 23 cells, three mice) and average z score for dLight1.3b signals in the NAc during FR1 day 1 (top) and the first day of extinction (bottom) (Ncontrol = 6, NKv4.3LOF = 6, and NBKCa1.1LOF = 5 mice). Comparison of AUC between day 1 and day 5 for z score action potential firing and dLight1.3b recordings for (E) control (optetrode unpaired Student’s t test t25 = 1.96, P = 0.061; dLight1.3b paired Student’s t test t5 = 4.17, **P < 0.01), (F) Kv4.3 LOF (optetrode unpaired Student’s t test t65 = 1.83, P = 0.072; dLight1.3b paired Student’s t test t5 = 1.398, P = 0.22), and (G) BKCa1.1 LOF (optetrode unpaired Student’s t test t37 = 4.28, **P < 0.001 and dLight1.3b paired Student’s t test t4 = 3.34, *P < 0.05). Data are presented as means ± SEM (B) to (E) or box and whisker min-to-max graphs (E) to (G).

References

    1. Wise R. A., Dopamine, learning and motivation. Nat. Rev. Neurosci. 5, 483–494 (2004). - PubMed
    1. Schultz W., Multiple dopamine functions at different time courses. Annu. Rev. Neurosci. 30, 259–288 (2007). - PubMed
    1. Kim H. R., Malik A. N., Mikhael J. G., Bech P., Tsutsui-Kimura I., Sun F., Zhang Y., Li Y., Watabe-Uchida M., Gershman S. J., Uchida N., A unified framework for dopamine signals across timescales. Cell 183, 1600–1616.e25 (2020). - PMC - PubMed
    1. Howe M. W., Tierney P. L., Sandberg S. G., Phillips P. E. M., Graybiel A. M., Prolonged dopamine signalling in striatum signals proximity and value of distant rewards. Nature 500, 575–579 (2013). - PMC - PubMed
    1. Mohebi A., Pettibone J. R., Hamid A. A., Wong J.-M. T., Vinson L. T., Patriarchi T., Tian L., Kennedy R. T., Berke J. D., Dissociable dopamine dynamics for learning and motivation. Nature 570, 65–70 (2019). - PMC - PubMed