. 2023 Aug 11;13(1):13094.
doi: 10.1038/s41598-023-39004-w.

Variation in the stringency of COVID-19 public health measures on self-reported health, stress, and overall wellbeing in Canada

Affiliations

Variation in the stringency of COVID-19 public health measures on self-reported health, stress, and overall wellbeing in Canada

Emily Cameron-Blake et al. Sci Rep. .

Abstract

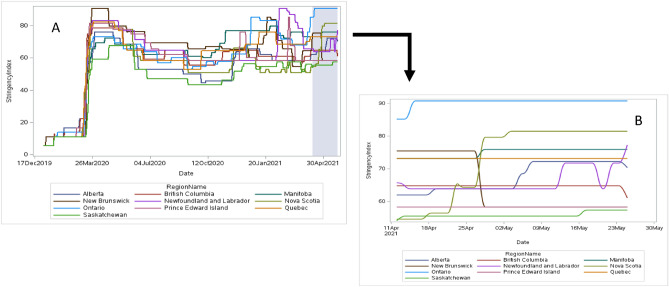
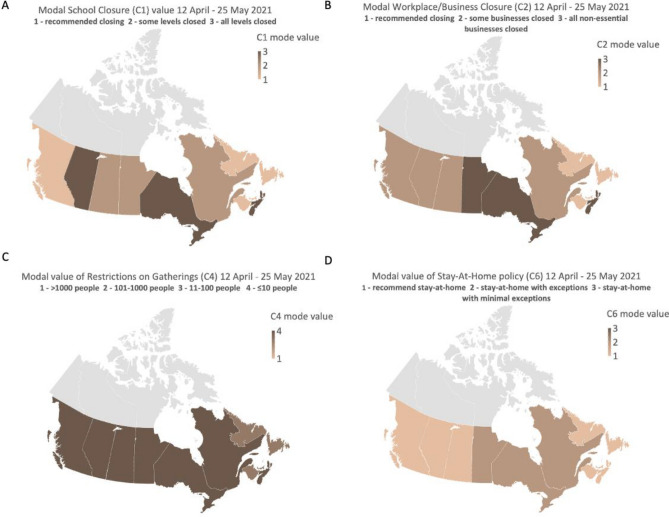
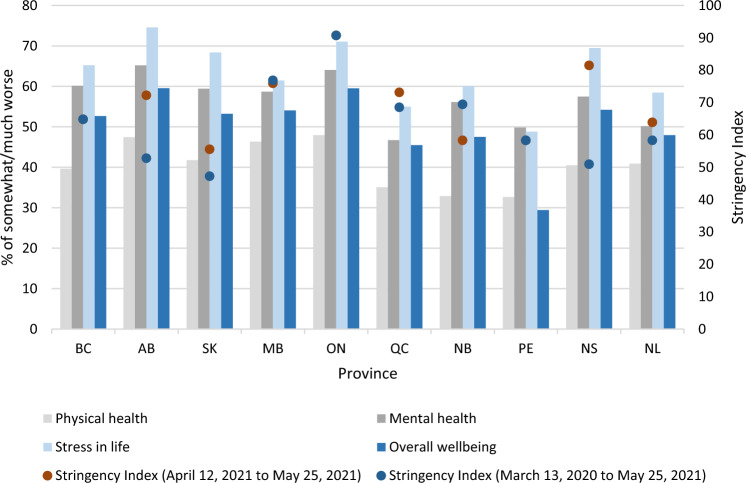
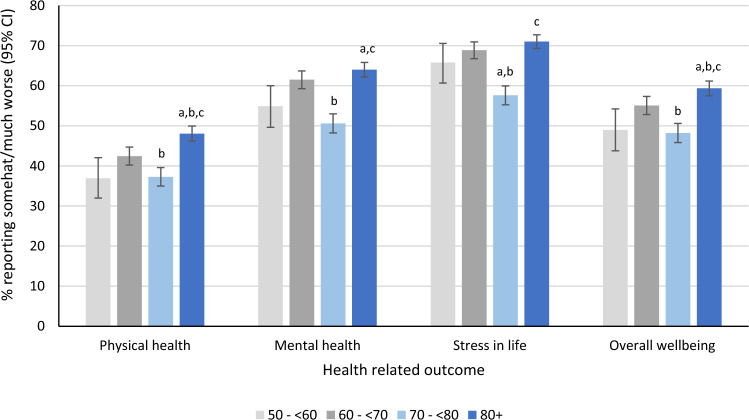
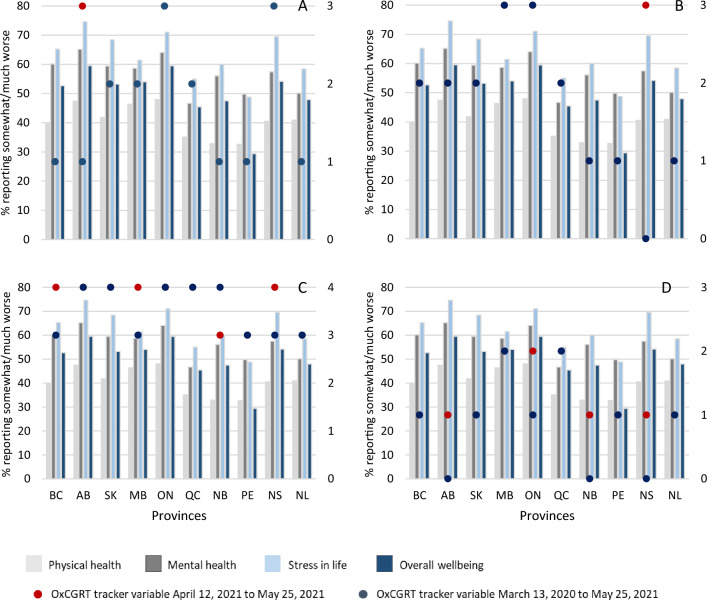
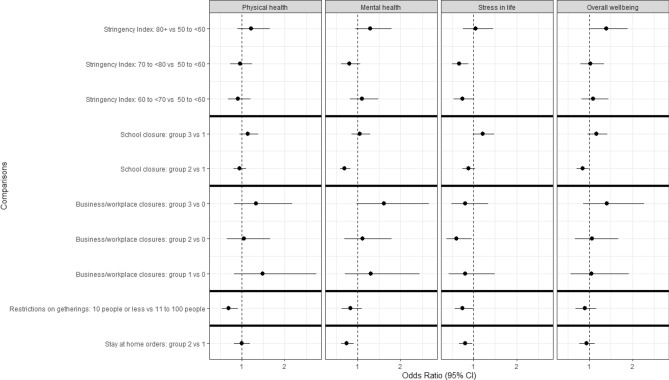
Evidence is building regarding the association between government implemented public health measures aimed at combating COVID-19 and their impacts on health. This study investigated the relationship between the stringency of public health measures implemented in Canada and self-reported mental health, physical health, stress, and wellbeing among a random sample of 6647 Canadians 18 years of age and older. The analysis was based on self-reported health data from the Canadian Perspectives on Environmental Noise Survey. This data was combined with the Oxford COVID-19 Government Response Tracker database, which included overall stringency index (SI), and four of its sub-components, i.e., school and business closures, restrictions on gatherings, and stay at home policies. Adjusted multivariate logistic regression models indicated that the magnitude of the overall SI was associated with higher or lower odds of reporting worse physical health, mental health, stress and/or overall wellbeing, depending on the measure evaluated. Similarly, policy directed at the four sub-components had varying impacts on the odds of reporting worse health, depending on the sub-component, the strength of the policy restriction, and the health outcome evaluated. The association between the strength of the public health measures and self-reported health, and how this may inform future policy, is discussed.


Conflict of interest statement

The authors declare no competing interests.

Figures

Figure 1
Figure 1
Stringency index by date in each province across Canada from January 1, 2020, to May 25, 2021 (Panel A) highlighting the survey period (April 12, 2021–May 25, 2021). Stringency index by date in each province across Canada during the survey period April 12, 2021–May 25, 2021 (Panel B).
Figure 2
Figure 2
A graphical representation of the variation in government-mandated public health measures across all Canadian provinces. The maps show the most frequently occurring (mode) restriction level for school closures (Panel A), workplace/business closures (Panel B), restrictions on gatherings (Panel C) and stay at home orders (Panel D) during the survey sampling period (April 12–May 25, 2021). The Territories of Canada were not included in CPENS due to low populations density. (Map created using OxCGRT data in Excel for Microsoft 365 v.16).
Figure 3
Figure 3
Reported impact of COVID-19 on health-related outcomes with stringency index. Bars represent the prevalence of people who reported “somewhat/much worse” in each of the COVID-19 health related outcomes. Where only one dot is visible, the two modal Stringency Index periods are the same or similar. BC—British Columbia, AB—Alberta, SK—Saskatchewan, MB—Manitoba, ON—Ontario, QC—Quebec, NB—New Brunswick, PE—Prince Edward Island, NS—Nova Scotia, NL—Newfoundland and Labrador.
Figure 4
Figure 4
Prevalence (and its 95% confidence interval) of reporting “somewhat/much worse” in the four-health related COVID-19 outcomes (physical health, mental health, stress in life and overall wellbeing) by stringency index group (results obtained from univariate logistic regression models). The overall Wald chi-square from logistic regression (χ2) was significant for all health-related outcomes (physical health χ32 = 56.31, p < 0.001; mental health χ32 = 83.78, p < 0.001; stress in life χ32 = 88.86, p < 0.001; overall wellbeing χ32 = 56.87, p < 0.001). Post hoc pairwise comparisons with Bonferroni adjustments are presented above with the following notations: asignificantly different (p < 0.05) compared to stringency index group 50 to < 60; bsignificantly different (p < 0.05) compared to stringency index group 60 to < 70; csignificantly different (p < 0.05) compared to stringency index group 70 to < 80.
Figure 5
Figure 5
Reported impact of COVID-19 on health-related outcomes with (Panel A): school closures, (Panel B): business/workplace closures, (Panel C): restrictions on gatherings and (Panel D): stay-at-home orders. Bars represent the prevalence of people who reported feeling “somewhat/much worse” in each of the COVID-19 health related outcomes. Where only one dot is visible, the restrictions of the two periods are the same or similar. Right axis corresponds to the ratings of the OxCGRT variables. BC—British Columbia, AB—Alberta, SK—Saskatchewan, MB—Manitoba, ON—Ontario, QC—Quebec, NB—New Brunswick, PE—Prince Edward Island, NS—Nova Scotia, NL—Newfoundland and Labrador.
Figure 6
Figure 6
Adjusted odds ratios (95% confidence intervals) of feeling “somewhat/much worse” in each of the health related COVID-19 outcome vs “unchanged/improved” from government-mandated restrictions. Separate models for each government-mandated restriction were adjusted for age, gender, Indigenous status, geographical location, income, work status, general physical and mental health, anxiety/depression, 7-day rolling average rate of deaths due to COVID-19 and cases per 100,000. Solid black line indicates a separate model. Confidence intervals of odds ratios that include the value 1 are not considered statistically different from the reference group. The Hosmer–Lemeshow goodness of fit test was satisfied for all models (p > 0.05) except for mental health and school closures (p < 0.02), mental health and stay at home orders (p < 0.01) and mental health and stringency index (p < 0.01). School closures: group 3—all levels of school closed; group 2—some levels of school closed; group 1—schools recommended to close. Business/workplace closures: group 3—all non-essential businesses/workplaces closed; group 2—some non-essential businesses/workplaces closed; group 1—recommend to close non-essential businesses/workplaces; group 0—no closures. Restrictions on gatherings: group 4—10 people or less permitted to meet; group 3—11 to 100 people permitted to meet. Stay-at-home orders: group 2—leaving home permitted for essential trips; group 1—recommend not leave home.

References

    1. Statistics Canada (2020). Canadians report lower self-perceived mental health during the COVID-19 pandemic. Available at: https://www150.statcan.gc.ca/n1/pub/45-28-0001/2020001/article/00003-eng... Accessed on 30 Nov 2021.
    1. Crowe S, et al. The effect of COVID-19 pandemic on the mental health of Canadian critical care nurses providing patient care during the early phase pandemic: A mixed method study. Intensive Crit. Care Nurs. 2021;63(102999):2021. doi: 10.1016/j.iccn.2020.102999. - DOI - PMC - PubMed
    1. Daly Z, et al. Associations between periods of COVID-19 quarantine and mental health in Canada. Psychiatry Res. 2021 doi: 10.1016/j.psychres.2020.113631. - DOI - PMC - PubMed
    1. Samji H, et al. Review: Mental health impacts of the COVID-19 pandemic on children and youth: A systematic review. Child Adolesc. Mental Health. 2022;27(2):173–189. doi: 10.1111/camh.12501. - DOI - PMC - PubMed
    1. Samji, H., et al. for the British Columbia Centre for Disease Control COVID-19 Young Adult Task Force. Impacts of the COVID-19 pandemic on the health and well-being of young adults in British Columbia. British Columbia Centre for Disease Control. Available at: http://www.bccdc.ca/Health-Professionals-Site/Documents/COVID-Impacts/BC... (2021).

Publication types