. 2023 Aug 11;7(1):74.
doi: 10.1038/s41698-023-00423-7.

Chimeric antibody targeting unique epitope on onco-mucin16 reduces tumor burden in pancreatic and lung malignancies

Affiliations

Chimeric antibody targeting unique epitope on onco-mucin16 reduces tumor burden in pancreatic and lung malignancies

Ashu Shah et al. NPJ Precis Oncol. .

Abstract

Aberrantly expressed onco-mucin 16 (MUC16) and its post-cleavage generated surface tethered carboxy-terminal (MUC16-Cter) domain are strongly associated with poor prognosis and lethality of pancreatic (PC) and non-small cell lung cancer (NSCLC). To date, most anti-MUC16 antibodies are directed towards the extracellular domain of MUC16 (CA125), which is usually cleaved and shed in the circulation hence obscuring antibody accessibility to the cancer cells. Herein, we establish the utility of targeting a post-cleavage generated, surface-tethered oncogenic MUC16 carboxy-terminal (MUC16-Cter) domain by using a novel chimeric antibody in human IgG1 format, ch5E6, whose epitope expression directly correlates with disease severity in both cancers. ch5E6 binds and interferes with MUC16-associated oncogenesis, suppresses the downstream signaling pFAK(Y397)/p-p70S6K(T389)/N-cadherin axis and exert antiproliferative effects in cancer cells, 3D organoids, and tumor xenografts of both PC and NSCLC. The robust clinical correlations observed between MUC16 and N-cadherin in patient tumors and metastatic samples imply ch5E6 potential in targeting a complex and significantly occurring phenomenon of epithelial to mesenchymal transition (EMT) associated with disease aggressiveness. Our study supports evaluating ch5E6 with standard-of-care drugs, to potentially augment treatment outcomes in malignancies inflicted with MUC16-associated poor prognosis.


Conflict of interest statement

S.K.B. is one of the co-founders of Sanguine Diagnostics and Therapeutics, Inc. A.K.G. has served as a consultant for AstraZeneca, Jazz Pharmaceuticals, Flagship Biosciences, G1 Therapeutics, Cardinal Health, Mirati Therapeutics, Beigene Ltd, Sanofi Genzyme and Regeneron Pharmaceuticals DSMB Chair for Y-mAbs Therapeutics outside the submitted work. The other authors declare no potential conflicts of interest.

Figures
Fig. 1
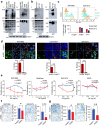
Fig. 1. Generation and characterization of chimeric mAb5E6 (ch5E6) binding in patient tumors.
a Graphical representation of mAb5E6 epitope on surface tethered carboxy-terminal (Cter) domain of MUC16. b Schematic representation of ch5E6 generation by grafting murine VH and VL regions on human IgG1 FcH and FcL harboring plasmids and co-transfecting in ExpiCHO cells. c ELISA for binding of chimeric mb5E6 to recombinant MUC16 C-ter protein (rMUC16-Cter) and its comparison to parent murine version mAb5E6.Y-axis, binding as absorbance measurement at 450 nm; X-axis, mAb concentrations; d Immunoblot analysis of ch5E6 with E.coli expressed, and MIA PaCa-2 cells transfected rMUC16-C ter protein lysates. e Real-time binding analysis of anti-MUC16 murine (m5E6) and chimeric mAb5E6 (ch5E6) to rMUC16-Cter protein using SPR (Surface Plasmon Resonance). Different concentrations of rMUC16-Cter from 0 nm to 1 µM were passed over the immobilized chimeric and murine mAb5E6 on sensor chip CMD200m. Ka and Kd values were obtained by the analysis of sensograms on scrubber 2.0 and were used to calculate KD values. Y-axis, amount of bound antibody as resonance units (RU); X-axis, time in seconds. f Immunoblot analysis of conditioned media (CM) prepared from MUC16 expressing PC SW1990, COLO357, and NSCLC H2122 cell lines for determining the binding of ch5E6 to shed from MUC16. Soluble MUC16-specific mAb M11 was used as the positive control, and MIA PaCa-2 cell line-derived CM was used as a negative control. The lysates (40 μg) prepared from these cells were loaded on 6% and probed with both M11 and ch5E6. g, h Immunohistochemical analysis of ch5E6 with MUC16 on tissue microarray (TMA) from patient tumors at various stages of PC (Stage IA; n = 3, IB; n = 32, IIA; n = 16, IIB; n = 14, III; n = 3) and NSCLC (Stage IA; n = 14, IB; n = 10, IIA; n = 6, IIB; n = 11, III; n = 6) and normal adjacent tissues (PC; n = 8, NSCLC; n = 30). Staining with mAb M11 was used to evaluate MUC16 expression in the tissues. A pathologist at UNMC scored the slides. A histoscore (H-score) was calculated by multiplying intensity and positivity. Representative images of ch5E6 binding to different disease stages are shown in parallel. Error bars in 1C indicate SD. Scale bars, 100 µm; *P < 0.05; **P < 0.01, ****P < 0.001. Fig. 1a was “created with Biorender.com”.
Fig. 2
Fig. 2. ch5E6 recognizes endogenous forms of MUC16 in PC and NSCLC cell lines and inhibits their proliferation and metastasis.
Immunoblot analysis of ch5E6 binding to MUC16 in a PC (SW1990, COLO357, T3M4, CD18 and MIA PaCa-2) and b NSCLC cell line lysates (SW1573, H2122, and A549). MUC16 high molecular weight forms (HMW) were detected on 2%SDS-Agarose (I and II upper panel), and low molecular weight (LMW) forms on 12% SDS-PAGE electrophoresis (I and II lower panel). The same cell line lysates were also probed with an M11 (anti-CA125) antibody specific to the tandem repeat portion of MUC16. β-actin was run as a loading control. c Flow cytometry analysis of SW1990 and SW1573 cells for determining the surface binding potential of ch5E6. M11 and huIgG1 were used as positive and negative controls, respectively. d Confocal microscopy for analyzing specific binding of ch5E6 on MUC16 expressing SW1990, COLO357 (PC), and SW1573 (NSCLC) cell lines as compared to isotype control mAb huIgG1. Nuclei were stained with DAPI (Blue), and antibody binding was detected with fluorophore Alexa488 (green). % Staining on each cell line was calculated by measuring fluorescence (A488) intensity in 5 fields and normalization with DAPI. Scale bars, 100 µm; magnified images, 10 µm. e Anti-proliferative potential of ch5E6 in MUC16 expressing PC (SW1990, COLO357) and NSCLC (SW1573, H2122) cell lines. MUC16 negative line MIA PaCa-2 and A549 were used as a control in the experiment. The antibodies ch5E6 and huIgG1 were added at different concentrations from 0–25 μg/ml for 48 h. Real-time MT glo reagent (Promega) was used to detect the proliferation index. The data for COLO357 and H2122 is shown in Supplementary Fig. 2. The luminescence measurements were transformed to % proliferation. f inivasion and g migration of PC (SW1990) and NSCLC (SW1573) cells at 10 μg/ml were checked in Trans well insert assay with and without Matrigel coating, respectively. Cell numbers used are 1 × 106/ml in a 6-well trans well insert and 0.25 × 106/ml in a 24-well insert for invasion and migration assay, respectively. Experiments were performed in triplicates, and 10–20 images for each well were captured and counted. Error bars indicate SEM. *P < 0.05; **P < 0.01.
Fig. 3
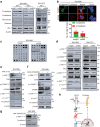
Fig. 3. Abrogation of MUC16/pFAK/p70S6K signaling by ch5E6 decreases N-cadherin mediated EMT in PC and NSCLC cell lines.
a Immunoblot analysis of ch5E6 and huIgG1 treated SW1990 and SW1573 cells for different mesenchymal markers including, N-cadherin, Vimentin, Fibronectin, ZO-1, and epithelial marker E-cadherin. The cell lysates were collected after 24–48 h of treatment. β- actin was used as a loading control. b Immunofluorescence analysis of ch5E6 treated SW1990 cells showing N-cadherin (green) and E-cadherin (red) expression. The percentage of cells with corresponding quantifications of ch5E6 treated PC line SW1990 for E-cadherin and N-cadherin expression. The cells were localized with DAPI-stained nuclei. Scale bar, 5 µm. The fluorescence intensities were calculated by using Zen analysis software, plotted on GraphPad prism, and are shown in Supplementary Fig. 4a. c Immunoblotting of ch5E6 and huIgG1 treated SW1990 cell lysates on receptor tyrosine kinase array for identifying downstream molecules. 48 h post-treatment, the collected lysates were probed on kinase arrays and developed using HRP conjugate (included in the kit). d Immunoblot analysis shows reduced pFAK (Y397) expression upon ch5E6 treatment in SW1990 and SW1573 cells. Furthermore, the molecules identified through the kinase array, including p70S6K (T389), pAkt (S473), pERK (Y202/204), pJNK(T183/185) and p-c-jun(S73), were validated in these lysates as shown by decreased phosphorylated forms than huIgG1 treated lysates. Immunoblot analysis of (e) Y15 (FAK inhibitor) and f PD98059 (ERK inhibitor) treated SW1990 lysates showed a significant decrease in phosphorylated FAK and ERK levels, respectively, with a concomitant reduction in N-cadherin expression. In addition, both inhibitors reduced p70S6K, pJNK and p-c-jun phosphorylated protein levels, thus validating the downstream signaling molecules identified through the kinase array. g Immunoblot analysis of SP600125 (JNK inhibitor) treated SW1990 lysate showing a decrease in pJNK and N-cadherin expression. β- actin was used as a loading control. h Schematic diagram showing the impact of ch5E6 treatment on downstream signaling associated with MUC16-mediated EMT.
Fig. 4
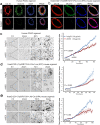
Fig. 4. ch5E6 treatment leads to a substantial decrease in the growth of organoids derived from PC patients or pancreatic and lung cancer genetically engineered mouse models.
a PC patient and b KPC mouse organoid staining with ch5E6 indicating MUC16 expression (green) and specific binding of mAb compared to no binding with isotype control mAb huIgG1. The binding of ch5E6 to the ductal cells (yellow) was illustrated by colocalization with CK-19 (red) staining in human and mouse pancreatic tumor organoids. Scale bar 10 µm.The representative images for ch5E6 treated. c Human PC patient. d KPC and (e) KPA mouse-derived organoids obtained by real-time kinetics using Incucyte live cell imaging system. The data were quantitated for organoid counts using essence incucyte software, plotted as a graph of change in organoid counts or area over time (3–5 days) for both ch5E6 and huIgG1 treatments, and is shown in parallel. Error bars indicate SEM. *P < 0.05; **P < 0.01.
Fig. 5
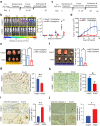
Fig. 5. ch5E6 induces potent anti-tumor activity in pancreatic and lung tumor-bearing mice.
a Experimental schema and treatment strategy for testing the efficacy of ch5E6 in orthotopic xenografts developed from luciferase labeled SW1990 PC cells. The antibody regimens ch5E6 and huIgG1 were administered i.v. following twice weekly schedule at 10 mg/kg doses for 40 days. b Representation of IVIS imaging for measuring the bioluminescence (BLI) over various time points during the experiment. The graph shows a change in tumor volumes measured as total photon flux in ch5E6 treated animal groups (red dots) compared to respective isotype control mAb huIgG1 (blue dots). c Strategic plan for testing the efficacy of ch5E6 in subcutaneous xenografts developed from SW1573 NSCLC cells. The doses and schedules were similar as followed in PC model. d The line graph shows a change in tumor volume in the ch5E6 treated group than huIgG1 treatment. Length, width, and height were measured every 3rd day throughout the treatment schedule. The formula for measuring tumor volume = (length × height × width) *0.5). The pictorial and quantitative representation of orthotopic PC (e) and subcutaneous NSCLC tumors (f) excised at the end of the study. Immunohistochemical analysis and quantitative data showing the changes in proliferation index as ki67 staining in PC (g) and NSCLC (h) tumors. Apoptosis as cleaved caspase 3 expression in SW1990 (i) and SW1573 (j) tumors treated with ch5E6 compared to huIgG1 control group. ImageJ was used to count the stained cells. (n = 3–5 fields/tissue; three animals). Error bars indicate SEM. Scale bar, 400 μm; magnified images, 100 μm; *P < 0.05; **P < 0.01.
Fig. 6
Fig. 6. Inhibition of EMT by ch5E6 is validated in PC and NSCLC cell line-derived xenografts.
a Immunofluorescence analysis showing a decrease in pFAK(Y397) and N-cadherin expression in xenograft tumors of SW1990 cells treated with ch5E6 compared to isotype control mAb huIgG1 group (n = 6–8 fields/tissue: three animals). The data was plotted for changes in fluorescence intensity using GraphPad Prism 9 and is shown in parallel. Nuclei were stained with DAPI. b Immunofluorescence analysis of ch5E6 treated SW1573 cell line-derived xenografts showing a reduction in pFAK(Y397) and N-cadherin levels compared to isotype control mAb huIgG1 group (n = 6–8 fields/tissue: 3 animals). Scale bar, 10 µm; magnified images, 2 µm. No significant changes in the intensity of MUC16 were seen in the ch5E6 treated versus isotype control tumors derived from both cancers. c, d Immunoblot analysis of ch5E6 treated PDAC and NSCLC tumor lysates showing a substantial decrease in phosphorylated levels of FAK(Y397), p70S6K(T389) and N-cadherin as compared to huIgG1 treatment. Error bars indicate SEM. Scale bar, 400 μm; magnified images, 100 μm; *P < 0.05; **P < 0.01.
Fig. 7
Fig. 7. MUC16 and N-cadherin are clinically correlated in patient tumors.
a, b Representative images and quantitative illustration of immunohistochemical analyses demonstrate a strong positive correlation between MUC16 and N-cadherin (R = 0.84) in both primary PC tumors (n = 10) and liver metastasis (R = 0.99) samples (n = 8). Scale bar, 400 µm; magnified images, 100 µm. *P < 0.05; **P < 0.01. c Representative images of immunofluorescence analysis showing coexpression of MUC16 (green) and N-cadherin (red) in primary PDAC tumors compared to no MUC16 and N-cadherin in normal pancreatic sections. Scale bar, 20 µm; magnified images, 5 µm. d Schematic diagram representing ch5E6 induced downregulation of MUC16 mediated EMT resulting in its anti-tumor potential in PC and NSCLC. Overall, anti-MUC16 chimeric mAb5E6 (ch5E6) binds to the cell surface-tethered domain of MUC16, interferes with oncogenic pFAK/p70S6K/N-cadherin signaling associated with MUC16-mediated EMT, and reduces tumor burden in both PC and NSCLC models.

Similar articles

Cited by

References

    1. Rahib L, Wehner MR, Matrisian LM, Nead KT. Estimated projection of us cancer incidence and death to 2040. JAMA Netw. Open. 2021;4:e214708–e214708. - PMC - PubMed
    1. Singh RR, O'Reilly EM. New treatment strategies for metastatic pancreatic ductal adenocarcinoma. Drugs. 2020;80:647–669. - PMC - PubMed
    1. Zappa C, Mousa SA. Non-small cell lung cancer: current treatment and future advances. Transl. Lung Cancer Res. 2016;5:288–300. - PMC - PubMed
    1. Anagnostou V, et al. Evolution of neoantigen landscape during immune checkpoint blockade in non-small cell lung cancer. Cancer Discov. 2017;7:264–276. - PMC - PubMed
    1. Mullard A. FDA approves 100th monoclonal antibody product. Nat. Rev. Drug Discov. 2021;20:491–495. - PubMed