. 2023 Aug 11;13(1):13075.
doi: 10.1038/s41598-023-40402-3.

Optogenetic targeting of astrocytes restores slow brain rhythm function and slows Alzheimer's disease pathology

Affiliations

Optogenetic targeting of astrocytes restores slow brain rhythm function and slows Alzheimer's disease pathology

Yee Fun Lee et al. Sci Rep. .

Abstract

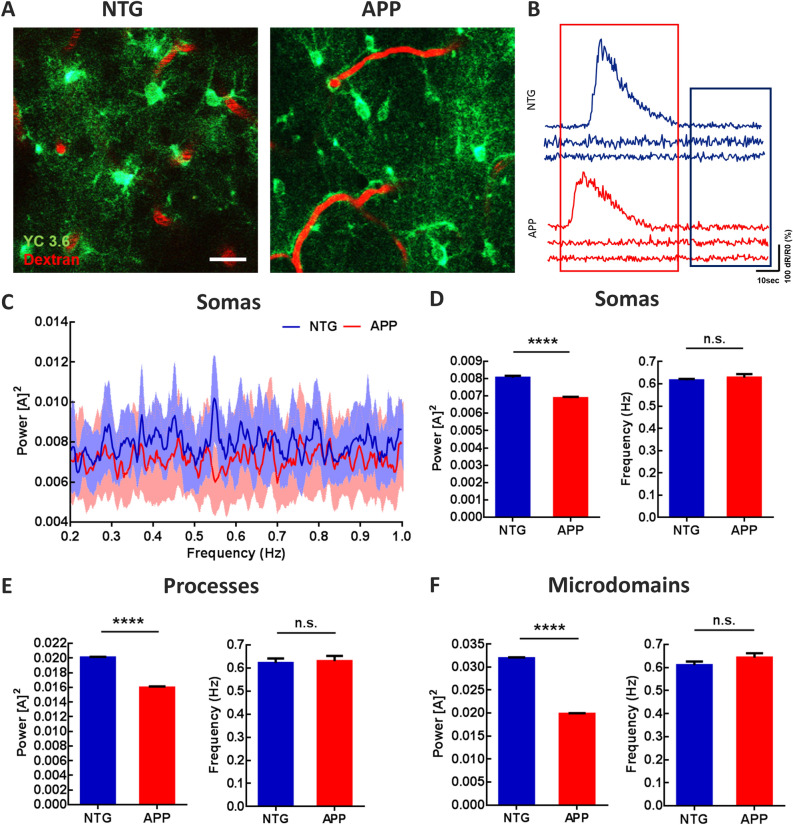
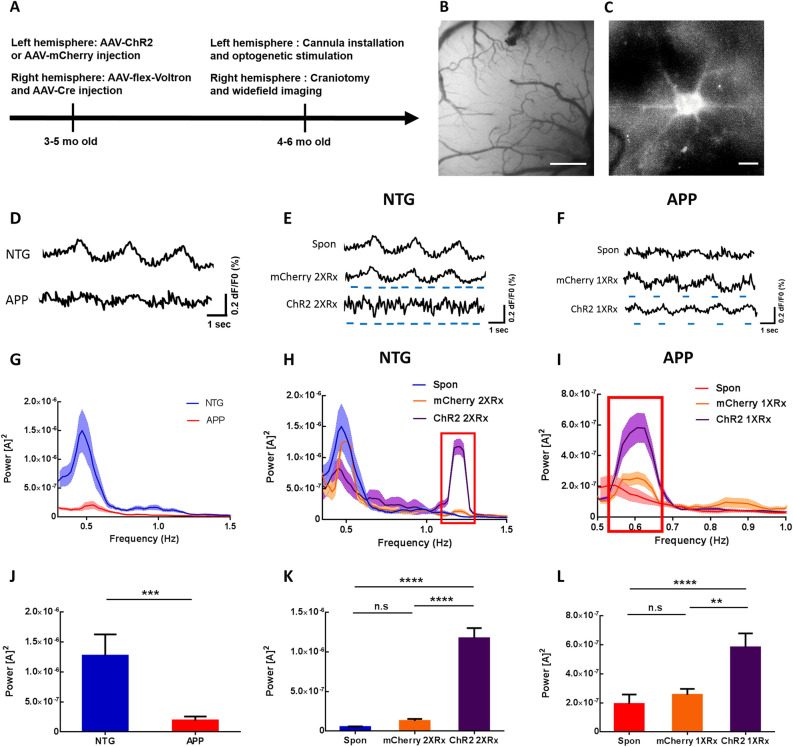
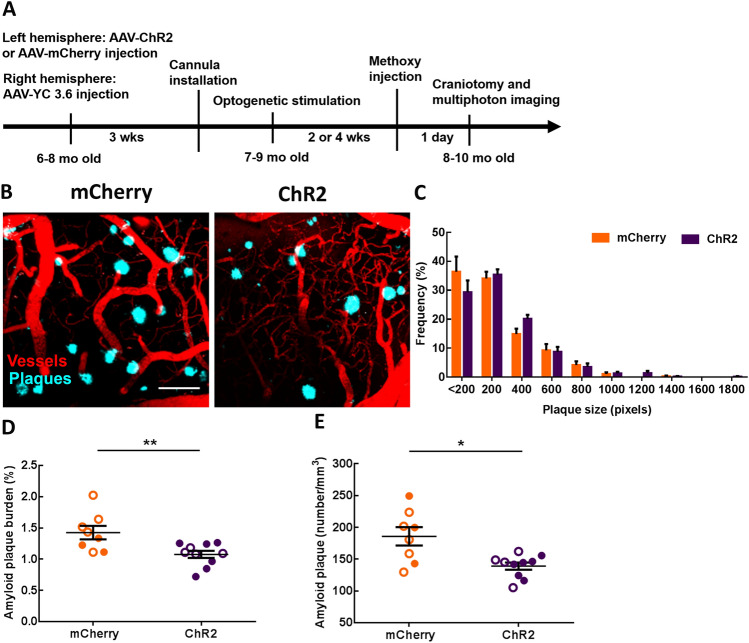
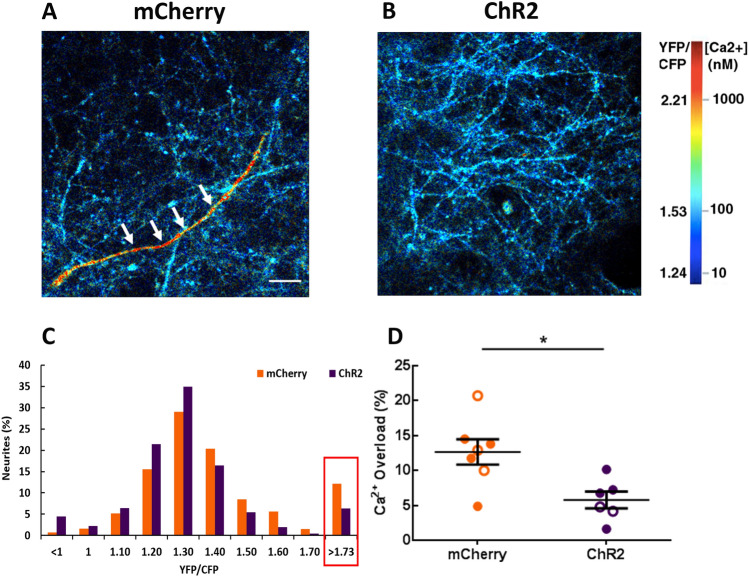
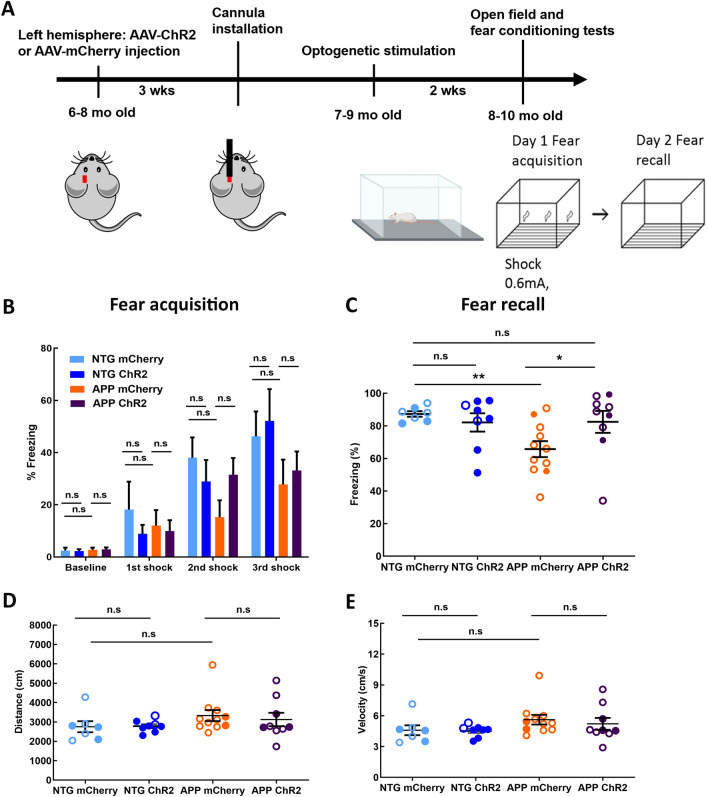
Patients with Alzheimer's disease (AD) exhibit non-rapid eye movement (NREM) sleep disturbances in addition to memory deficits. Disruption of NREM slow waves occurs early in the disease progression and is recapitulated in transgenic mouse models of beta-amyloidosis. However, the mechanisms underlying slow-wave disruptions remain unknown. Because astrocytes contribute to slow-wave activity, we used multiphoton microscopy and optogenetics to investigate whether they contribute to slow-wave disruptions in APP/PS1 mice. The power but not the frequency of astrocytic calcium transients was reduced in APP/PS1 mice compared to nontransgenic controls. Optogenetic activation of astrocytes at the endogenous frequency of slow waves restored slow-wave power, reduced amyloid deposition, prevented neuronal calcium elevations, and improved memory performance. Our findings revealed malfunction of the astrocytic network driving slow-wave disruptions. Thus, targeting astrocytes to restore circuit activity underlying sleep and memory disruptions in AD could ameliorate disease progression.


Conflict of interest statement

The authors declare no competing interests.

Figures

Figure 1
Figure 1
Astrocytic calcium transients are impaired at the slow-wave frequency in young APP mice. (A) Multiphoton microscopy image of YC3.6-expressing astrocytes in 4–6 months old NTG and APP mice. YC3.6 was expressed in the somas, processes, and endfeet of astrocytes (green), while dextran red filled the vasculature (red). (B) Representative ΔR/R0 traces of individual astrocytic calcium transients in NTG and APP mice. (C) Power spectral densities of calcium transients within astrocytic somas. Bright blue and red traces are averages, faint blue and red bands are SEM. (D) The mean power and frequency of somal calcium transients in NTG and APP mice. (E) The mean power and frequency of calcium transients within astrocytic processes in NTG and APP mice. (F) The mean power and frequency of calcium transients within astrocytic microdomains in NTG and in APP mice. Values are mean ± SEM, scale bar, 10 μm. ****p < 0.0001.
Figure 2
Figure 2
Optogenetic targeting of astrocytes allows manipulation of slow oscillations. (A) Experimental design. (B) Low resolution wide-field image of Voltron fluorescence. Scale bar, 500 μm. (C) High resolution wide-field image of a neuron expressing Voltron. Scale bar, 10 μm. (D) Representative traces of voltage sensor signal in NTG and APP mice. (E) Representative traces of voltage sensor signal acquired spontaneously (Spon), during light activation of mCherry lacking ChR2 at 1.2 Hz (mCherry 2XRx), or during optogenetic activation of ChR2 at 1.2 Hz (ChR2 2XRx) in NTG mice. Light pulse stimulations are shown in blue. (F) Representative traces of voltage sensor signal acquired spontaneously (Spon), during light activation of mCherry lacking ChR2 at 0.6 Hz (mCherry 1XRx), or during optogenetic activation of ChR2 at 0.6 Hz (ChR2 1XRx) in APP mice. Light pulse stimulations are shown in blue. (GI) Power spectral density plots of slow oscillations in NTG (H) and APP (I) mice across conditions. Mean ± SEM. (J) Bar graph comparing the average power of slow oscillations in NTG and APP mice. (K) Bar graph comparing the average power of slow oscillations in NTG mice across conditions. (L) Bar graph comparing the average power of slow oscillations in APP mice across conditions. **p < 0.01, ***p < 0.001, ****p < 0.0001.
Figure 3
Figure 3
Slow-wave rescue decreases amyloid plaque deposition in APP mice. (A) Experimental design. (B) Representative multiphoton images of methoxy-X04 positive amyloid plaques after light activation of cortical astrocytes in mCherry and ChR2 groups. Plaques are shown in blue. Dextran red filled blood vessels are in red. (C) The frequency distribution of amyloid plaque size in mCherry and ChR2 groups. (D) Amyloid plaque burden across conditions. (E) Amyloid plaque number across conditions. Values are presented as mean ± SEM. Males are represented by closed circles, and females by open circles. Scale bar, 100 μm, *p < 0.05, **p < 0.01.
Figure 4
Figure 4
Optogenetic rescue normalizes neuronal calcium in APP mice. (A, B) The images pseudocolored according to the intraneuronal calcium concentration, acquired from APP mice expressing mCherry (A) or ChR2 (B). A neuronal process exhibiting calcium overload is seen in red (white arrows). (C) Histogram showing the distribution of YFP/CFP ratios in neurites expressing YC 3.6. Neuronal calcium overload was defined as a YFP/CFP ratio larger than 2 standard deviations above the average YFP/CFP ratio in the neurons of NTG mice. The ratio of YFP/CFP > 1.73 was considered as calcium overload. (D) The percentage of neurites exhibiting calcium overload after 2–4 week light activation of astrocytes. Values are mean ± SEM. Males are represented by closed circles and females by open circles. Scale bar, 100 μm, *p < 0.05.
Figure 5
Figure 5
Optogenetic activation of astrocytes at the slow-wave frequency improves sleep-dependent memory performance in APP mice. (A) Experimental design. (B) Percentage of time spent freezing before and during fear conditioning. (C) Percentage of time spent freezing during fear recall. Sleep-dependent memory performance was assessed across groups. (D) The total distance traveled during open field test across conditions. (E) The average velocity of movement during open field test across conditions. Values are mean ± SEM. Males are represented by closed circles, and females by open circles. n.s non-significant, *p < 0.05, **p < 0.01.

Update of

References

    1. Jahn H. Memory loss in Alzheimer’s disease. Dialogues Clin. Neurosci. 2013;15:445–454. - PMC - PubMed
    1. Bloom GS. Amyloid-β and tau: The trigger and bullet in Alzheimer disease pathogenesis. JAMA Neurol. 2014;71:505–508. - PubMed
    1. Calderon-Garcidueñas AL, Duyckaerts C. Chapter 23 - Alzheimer disease. In: Kovacs GG, Alafuzoff I, editors. Handbook of Clinical Neurology. Elsevier; 2018. pp. 325–337. - PubMed
    1. DeTure MA, Dickson DW. The neuropathological diagnosis of Alzheimer’s disease. Mol. Neurodegener. 2019;14:32. - PMC - PubMed
    1. Guo C, et al. tau activates transposable elements in Alzheimer’s disease. Cell Rep. 2018;23:2874–2880. - PMC - PubMed

Publication types