. 2023 Oct;30(10):2351-2363.
doi: 10.1038/s41418-023-01205-1. Epub 2023 Aug 11.

FBXL4 mutations cause excessive mitophagy via BNIP3/BNIP3L accumulation leading to mitochondrial DNA depletion syndrome

Affiliations

FBXL4 mutations cause excessive mitophagy via BNIP3/BNIP3L accumulation leading to mitochondrial DNA depletion syndrome

Yingji Chen et al. Cell Death Differ. 2023 Oct.

Abstract

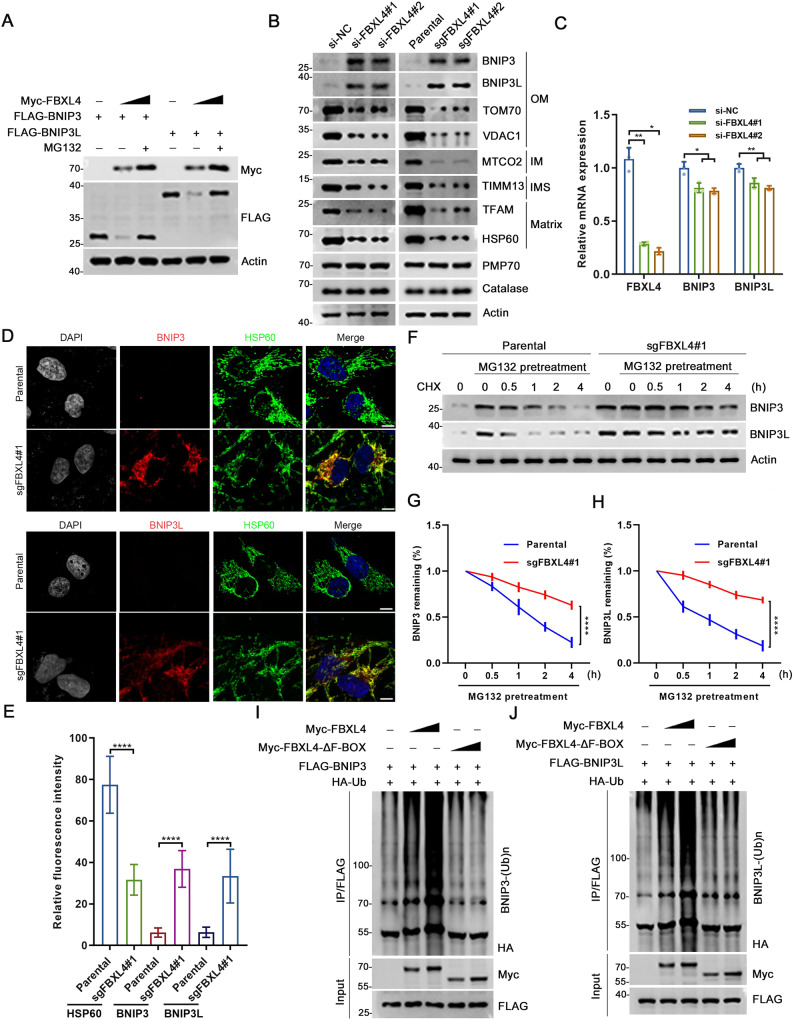
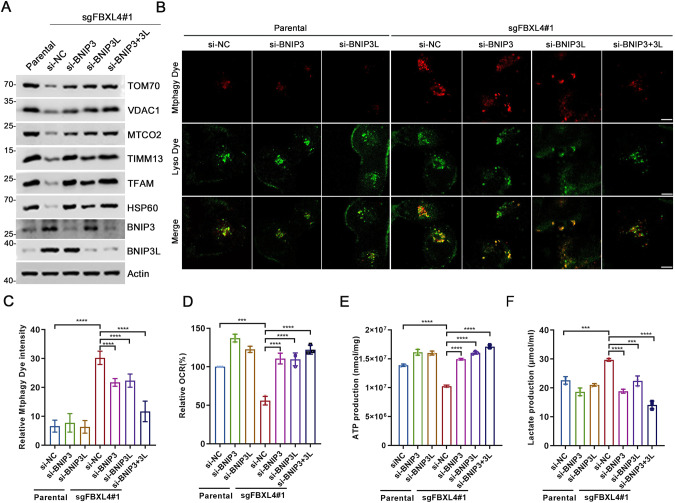
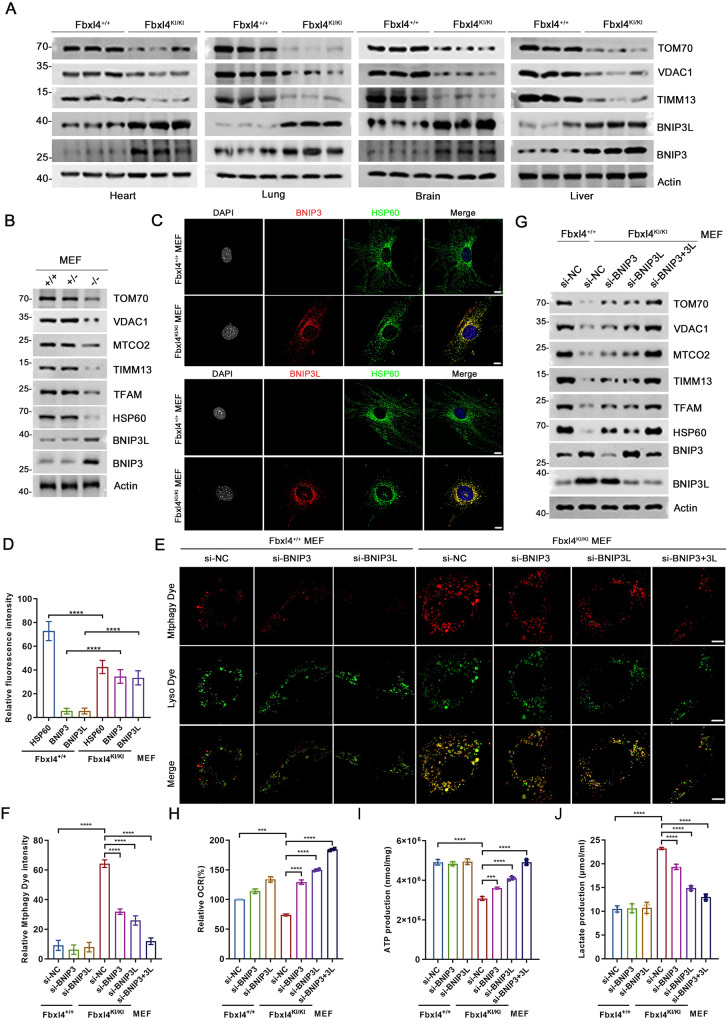
Mitochondria are essential organelles found in eukaryotic cells that play a crucial role in ATP production through oxidative phosphorylation (OXPHOS). Mitochondrial DNA depletion syndrome (MTDPS) is a group of genetic disorders characterized by the reduction of mtDNA copy number, leading to deficiencies in OXPHOS and mitochondrial functions. Mutations in FBXL4, a substrate-binding adaptor of Cullin 1-RING ubiquitin ligase complex (CRL1), are associated with MTDPS, type 13 (MTDPS13). Here, we demonstrate that, FBXL4 directly interacts with the mitophagy cargo receptors BNIP3 and BNIP3L, promoting their degradation through the ubiquitin-proteasome pathway via the assembly of an active CRL1FBXL4 complex. However, MTDPS13-associated FBXL4 mutations impair the assembly of an active CRL1FBXL4 complex. This results in a notable accumulation of BNIP3/3L proteins and robust mitophagy even at basal levels. Excessive mitophagy was observed in Knockin (KI) mice carrying a patient-derived FBXL4 mutation and cortical neurons (CNs)-induced from MTDPS13 patient human induced pluripotent stem cells (hiPSCs). In summary, our findings suggest that abnormal activation of BNIP3/BNIP3L-dependent mitophagy impairs mitochondrial homeostasis and underlies FBXL4-mutated MTDPS13.


Conflict of interest statement

The authors declare no competing interests.

Figures

Fig. 1
Fig. 1. Identification of BNIP3 and BNIP3L proteins as FBXL4 interacting proteins.
A Tandem affinity purification of FBXL4-containing protein complexes was conducted from 293 T cells stably overexpressing FLAG-FBXL4. The number of total/unique peptides identified by mass spectrometry analysis are shown in the Table. B, C 293 T cells were transfected with the indicated plasmids. The whole cell lysates (WCL) were prepared and subjected to co-IP with anti-FLAG antibody. The immunoprecipitates were analyzed by WB with the indicated antibodies. D Recombinant expressed GST-FBXL4 protein or GST bound to glutathione-Sepharose beads and incubated with recombinant expressed His-BNIP3 or BNIP3L proteins. Bound His-BNIP3 or BNIP3L proteins were detected by WB with anti-His antibody. E Schematic representation of FBXL4 deletion mutants. F 293 T cells were transfected with the indicated plasmids. The WCL were prepared and subjected to co-IP with anti-FLAG antibody. The immunoprecipitates were analyzed by WB with the indicated antibodies.
Fig. 2
Fig. 2. FBXL4 mediates ubiquitination and degradation of BNIP3 and BNIP3L.
A 293 T cells were transfected with FLAG-BNIP3, FLAG-BNIP3L and increasing amount of Myc-FBXL4. The WCL were prepared for WB with the indicated antibodies. B WCL from HeLa cells transfected with FBXL4-specific siRNA or negative control (siNC) were prepared for WB with the indicated antibodies. FBXL4 KO cell lines were generated through LentiCRISPRv2 methods. The WCL from parental and FBXL4 KO HeLa cells were prepared for WB with the indicated antibodies. C RT-qPCR measurement of FBXL4, BNIP3 and BNIP3L mRNA expression in HeLa cells transfected with FBXL4-specific siRNA or siNC, Data are shown as means ± SD (n = 3). P values are calculated by the Two-way ANOVA test. *p < 0.05, **p < 0.01. D, E Representative IF images from parental and FBXL4 KO HeLa cells, stained with BNIP3 (or BNIP3L), HSP60 and DAPI. Scale bar, 10 μm. The relative intensity of HSP60, BNIP3 (or BNIP3L) and BNIP3L were quantified and shown in E. Data were shown as means ± SD (n = 50). P values are calculated by the Two-way ANOVA test. ****p < 0.0001. FH WB analysis of the indicated proteins in the WCL of parental and FBXL4 KO HeLa cells pretreated with DMSO or MG132 (20 µM) for 5 h and then treated with cycloheximide (CHX, 50 μg/ml) and harvested at different time points. At each time point, the intensity of BNIP3 (G) and BNIP3L (H) was normalized to the intensity of Actin and then to the value at 0 h. P values are calculated by the Two-way ANOVA test. ****p < 0.0001. I, J WB analysis of the indicated proteins in vivo ubiquitination assays performed products and WCL from 293 T cells transfected with the indicated plasmids.
Fig. 3
Fig. 3. MTDPS13 patient-associated FBXL4 mutants are defective in promoting ubiquitination and degradation of BNIP3/BNIP3L.
A Schematic representation of six MTDPS13-associated FBXL4 mutations. B WB analysis of the indicated proteins in WCL from 293 T cells transfected with the indicated plasmids and treated with DMSO or MG132 (20 μM) for 5 h. C Quantification of the intensity of the indicated protein in B. (n = 3). The intensity of each band was normalized to the intensity of Actin, and One-way ANOVA test in A. *p < 0.05, **p < 0.01, ***p < 0.001, ****p < 0.0001. D 293 T cells were transfected with the indicated plasmids. The WCL were prepared and subjected to co-IP with anti-FLAG antibody. The immunoprecipitates were analyzed by WB with the indicated antibodies. E, F WB analysis of the indicated proteins in vivo ubiquitination assays performed products and WCL from 293 T cells transfected with the indicated plasmids. G WB analysis of the indicated proteins in WCL from parental and FBXL4 KO H1299 cells stably overexpressing EV, FLAG-FBXL4-WT, -I205T or –S410P mutant.
Fig. 4
Fig. 4. FBXL4 deficiency activates mitophagy in a BNIP3/BNIP3L-dependent manner.
A WB analysis of the indicated proteins in the WCL from parental or FBXL4 KO HeLa cells transfected with indicated siRNAs. B, C Representative IF images from parental and FBXL4 KO HeLa cells transfected with indicated siRNAs, stained with Mtphagy Dye and Lyso Dye. Scale bar, 10 μm. The relative intensity of Mtphagy Dye was quantified and shown in C. Data were shown as means ± SD. (n = 50). D The OCR of parental and FBXL4 KO HeLa cells transfected with the indicated siRNA or siNC were measured using OCR assay Kit. Data are shown as means ± SD (n = 3). E The intracellular ATP production of parental and FBXL4 KO HeLa cells transfected with indicated siRNAs were measured using ATP production assay Kit. Data are shown as means ± SD (n = 3). F The intracellular lactate levels of parental and FBXL4 KO HeLa cells transfected with indicated siRNAs were measured using Lactate Assay Kit. Data are shown as means ± SD (n = 3). P values are calculated by the One-way ANOVA test and the Two-way ANOVA test in CF. ***p < 0.001, ****p < 0.0001.
Fig. 5
Fig. 5. BNIP3/BNIP3L-dependent mitophagy was abnormally activated in Fbxl4 mutation KI mouse model.
A WB analysis of the indicated proteins in WCL from the indicated tissues of Fbxl4+/+ and Fbxl4KI/KI mice. B WB analysis of the indicated proteins in WCL from Fbxl4+/+, Fbxl4+/KI and Fbxl4KI/KI MEFs. C, D Representative IF images from Fbxl4+/+and Fbxl4KI/KI MEFs, stained with BNIP3 (or BNIP3L), HSP60 and DAPI. Scale bar, 10 μm. The relative intensity of HSP60, BNIP3 (or BNIP3L) and BNIP3L were quantified and shown in D. Data were shown as means ± SD (n = 50). P values are calculated by the Two-way ANOVA test. ****p < 0.0001. E, F Representative IF images from Fbxl4+/+and Fbxl4KI/KI MEFs transfected with the indicated siRNAs, stained with Mtphagy Dye and Lyso Dye. Scale bar, 10 μm. The relative intensity of Mtphagy Dye was quantified and shown in D. Data were shown as means ± SD (n = 50). G WB analysis of the indicated proteins in WCL from Fbxl4+/+and Fbxl4KI/KI MEFs transfected with the indicated siRNAs. H The OCR of Fbxl4+/+ and Fbxl4KI/KI MEFs transfected with indicated siRNAs were measured using OCR assay Kit. Data are shown as means ± SD (n = 3). I The intracellular ATP production of Fbxl4+/+ and Fbxl4KI/KI MEFs transfected with the indicated siRNA or siNC were measured using ATP production assay Kit. Data are shown as means ± SD (n = 3). J The intracellular lactate levels of Fbxl4+/+ and Fbxl4KI/KI MEFs transfected with the indicated siRNAs were measured using Lactate Assay Kit. Data are shown as means ± SD (n = 3). P values are calculated by the One-way ANOVA test and the Two-way ANOVA test in FJ. ***p < 0.001, ****p < 0.0001.
Fig. 6
Fig. 6. Mitophagy is abnormally activated in CNs induced from MTDPS13 patient hiPSCs.
A WB analysis of the indicated proteins in PSC (H9 ESC and FBXL4MUT iPSC) and CNs derived from H9 ESC and FBXL4MUT iPSC (on Day 30). PSC: Pluripotent stem cells; ESC: Embryonic stem cells; iPSC: Induced pluripotent stem cells; CNs: cortical neurons. Representative images (B) of DCX, HSP60, BNIP3 and BNIP3L antibody immunostaining in 500 µM DFP treated H9/FBXL4MUT CNs (right) with untreated H9/FBXL4MUT CNs (left). Scar bar, 5 µm. Comparing the HSP60, BNIP3 (or BNIP3L) immunostaining intensity of DCX positive cells (C). Data were shown as means ± SD (n = 50). P values are calculated by the Two-way ANOVA test. **P < 0.005; ****P < 0.0001. Representative live cell imaging (D) of 500 µM DFP treated H9/FBXL4MUT CNs with untreated H9/FBXL4MUT CNs, stained with Mtphagy Dye and Lyso Dye, and quantitative analysis (E) of mitophagy levels. Scar bar, 10 µm. Data were shown as means ± SD (n = 50). P values are calculated by the Two-way ANOVA test. ****P < 0.0001. F WB analysis of the indicated proteins in DFP (500 µM)-treated H9/FBXL4MUT CNs with untreated H9/FBXL4MUT CNs (left) on Day 30.
Fig. 7
Fig. 7. A working model proposed in this study.
A schematic diagram is illustrated to depict a model in which FBXL4 mutations lead to the overactivation of BNIP3/BNIP3L-dependent mitophagy in MTDPS13 patients.

Similar articles

Cited by

References

    1. Nunnari J, Suomalainen A. Mitochondria: in sickness and in health. Cell. 2012;148:1145–59. doi: 10.1016/j.cell.2012.02.035. - DOI - PMC - PubMed
    1. Montava-Garriga L, Ganley IG. Outstanding Questions in Mitophagy: What We Do and Do Not Know. J Mol Biol. 2020;432:206–30. doi: 10.1016/j.jmb.2019.06.032. - DOI - PubMed
    1. Palikaras K, Lionaki E, Tavernarakis N. Mechanisms of mitophagy in cellular homeostasis, physiology and pathology. Nat Cell Biol. 2018;20:1013–22. doi: 10.1038/s41556-018-0176-2. - DOI - PubMed
    1. Misgeld T, Schwarz TL. Mitostasis in Neurons: Maintaining Mitochondria in an Extended Cellular Architecture. Neuron. 2017;96:651–66. doi: 10.1016/j.neuron.2017.09.055. - DOI - PMC - PubMed
    1. Newman LE, Shadel GS. Pink1/Parkin link inflammation, mitochondrial stress, and neurodegeneration. J Cell Biol. 2018;217:3327–9. doi: 10.1083/jcb.201808118. - DOI - PMC - PubMed

MeSH terms

LinkOut - more resources