. 2023 Oct;129(7):1071-1082.
doi: 10.1038/s41416-023-02390-z. Epub 2023 Aug 11.

Combined blockade of mTOR and p21-activated kinases pathways prevents tumour growth in KRAS-mutated colorectal cancer

Affiliations

Combined blockade of mTOR and p21-activated kinases pathways prevents tumour growth in KRAS-mutated colorectal cancer

Stefania Belli et al. Br J Cancer. 2023 Oct.

Abstract

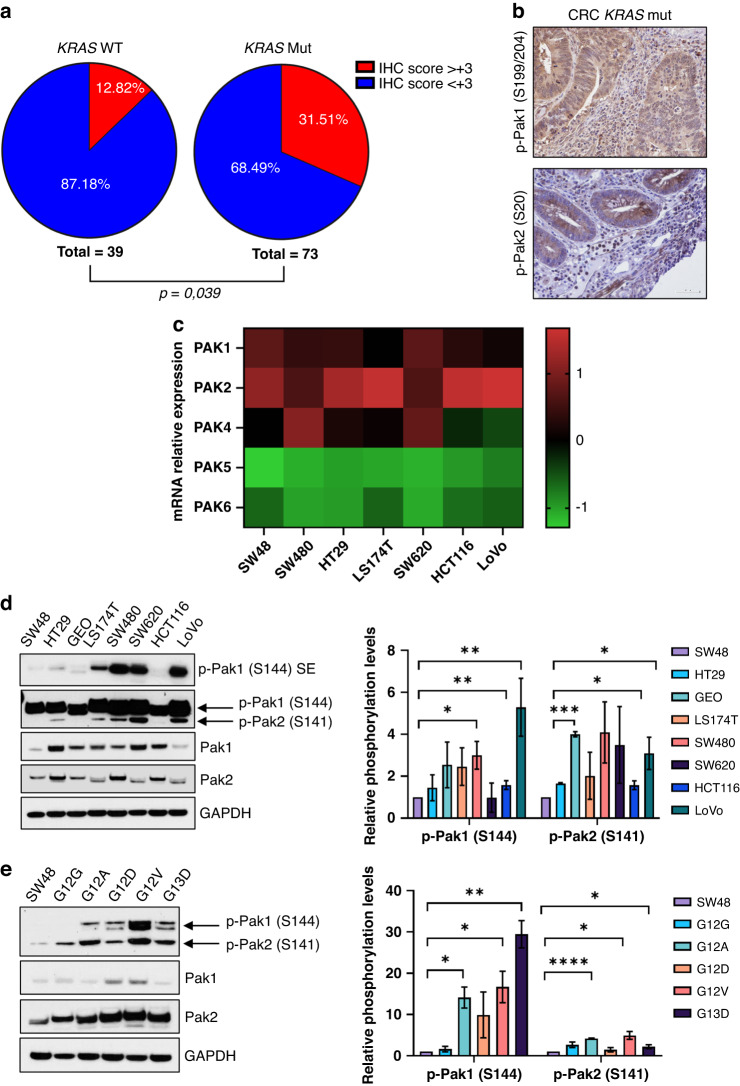
Background: The identification of novel therapeutic strategies for metastatic colorectal cancer (mCRC) patients harbouring KRAS mutations represents an unmet clinical need. In this study, we aimed to clarify the role of p21-activated kinases (Paks) as therapeutic target for KRAS-mutated CRC.

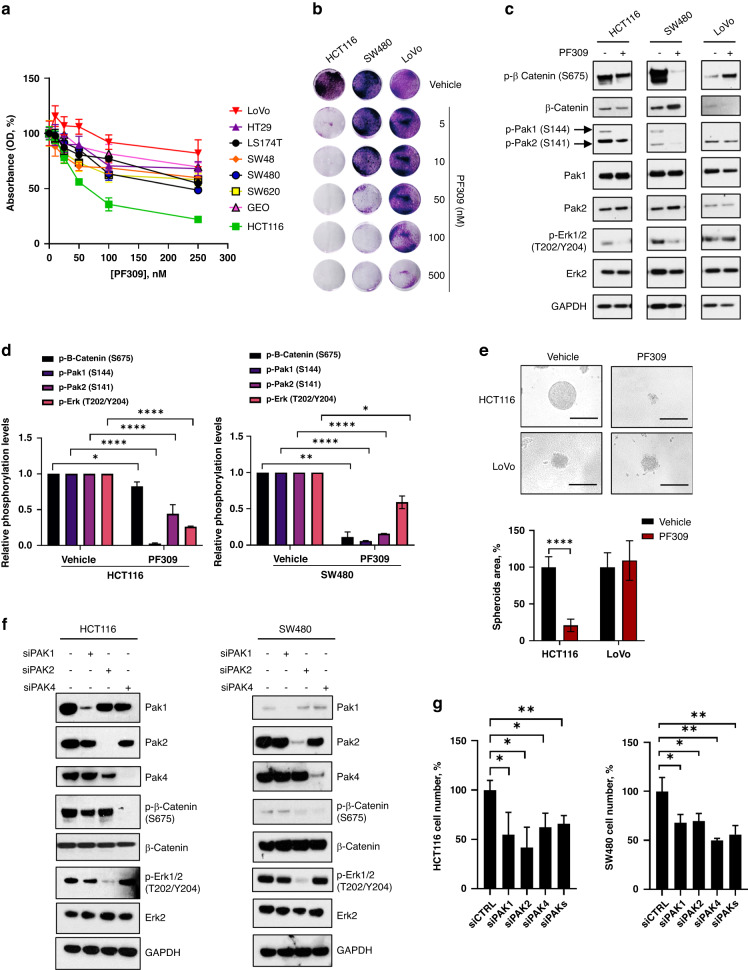
Methods: Paks expression and activation levels were evaluated in a cohort of KRAS-WT or -mutated CRC patients by immunohistochemistry. The effects of Paks inhibition on tumour cell proliferation and signal transduction were assayed by RNAi and by the use of three pan-Paks inhibitors (PF-3758309, FRAX1036, GNE-2861), evaluating CRC cells, spheroids and tumour xenografts' growth.

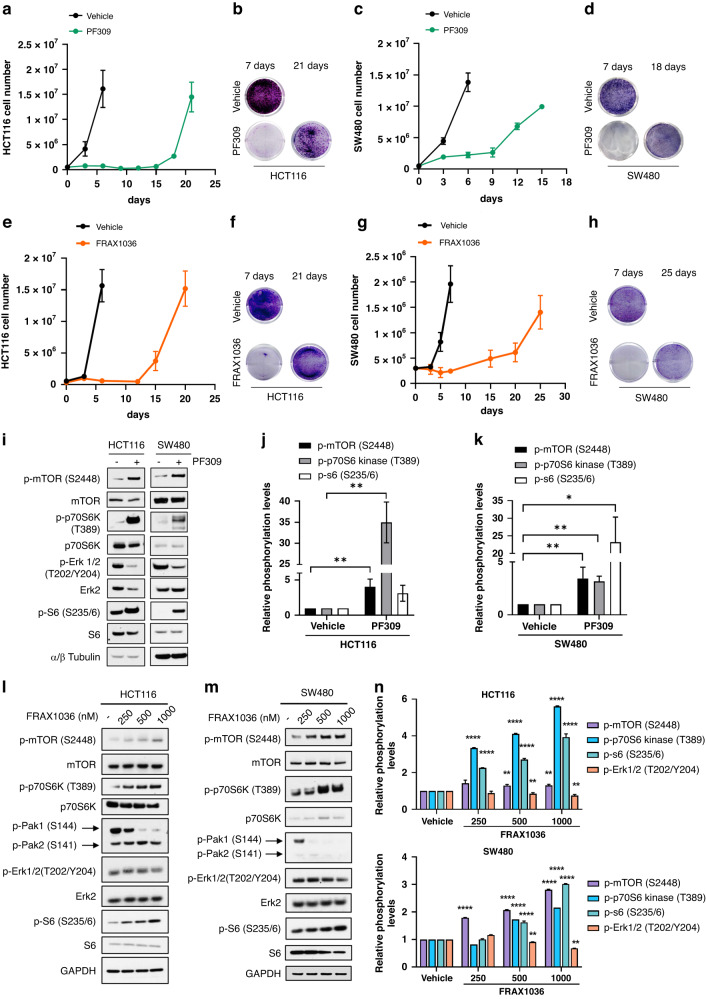
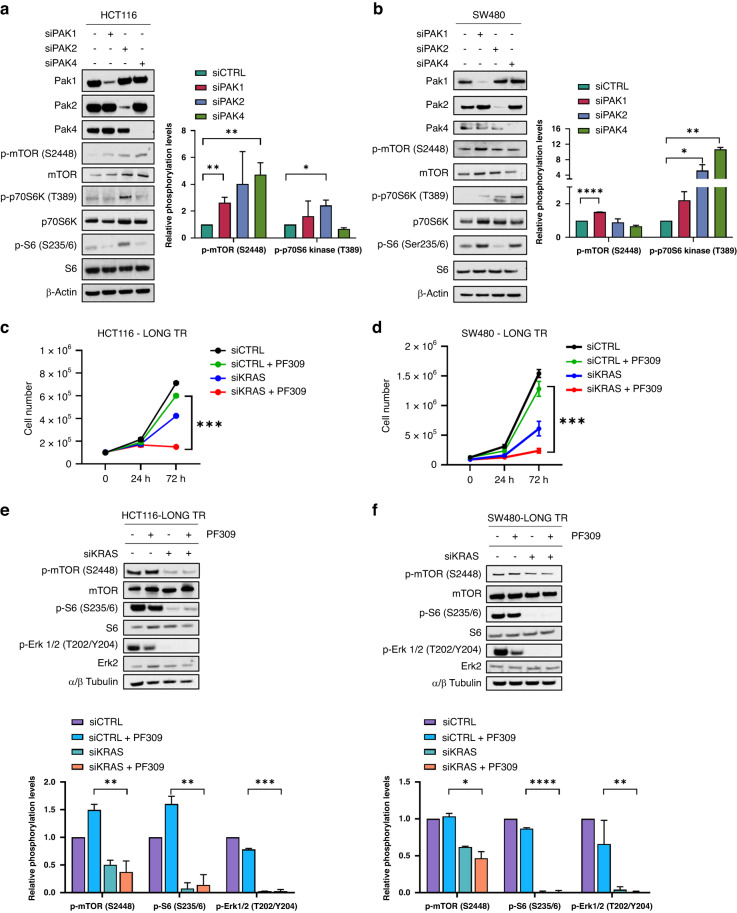
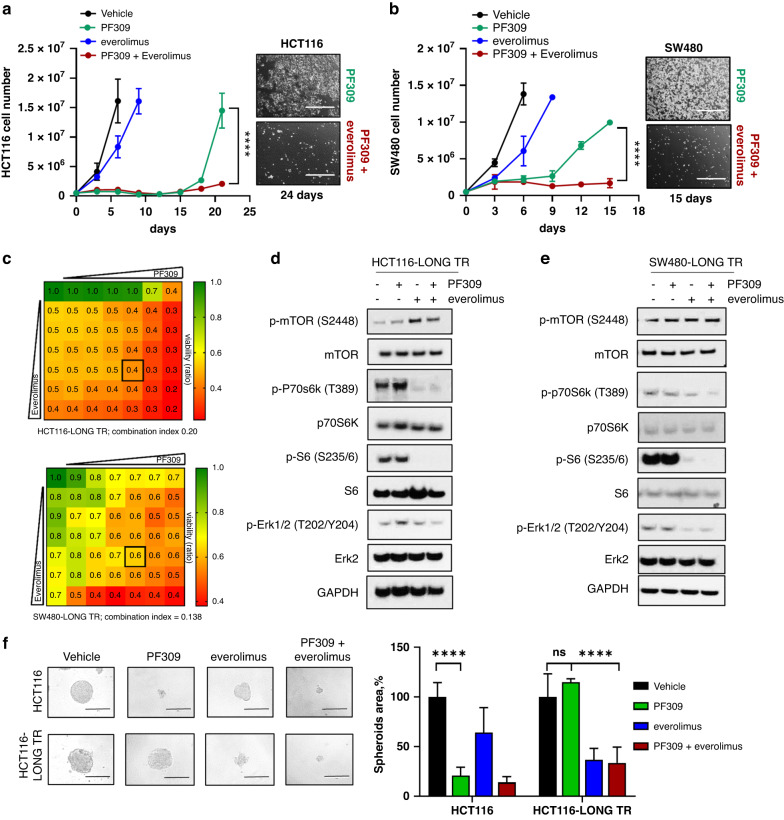
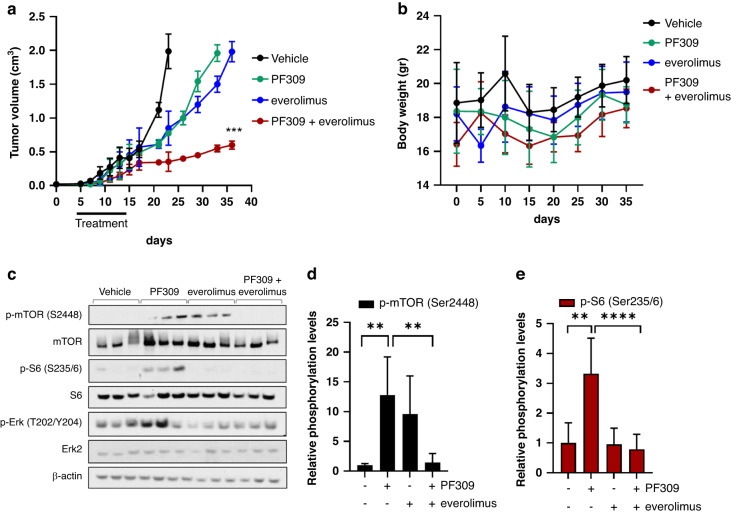
Results: Paks activation positively correlated with KRAS mutational status in both patients and cell lines. Moreover, genetic modulation or pharmacological inhibition of Paks led to a robust impairment of KRAS-mut CRC cell proliferation. However, Paks prolonged blockade induced a rapid tumour adaptation through the hyper-activation of the mTOR/p70S6K pathway. The addition of everolimus (mTOR inhibitor) prevented the growth of KRAS-mut CRC tumours in vitro and in vivo, reverting the adaptive tumour resistance to Paks targeting.

Conclusions: In conclusion, our results suggest the simultaneous blockade of mTOR and Pak pathways as a promising alternative therapeutic strategy for patients affected by KRAS-mut colorectal cancer.


Conflict of interest statement

AS reports honoraria from Eli Lilly, MSD, and Janssen and travel support from Bristol-Myers Squibb and AstraZeneca. LF declares the following competing interests: consultant and advisory board for Seagen, Amgen, BMS, MSD, Jansen and Pierre Fabre Pharma. RB declares the following competing interests: consultant and advisory board for BMS, MSD, Pfizer, AstraZeneca, Lilly and Novartis. The remaining authors declare no competing interests.

Figures

Fig. 1
Fig. 1. Expression and activation of p21-activated kinases in CRC patients and cell lines.
a Pie chart representing the percentage of samples included in the KRAS WT and KRAS-mutated CRC cohorts showing immunohistochemistry score (IHC score) >3 for p-Pak1 (Ser199/204) and p-Pak2 (Ser20) expression. b Representative immunohistochemical sections stained for p-Pak1 (upper panel) and p-Pak2 (lower panel) with IHC score >3 of KRAS-mut CRC patient sample (bar scale = 50 μM, ×40 magnification). c Heatmap of gene expression for PAKs in a panel of human CRC cell lines characterised by a different KRAS mutational status. The heatmap showed z-scores of differentially expressed genes of PAK family (PAK1-PAK6); up- and downregulated PAK genes are represented in red and green, respectively. Data show the mean of three independent experiments performed in triplicate. d Representative western blot analysis of Paks and p-Paks in KRAS WT (SW48, HT29) and KRAS-mutated CRC cell lines (GEO, LS174T, SW480, SW620, HCT116, LoVo) (left panel). GAPDH was used as a loading control. Images are representative of three independent experiments. Bar chart showing densitometric quantisation of the p-Pak1 (S144) and p-Pak2 (S141) performed using data from three independent experiments. Phosphorylation levels of Paks were compared to KRASwt SW48 ones (right panel). Data are expressed as mean ± standard deviation (*p < 0.05; **p < 0.01, ***p < 0.001; Student’s t-test). SE short exposed. e Western blot analysis of Paks and p-Paks in KRAS WT SW48 cell line stably transfected with plasmids carrying different KRAS mutations; GAPDH was used as a loading control. Images are representative of three independent experiments. Densitometric analysis of the p-Pak1 (S144) and p-Pak2 (S141) performed using data from three independent experiments is reported in bar chart (right panel). Phosphorylation levels of Paks were compared to KRASwt SW48 ones. Data are expressed as mean ± standard deviation (*p < 0.05; **p < 0.01, ***p < 0.001, ****p < 0.0001; Student’s t-test).
Fig. 2
Fig. 2. Effect of PAKs downregulation and pharmacological inhibition on cell proliferation and signalling activation in CRC cell lines.
a Percentage of cell survival of human CRC cell lines exposed to increasing doses of the Paks inhibitor PF-3758309 (PF309) ranging from 0 to 100 nM for 72 h, as measured by MTT assay. Data represent the mean (±SD) of three independent experiments, each performed in triplicate. Cell survival of untreated cells was considered as 100%. b Representative crystal violet stained monolayers of HCT116, SW480 or LoVo CRC were grown in 12-well plates and treated with the indicated PF309 doses for 72 h. c HCT116, SW480 and LoVo cell lines were treated with 100 nM PF309 for 24 h. Representative western blot analysis of the major Paks transducers was performed on total cell lysates. GAPDH was used as a loading control. Images are representative of three independent experiments. d Bar chart reporting densitometric analysis of the indicated molecular species performed using data from three independent experiments. Data are reported as relative to vehicle-treated samples and expressed as mean ± standard deviation (*p < 0.05; **p < 0.01, ****p < 0.0001; Student’s t-test) for HCT116 (left panel) and SW480 (right panel). e HCT116 and LoVo cells were grown in ultra-low attachment 96-well plates, to allow the formation of tumour spheroids. Spheroids were treated for 72 h with PF309 (50 nM) or vehicle (DMSO). Representative images of HCT116 and LoVo spheroids were captured at InvitrogenTM EVOSTM FL imaging system (bar scale = 200 μM, ×20 magnification) (upper panel). Per cent of spheroid area, quantified as described in Methods, of HCT116 and LoVo cells treated with PF309 or vehicle (DMSO). Spheroid area of cells treated with vehicle was considered as 100%. Data represent the mean (±SD) of three independent experiments, each performed in quadruplicate. Error bars indicate SD (****p < 0.001, Student’s t-test) (lower panel). f HCT116 (left panel) and SW480 (right panel) cells were transfected with siRNA for PAK1, PAK2 or PAK4, as described in Methods; siRNA scrambled was used as a control. Representative western blot analysis of the main Paks transducers performed 48 h after transfection on cell total lysates. GAPDH was used as loading control. Images are representative of three independent experiments. g HCT116 and SW480 cells were transfected with siRNA vs PAK1, PAK2 or PAK4 mRNA alone or in combination, as described in Methods; siRNA scrambled was used as a control (siCTRL). 72 h after PAKs knockdown per cent of cell number was determined by counting. Data represent the mean (±SD) of three independent experiments, each performed in triplicate (*p < 0.05; **p < 0.01, Student’s t-test).
Fig. 3
Fig. 3. Prolonged exposure of HCT116 and SW480 CRC cells to Paks inhibitors led to a rapid tumor adaptation.
a 5 × 105 HCT116 cells were seeded in p100 cell culture dishes for 24 h and treated with DMSO (vehicle) or 100 nM PF309. Cell were counted at the Countess 3 Automated Cell Counter (InvitrogenTM) every 3 days until cellular confluence and reported in the line chart. Each data point represents the mean ± SD of the representative experiment conducted in triplicate. b 5 × 104 HCT116 cells were seeded in 6-well plate for 24 h and treated with DMSO (vehicle) or 50 nM PF309 for 7 or 21 days. Cells were fixed at the indicated time points and stained with a crystal violet solution and scanned at 300 dpi. c 5 × 105 SW480 cells were seeded, treated and counted as described in panel (a). d 5 × 104 SW480 cells were seeded, treated and stained with crystal violet solution as described in panel (b). e 5 × 105 HCT116 cells were seeded in p100 cell culture dishes for 24 h and treated with 4-methylpyridine (vehicle) or 1 μM FRAX1036. Cells were counted and reported in line charts as described in panel (a). f Representative crystal violet stained monolayers of HCT116 cells treated with 4-methylpyridine (vehicle) or 1 μM FRAX1036 for 7 or 21 days. g 3 × 105 SW480 cells were seeded, treated with 4-methylpyridine (vehicle) or 3 μM FRAX1036 and counted as described in panel (e). h 5 × 104 SW480 cells were seeded, treated and stained with DMSO (vehicle) or 3 μM FRAX1036 crystal violet solution as described in panel (f). i Representative western blot analysis of HCT116 or SW480 treated with vehicle (DMSO) or PF309 (100 nM) for 24 h. α/β Tubulin was used as a loading control. Images are representatives from three independent experiments. j Bar chart reporting densitometric analysis of the indicated molecular species performed using data from three independent experiments. Data are reported as relative to vehicle-treated samples and expressed as mean ± standard deviation (*p < 0.05; **p < 0.01, Student’s t-test) for HCT116 (j) and for SW480 (k). l Representative western blot analysis of HCT116 or m SW480 treated with vehicle or with the indicated doses of FRAX1036 for 48 h. GAPDH was used as a loading control. Images are representatives from three independent experiments. n Bar chart reporting densitometric analysis of the indicated molecular species performed using data from three independent experiments. Data are reported as relative to vehicle-treated samples and expressed as mean ± standard deviation (**p < 0.01; ****p < 0.0001, Student’s t-test) for HCT116 (upper panel) and SW480 (lower panel).
Fig. 4
Fig. 4. Dissecting the effects of PAK1, 2 and 4 or KRAS knockdown on the mTOR pathway activation and cell proliferation.
a HCT116 or b SW480 cells were transfected with siRNA against PAK1, PAK2 or PAK4 as described in Methods; siRNA scrambled was used as a control. Representative western blot analysis of total cell lysates for the indicated antibodies was performed 48 h after transfection. Bar chart reporting densitometric analysis of p-mTOR (S2448) or p-p70 S6 Kinase (T389) performed using data from three independent experiments. Data are reported as relative to samples transfected with siCTRL and expressed as mean ± standard deviation (*p < 0.05; **p < 0.01, Student’s t-test) for HCT116 (a, right) and SW480 (b, right). c HCT116-LONG TR or d SW480-LONG TR cells were transfected with siRNA against KRAS. 24 h after gene knockdown, 1 × 105 cells were seeded in 6-well plate, counted after a further 24 h and treated with 100 nM PF309 for 72 h. Cell number was determined at the Countess 3 Automated Cell Counter (InvitrogenTM). Data represent the mean (±SD) of three independent experiments, each performed in triplicate (***p < 0.001; Student’s t-test). e HCT116-LONG TR or f SW480-LONG TR cells were transfected with siRNA vs KRAS mRNA for 48 h and treated for further 24 h with 100 nM PF309. siRNA scrambled was used as a control. Representative western blot analysis of total cell lysates for the indicated antibodies. Bar chart reporting densitometric analysis of the indicated molecular species performed using data from three independent experiments. Data are reported as relative to samples transfected with siCTRL and expressed as mean ± standard deviation (*p < 0.05; **p < 0.01, ***p < 0.001, ****p < 0.0001; Student’s t-test) for HCT116 (e, bottom) and SW480 (f, bottom).
Fig. 5
Fig. 5. Overcoming CRC tumour adaptation to PF309 through mTOR inhibition.
a 5 × 105 HCT116 cells were seeded in p100 cell culture dishes for 24 h and treated with vehicle (DMSO) 500 nM everolimus, 100 nM PF309 alone or in combination. Cells were counted at the Countess 3 Automated Cell Counter (InvitrogenTM) every 3 days until cellular confluence and reported in the line chart on the left. Each data point represents the mean ± SD of the representative experiment conducted in triplicate (****p < 0.0001; Student’s t-test). Representative images of HCT116 treated with PF309 alone or combined with everolimus 21 days after treatment are shown on the right. Images were captured at InvitrogenTM EVOSTM FL imaging system (×4 magnification, bars = 1000 µm). b 5 × 105 SW480 cells were seeded, treated, counted as described in panel (a) and reported in the line chart on the left. Each data point represents the mean ± SD of the representative experiment conducted in triplicate (****p < 0.0001; Student’s t-test). Representative images of SW480 treated with PF309 alone or combined with everolimus, 15 days after treatment are shown on the right (×4 magnification, bars = 1000 µm). c Viability assay to test synergy between PF309 and everolimus. HCT116-LONG TR (upper panel) or SW480-LONG TR (lower panel) cells were treated with increasing concentrations of PF309 and everolimus (up to 100 nM and 10 μM, respectively) alone or in combination every 72 h until vehicle-treated controls reached ∼90% of confluency. Intensity values of cell monolayers stained with crystal violet were used to perform the Chou–Talalay test. Numbers inside each box indicate the ratio of viable treated cells to untreated cells from three independent experiments. d Representative western blot analysis of HCT116-LONG TR or e SW480-LONG TR treated with vehicle, 100 nM PF309, 500 nM everolimus, alone or in combination for 24 h. GAPDH was used as a loading control. Images are representatives from three independent experiments. f Representative images of HCT116 and HCT116-LONG TR spheroids cultured in ultra-low attachment plates and treated with vehicle (DMSO) or PF309 10 or 500 nM everolimus alone or in combination every 72 h for 6 days. All images were captured at ×20 magnification (bars = 200 µm). Spheroids area is reported in the right panel; values are expressed as percentage relative to vehicle-treated spheroids. Data represent the mean (±SD) of three independent experiments, each performed in quadruplicate (****p < 0.001, two-way ANOVA Bonferroni’s multiple comparisons).
Fig. 6
Fig. 6. The combination of mTOR and Paks’ pathway blockade prevents HCT116 xenografts growth.
a HCT116 xenografts were established in Balb/c nude mice. Five days after injection, mice were treated with vehicle, everolimus (5 mg/kg once a day via o.g.), or PF309 (17 mg/kg once a day via o.g.) or both for 10 days. Tumour growth curve is shown. Each data point represents the mean of tumour volume in cm3 ±SD (n = 8 per arm, ***p < 0.001 vs. PF309 drug arms; Student’s t-test). b Line chart showing mice body weight trend during the pharmacological treatment. Data are presented as means ± SD. c Representative western blot analysis of proteins extracted from three representative HCT116 tumour xenografts after 4 h of treatment and blotted for the indicated antibodies. d Bar chart reporting densitometric analysis of p-mTOR (Ser2448) or e p-S6 (Ser235/6) performed using data from three independent experiments. Data are reported as relative to vehicle-treated samples and expressed as mean ± standard deviation (n = 8, **p < 0.01; ****p < 0.001, Student’s t-test).

References

    1. Biller LH, Schrag D. Diagnosis and treatment of metastatic colorectal cancer. JAMA] 2021;325:669. doi: 10.1001/jama.2021.0106. - DOI - PubMed
    1. Douillard J-Y, Oliner KS, Siena S, Tabernero J, Burkes R, Barugel M, et al. Panitumumab–FOLFOX4 treatment and RAS mutations in colorectal cancer. N Engl J Med. 2013;369:1023–34. doi: 10.1056/NEJMoa1305275. - DOI - PubMed
    1. Karthaus M, Hofheinz R-D, Mineur L, Letocha H, Greil R, Thaler J, et al. Impact of tumour RAS/BRAF status in a first-line study of panitumumab + FOLFIRI in patients with metastatic colorectal cancer. Br J Cancer. 2016;115:1215–22. doi: 10.1038/bjc.2016.343. - DOI - PMC - PubMed
    1. Canon J, Rex K, Saiki AY, Mohr C, Cooke K, Bagal D, et al. The clinical KRAS(G12C) inhibitor AMG 510 drives anti-tumour immunity. Nature. 2019;575:217–23. doi: 10.1038/s41586-019-1694-1. - DOI - PubMed
    1. Skoulidis F, Li BT, Dy GK, Price TJ, Falchook GS, Wolf J, et al. Sotorasib for lung cancers with KRAS p.G12C mutation. N Engl J Med. 2021;384:2371–81. doi: 10.1056/NEJMoa2103695. - DOI - PMC - PubMed

Publication types

MeSH terms

Substances