

Ultrasound-derived fat fraction for detection of hepatic steatosis and quantification of liver fat content
- PMID: 37568072
- PMCID: PMC10547617
- DOI: 10.1007/s11547-023-01693-8
Ultrasound-derived fat fraction for detection of hepatic steatosis and quantification of liver fat content
Abstract
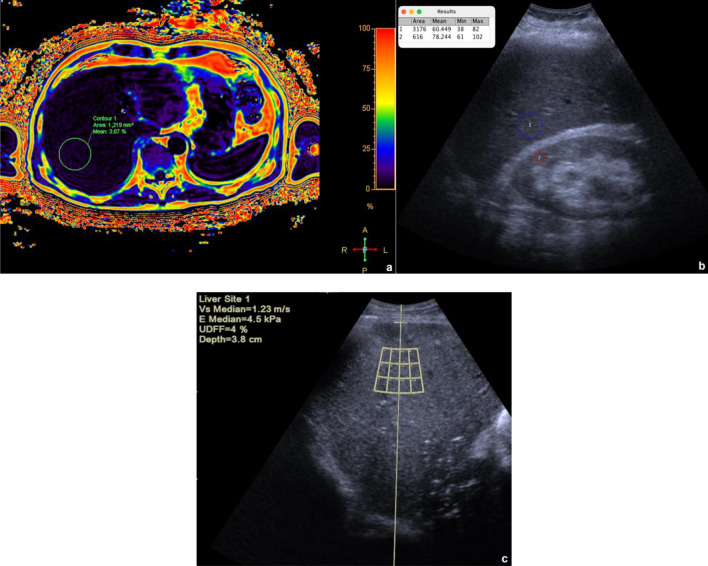
Purpose: To compare ultrasound (US) and US-derived fat fraction (UDFF) with magnetic resonance proton density fat fraction (MRI-PDFF) for the detection of hepatic steatosis and quantification of liver fat content.
Materials and methods: Between October and December 2022, 149 patients scheduled for an abdominal MRI agreed to participate in this study and underwent MRI-PDFF, US and UDFF. Inclusion criteria were: (a) no chronic liver disease or jaundice; (b) no MRI motion artifacts; (c) adequate liver examination at US. Exclusion criteria were: (a) alcohol abuse, chronic hepatitis, cirrhosis, or jaundice; (b) MRI artifacts or insufficient US examination. The median of 10 MRI-PDFF and UDFF measurements in the right hepatic lobe was analyzed. UDFF and MRI-PDFF were compared by Bland-Altman difference plot and Pearson's test. Sensitivity, specificity, positive and negative predictive values, accuracy, and area under the receiver-operator curve (AUC-ROC) of US and UDFF were calculated using an MRI-PDFF cut-off value of 5%. p values ≤ 0.05 were statistically significant.
Results: 122 patients were included (61 men, mean age 60 years, standard deviation 15 years). The median MRI-PDFF value was 4.1% (interquartile range 2.9-6); 37.7% patients had a median MRI-PDFF value ≥ 5%. UDFF and MRI-PDFF had high agreement (p = 0.11) and positive correlation (⍴ = 0.81, p < 0.001). UDFF had a higher diagnostic value than US for the detection of steatosis, with AUC-ROCs of 0.75 (95% CI 0.65, 0.84) and 0.53 (95% CI 0.42, 0.64), respectively.
Conclusions: UDFF reliably quantifies liver fat content and improves the diagnostic value of US for the detection of hepatic steatosis.
Keywords: Fatty liver; Liver; Magnetic resonance; Non-alcoholic fatty liver disease; Ultrasound.
© 2023. The Author(s).
Conflict of interest statement
The authors have no relevant financial or non-financial interests to disclose.
Figures


Comment in
-
Clinical applicability of US-based hepatic fat quantification tools may be expedited by adherence to guidelines.Radiol Med. 2023 Dec;128(12):1589-1590. doi: 10.1007/s11547-023-01727-1. Epub 2023 Sep 15. Radiol Med. 2023. PMID: 37713156 No abstract available.
-
Response to "Clinical application of US based hepatic fat quantification tools may be expedited by adherence to guidelines" by Sendur et al.Radiol Med. 2023 Dec;128(12):1591-1592. doi: 10.1007/s11547-023-01728-0. Epub 2023 Sep 20. Radiol Med. 2023. PMID: 37731150 No abstract available.
References
-
- European Association for the Study of the Liver (EASL); European Association for the Study of Diabetes (EASD); European Association for the Study of Obesity (EASO) EASL-EASD-EASO Clinical Practice Guidelines for the management of non-alcoholic fatty liver disease. J Hepatol. 2016 doi: 10.1016/j.jhep.2015.11.004. - DOI - PMC - PubMed
MeSH terms
LinkOut - more resources
Full Text Sources
Medical
