. 2023 Aug 11;24(1):197.
doi: 10.1186/s12931-023-02487-2.

Acid ceramidase gene therapy ameliorates pulmonary arterial hypertension with right heart dysfunction

Affiliations

Acid ceramidase gene therapy ameliorates pulmonary arterial hypertension with right heart dysfunction

Michael G Katz et al. Respir Res. .

Abstract

Background: Up-regulation of ceramides in pulmonary hypertension (PH), contributing to perturbations in sphingolipid homeostasis and the transition of cells to a senescence state. We assessed the safety, feasibility, and efficiency of acid ceramidase gene transfer in a rodent PH model.

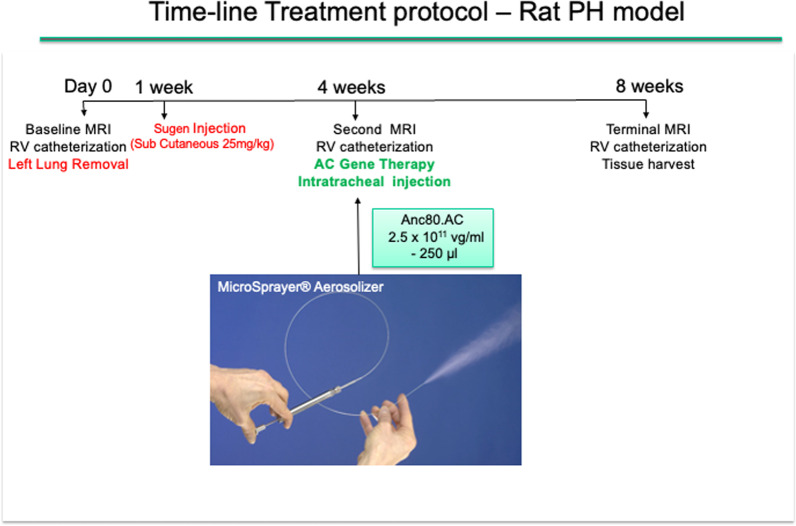
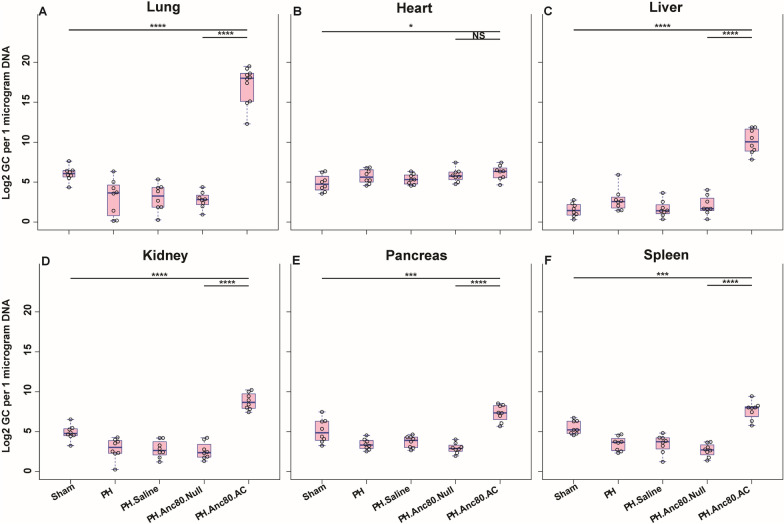
Methods: A model of PH was established by the combination of left pneumonectomy and injection of Sugen toxin. Magnetic resonance imaging and right heart catheterization confirmed development of PH. Animals were subjected to intratracheal administration of synthetic adeno-associated viral vector (Anc80L65) carrying the acid ceramidase (Anc80L65.AC), an empty capsid vector, or saline. Therapeutic efficacy was evaluated 8 weeks after gene delivery.

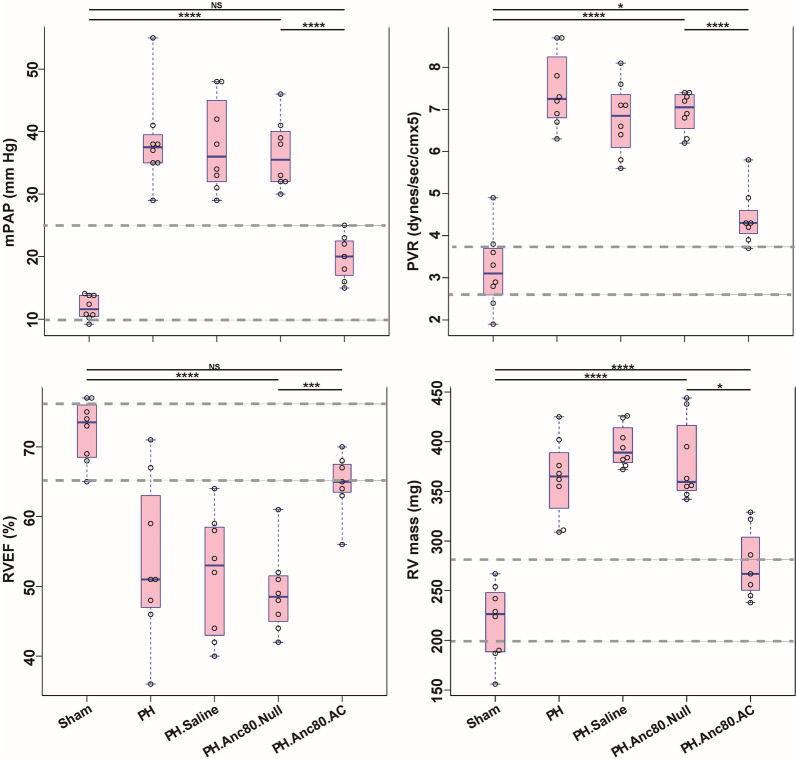
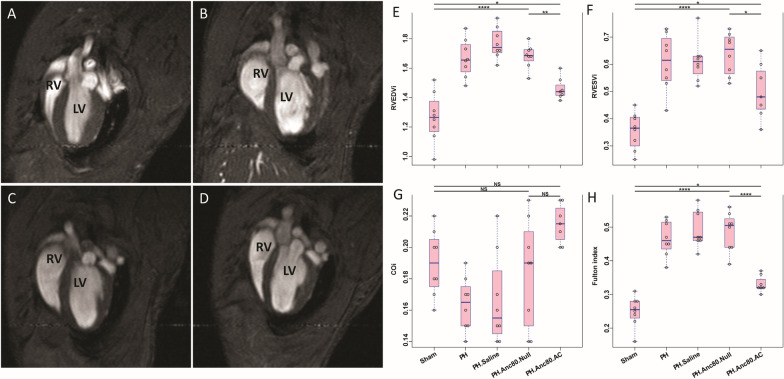
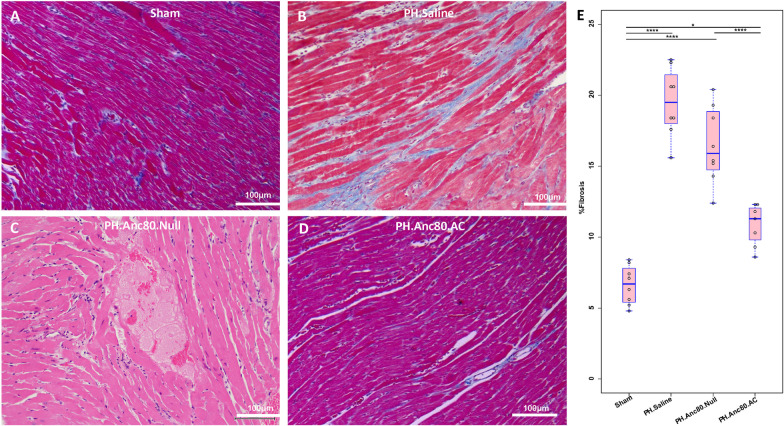
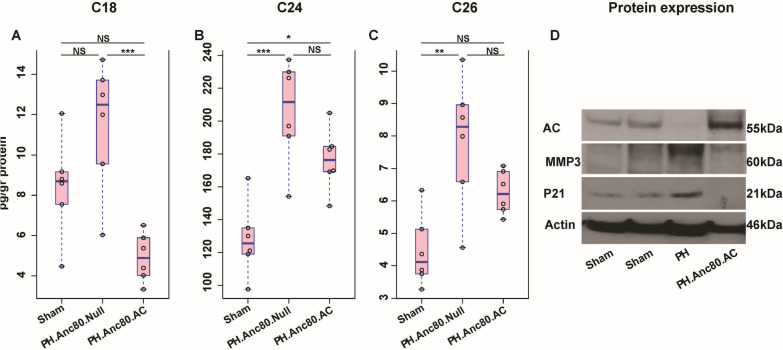
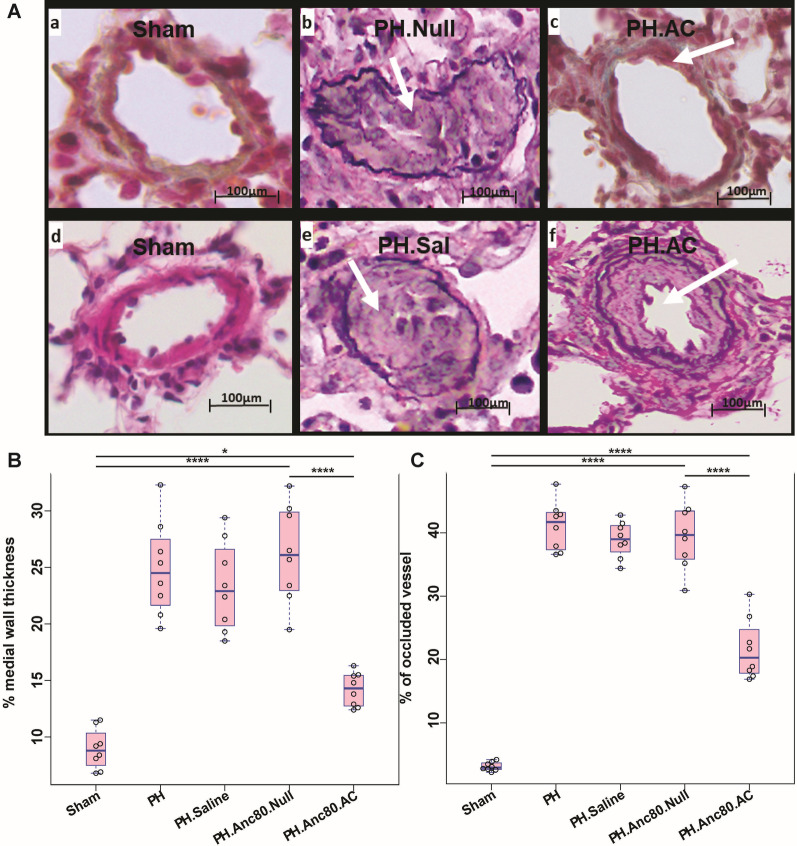
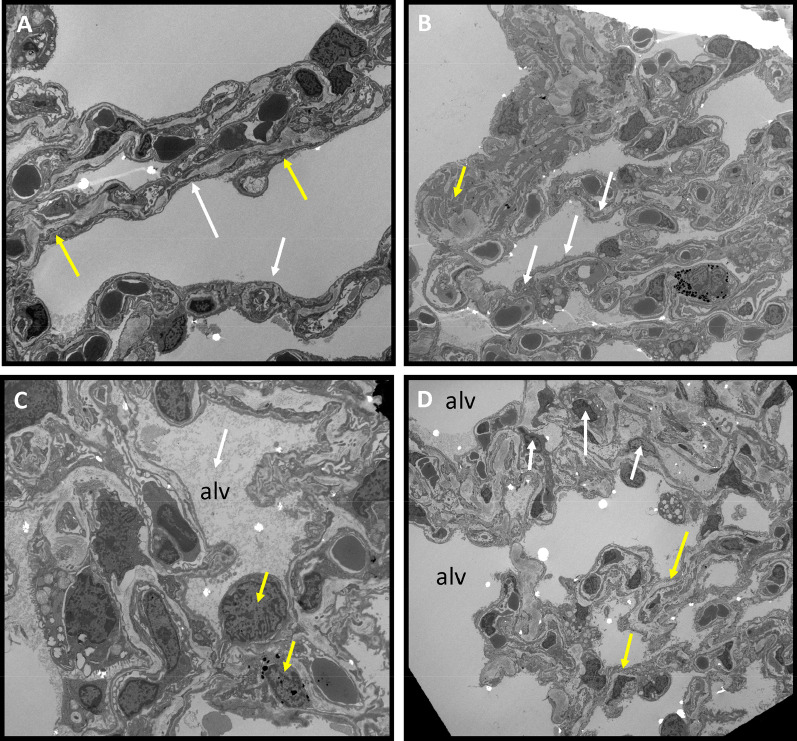
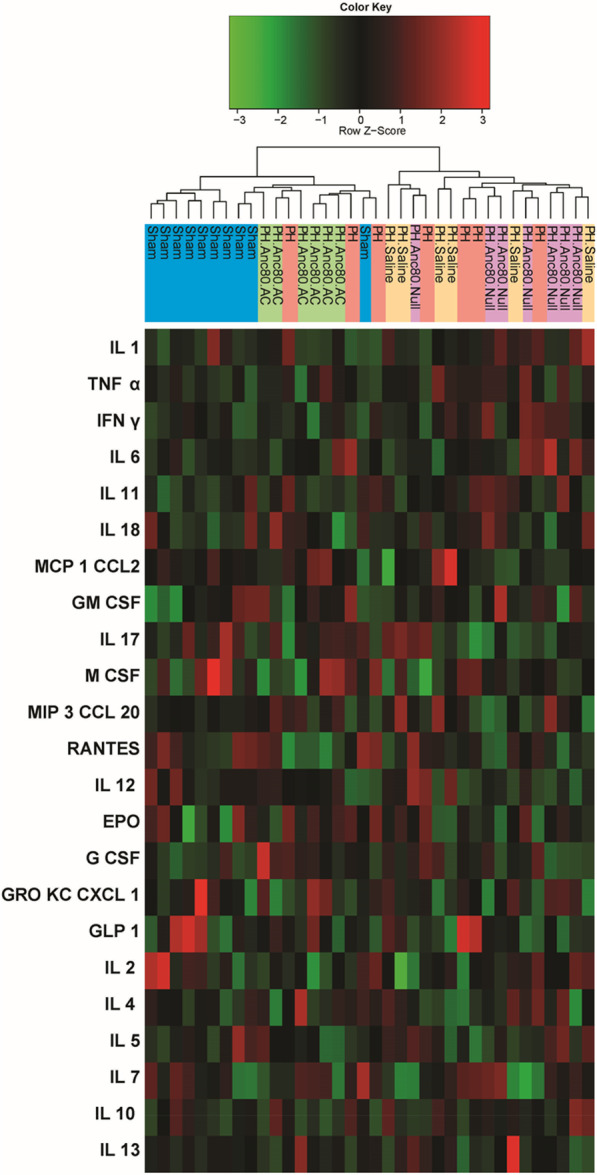
Results: Hemodynamic assessment 4 weeks after PH model the development demonstrated an increase in the mean pulmonary artery pressure to 30.4 ± 2.13 mmHg versus 10.4 ± 1.65 mmHg in sham (p < 0.001), which was consistent with the definition of PH. We documented a significant increase in pulmonary vascular resistance in the saline-treated (6.79 ± 0.85 mm Hg) and empty capsid (6.94 ± 0.47 mm Hg) groups, but not in animals receiving Anc80L65.AC (4.44 ± 0.71 mm Hg, p < 0.001). Morphometric analysis demonstrated an increase in medial wall thickness in control groups in comparison to those treated with acid ceramidase. After acid ceramidase gene delivery, a significant decrease of pro-inflammatory factors, interleukins, and senescence markers was observed.

Conclusion: Gene delivery of acid ceramidase provided tropism to pulmonary tissue and ameliorated vascular remodeling with right ventricular dysfunction in pulmonary hypertension.

Keywords: Adeno-associated virus; And acid ceramidase; Gene therapy; Pulmonary arterial hypertension; Sphingolipid metabolism.


Conflict of interest statement

The authors declare no competing interests.

Figures

Fig. 1
Fig. 1
A flow chart of time-line protocol
Fig. 2
Fig. 2
Evaluation of Anc80.AC effect on cardiopulmonary hemodynamic parameters and right ventricular function in rats 8 weeks post-PAH induction. Right ventricular (RV) hemodynamic parameters improved post gene therapy with Anc.80AC in PH model. A The mean pulmonary arterial pressure (mPAP, mm Hg). B Pulmonary vascular resistance index (PVR, dynes/sec/cmx5). C Right ventricular ejection fraction (RVEF, %). D Right ventricular mass (RV mass, mg). All continuous data were checked for normality and are presented as mean ± SD. Each group included 8 rats. Not significant p > 0.05; *p ≤ 0.05; **p ≤ 0.01; ***p ≤ 0.001; ****p ≤ 0.0001
Fig. 3
Fig. 3
Evaluation of Anc80.AC effect on heart function and dimensions using cardiac magnetic resonance imaging (MRI) in rats 8 weeks post- PH development. MRI-based hemodynamic indexes have a tendency to return to normal values after AC gene therapy. A Representative MRI image of long-axis view of sham rat with normal cardiac function. B Representative MRI image of long-axis view of PH established rat with progressive RV dilatation and increased RV end-diastolic and RV end-systolic index. C Representative MRI image of long-axis view of PH.Anc80.Null treated rat with progressive RV dilatation and increased RV end-diastolic and RV end-systolic index. D Representative MRI image of long-axis view of PH.Anc80.AC treated rat with reduction of RV dilatation and decreased RV end-diastolic and RV end-systolic index comparing to PH induced untreated rat
Fig. 4
Fig. 4
Right ventricular hypertrophy is ameliorated after Anc.80AC gene therapy in rats 8 weeks post-PH development. Representative hematoxylin–eosin staining is shown for: A Sham animals with normal RV structural organization. B PH.Anc80.Null. There is focally extensive replacement of myocardium by fibrous tissue with multifocal aggregates of lymphocytes and plasma cells. Also, there is degeneration of the myocytes adjacent to the fibrotic area characterized by swollen sarcoplasm, hypereosinophilia. C PH. Saline. Myocytes consistently had enlarged, hypertrophic and hyperchromatic nuclei, and myofibrillar disarray included cellular interplaying in various direction. Additionally, there is severe degeneration of myocytes with loss of cross striations. D PH.Anc80.AC. There is minimal to mild myxomatous change characterized by deposition of scant to mild amounts of amphophilic material and degeneration of few myocytes immediately adjacent. Rare lymphocytes are present in affected areas. Mild RV hypertrophic changes in this group of animals were seen. Bar scale: 100 μm and 200 μm
Fig. 5
Fig. 5
Organ’s viral cDNA Bio distribution of Anc80.AC in rats 8 weeks post-PH development. A Anc80.AC bio distribution in lungs. B Anc80.AC bio distribution in heart. C Anc80.AC bio distribution in liver. D Anc80.AC bio distribution in kidney. E Anc80.AC bio distribution in pancreas. F Anc80.AC bio distribution in spleen. All continuous data were checked for normality and are presented as mean ± SD. Each group included 8 rats. Not significant p > 0.05; *p ≤ 0.05; **p ≤ 0.01; ***p ≤ 0.001; ****p ≤ 0.0001
Fig. 6
Fig. 6
Immunofluorescence staining of AC protein and smooth muscle actin (SMA) in rat lungs 8 weeks post-PH development in control group (PH, untreated) and PH.Anc.80.AC group. Representative images showing AC protein (bright green dots) and nuclei were visualized by DAPI staining (blue dots). A, E AC protein expression. B, F DNA DAPI staining. C, G SMA staining. D, H merge image of AC and DNA labeling. A–D PH. An80.Null. D–G PH.Anc80.AC. Scale bar: 50 μm
Fig. 7
Fig. 7
Assessment of main ceramides after Anc.80AC gene therapy in rats 8 weeks post-PH development. AC Main ceramides level changes in Sham, PH.Anc80.Null and PH.Anc80.AC groups (pg/gr protein). AC gene therapy decreased level of main ceramide types. All continuous data were checked for normality and are presented as mean ± SD. Each group included 8 rats. Not significant p > 0.05; *p ≤ 0.05; **p ≤ 0.01; ***p ≤ 0.001; ****p ≤ 0.0001. D Representative western blot imaging of main senescence markers in lungs after Anc.80AC gene therapy in rats 8 weeks post-PAH creation. Senescence markers expression decreased after AC gene therapy. P21 cyclin-dependent kinase inhibitor 1, MMP-3 metalloproteinase-3, kDa kilodaltons, low molecular weight proteins
Fig. 8
Fig. 8
Histo-pathology results of the lungs in PH established untreated and PH established Anc.80AC treated animals. AaAf Representative hematoxylin–eosin and Verhoeff-van Gieson staining. Aa, Ab Sham animals; normal pulmonary arteries. Ac, Ad PH.Anc80.Null. Concentric laminar neointimal lesions. A cross-sectional view of completely occluded small pulmonary arteries by a complex lesions (grade 3–4). Ae, Af PH.Anc.80.AC. Mild neointimal reaction and proliferation, recanalization of small pulmonary artery (grade 1–2). B, C Percentage of occluded small pulmonary vessels, and medial wall thickness post Anc.80AC gene therapy in rats 8 weeks post-PH development. Scale bar: 100 μm. All continuous data were checked for normality and are presented as mean ± SD. Each group included 8 rats. Not significant p > 0.05; *p ≤ 0.05; **p ≤ 0.01; ***p ≤ 0.001; ****p ≤ 0.0001
Fig. 9
Fig. 9
Transmission electron microscopy of PH established in control groups and PH.Anc.80AC treated rats 8 weeks post-PH development). A Sham. Normal, flat endothelial cells in the alveolo-capillary membrane separated from smooth muscle cells (white arrows) by thick basement membrane (yellow arrows). B PH.Anc80.Null. Intimal lesion displaying invagination of endothelial cells in the intima (white arrows). Swollen endothelium and thickened interstitium. Many collagens elastic fibers (yellow arrow). C PH.Saline Alveolar edema with fibrin in alveoli’s (white arrow). Presenting many inflammatory cells in interstitium. Degeneration of red and white blood cells with damaged the basement membrane (yellow arrow). D PH.Anc80.AC Endothelial layer denser and preserved (yellow arrow). Decreased number of inflammatory cells in the interstitium (white arrow), no alveolar edema. Bar scale: 10 μm, magnification: 2.500
Fig. 10
Fig. 10
Changes in pro-inflammatory and anti-inflammatory cytokines expression at 8 weeks post-PH development. Among 23 cytokines investigated, a significant decrease of TNFα, INFγ, and interleukins 1, 6, 10, 12 were observed in Anc80.AC treated animals compared to untreated groups. The dendrogram shows the clustering of cytokines. The vertical line is name of cytokine. The horizontal line is group of the animals. The colors represent expression of IL, interleukin; EPO, erythropoietin; M CSF, macrophage colony-stimulating factor; MCP1 CCL2, monocyte chemoattractant protein; TNFα, tumor necrosis factor; G CSF, granulocyte colony-stimulating factor; IFNγ, interferon gamma; MIP3 CCL20, macrophage inflammatory protein; GRO KC CXCL 1, chemokine ligand; GLP 1, glucagon-like peptide; GM CSF, granulocyte–macrophage colony-stimulating factor

Similar articles

Cited by

References

    1. Hoeper MM, Gibbs SR. The changing landscape of pulmonary arterial hypertension and implications for patient care. Eur Respir Rev. 2014;23:450–457. doi: 10.1183/09059180.00007814. - DOI - PMC - PubMed
    1. Sweatt AJ, Reddy R, Rahaghi FN, Al-Naamani N. What’s new in pulmonary hypertension clinical research. Pulm Circ. 2021;11:20458940211040713. doi: 10.1177/20458940211040713. - DOI - PMC - PubMed
    1. Frump AL, Albrecht M, Yakubov B, Breuils-Bonnet S, Nadeau V, Tremblay E, Potus F, Omura J, Cook T, Fisher A, Rodriguez B, Brown RD, Stenmark KR, Rubinstein CD, Krentz K, Tabima DM, Li R, Sun X, Chesler NC, Provencher S, Bonnet S, Lahm T. 17β-Estradiol and estrogen receptor α protect right ventricular function in pulmonary hypertension via BMPR2 and apelin. J Clin Invest. 2021;131(6):e129433. doi: 10.1172/JCI129433. - DOI - PMC - PubMed
    1. Hannun YA, Obeid LM. Sphingolipids and their metabolism in physiology and disease. Nat Rev Mol Cell Biol. 2018;19:175–191. doi: 10.1038/nrm.2017.107. - DOI - PMC - PubMed
    1. Tibboel J, Reiss I, de Jongste JC, Post M. Sphingolipids in lung growth and repair. Chest. 2014;145:120–128. doi: 10.1378/chest.13-0967. - DOI - PubMed

MeSH terms

Substances