. 2023 Aug 11;14(1):201.
doi: 10.1186/s13287-023-03425-1.

Fetal Muse-based therapy prevents lethal radio-induced gastrointestinal syndrome by intestinal regeneration

Affiliations

Fetal Muse-based therapy prevents lethal radio-induced gastrointestinal syndrome by intestinal regeneration

Honorine Dushime et al. Stem Cell Res Ther. .

Abstract

Background: Human multilineage-differentiating stress enduring (Muse) cells are nontumorigenic endogenous pluripotent-like stem cells that can be easily obtained from various adult or fetal tissues. Regenerative effects of Muse cells have been shown in some disease models. Muse cells specifically home in damaged tissues where they exert pleiotropic effects. Exposition of the small intestine to high doses of irradiation (IR) delivered after radiotherapy or nuclear accident results in a lethal gastrointestinal syndrome (GIS) characterized by acute loss of intestinal stem cells, impaired epithelial regeneration and subsequent loss of the mucosal barrier resulting in sepsis and death. To date, there is no effective medical treatment for GIS. Here, we investigate whether Muse cells can prevent lethal GIS and study how they act on intestinal stem cell microenvironment to promote intestinal regeneration.

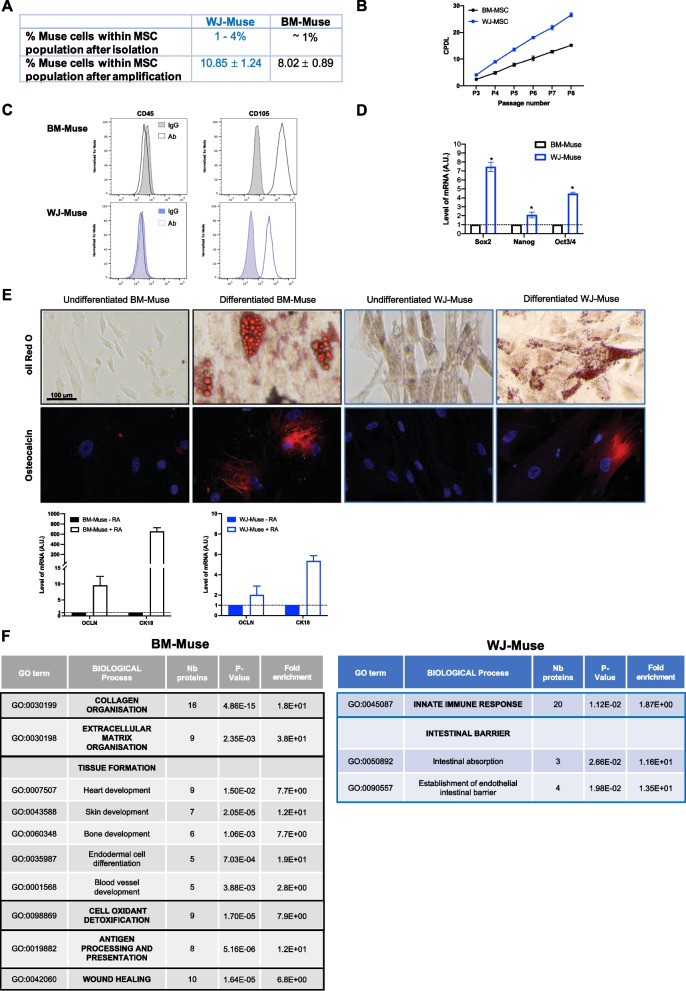
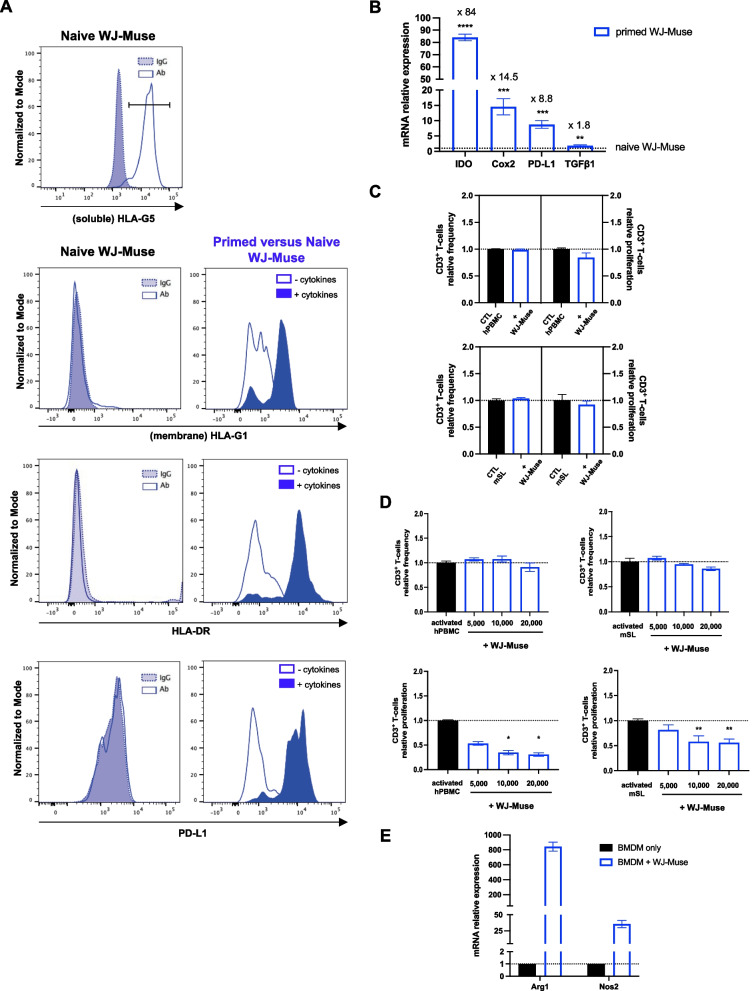
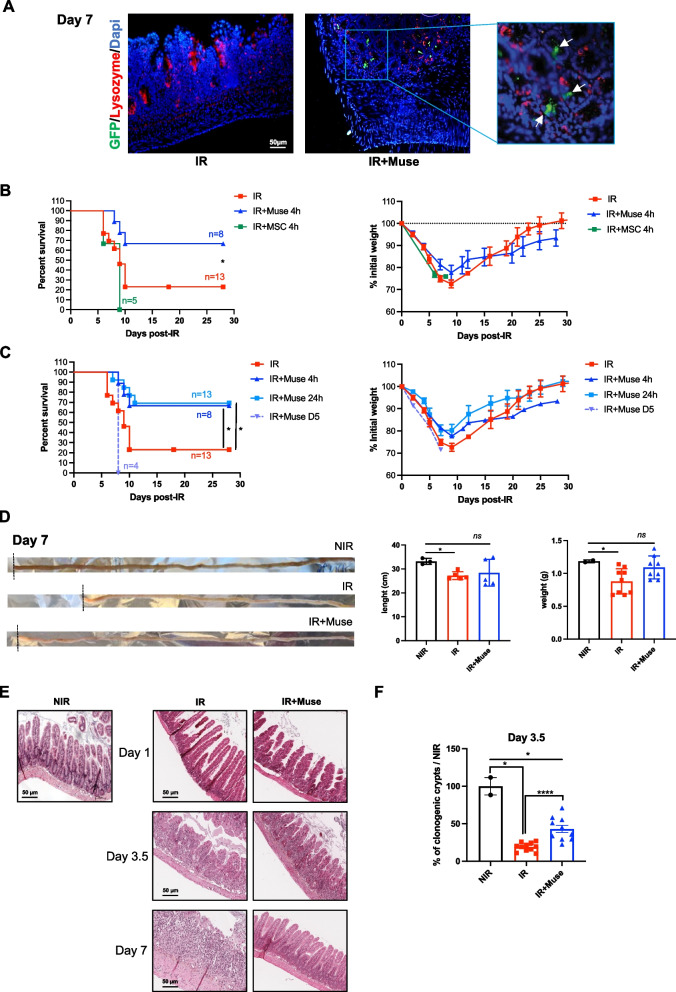
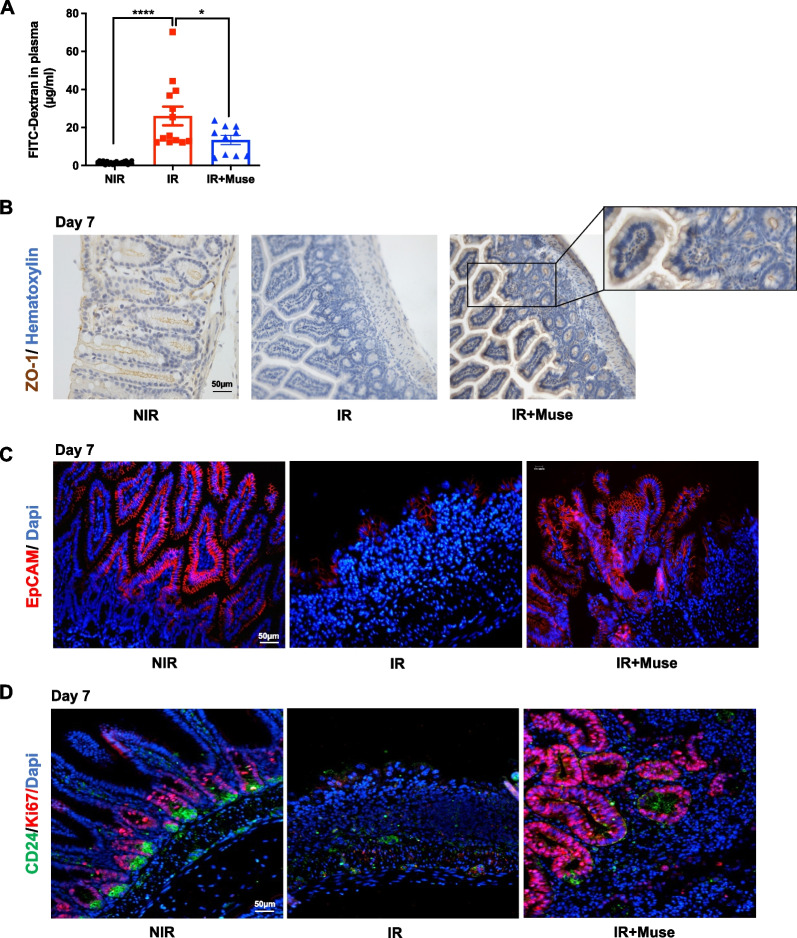
Methods: Human Muse cells from Wharton's jelly matrix of umbilical cord (WJ-Muse) were sorted by flow cytometry using the SSEA-3 marker, characterized and compared to bone-marrow derived Muse cells (BM-Muse). Under gas anesthesia, GIS mice were treated or not through an intravenous retro-orbital injection of 50,000 WJ-Muse, freshly isolated or cryopreserved, shortly after an 18 Gy-abdominal IR. No immunosuppressant was delivered to the mice. Mice were euthanized either 24 h post-IR to assess early small intestine tissue response, or 7 days post-IR to assess any regenerative response. Mouse survival, histological stainings, apoptosis and cell proliferation were studied and measurement of cytokines, recruitment of immune cells and barrier functional assay were performed.

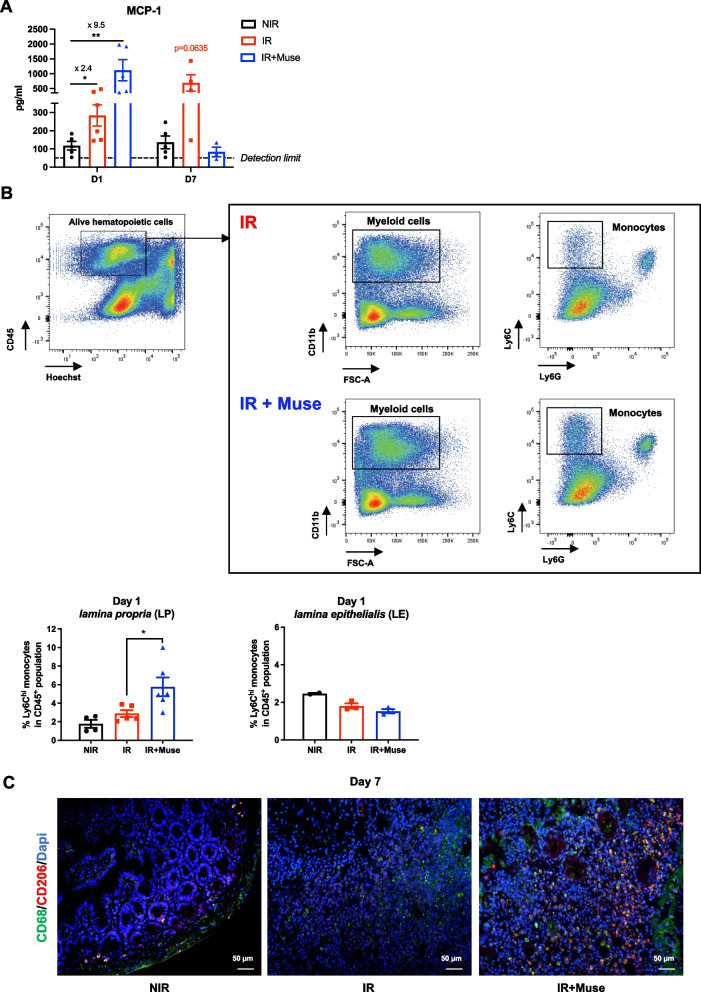
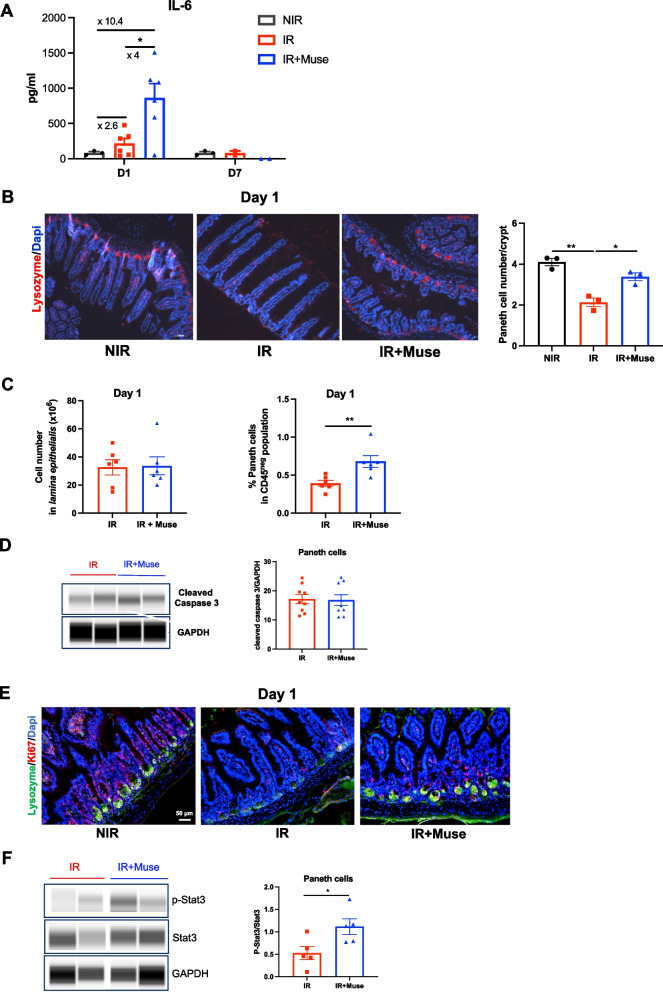
Results: Injection of WJ-Muse shortly after abdominal IR highly improved mouse survival as a result of a rapid regeneration of intestinal epithelium with the rescue of the impaired epithelial barrier. In small intestine of Muse-treated mice, an early enhanced secretion of IL-6 and MCP-1 cytokines was observed associated with (1) recruitment of monocytes/M2-like macrophages and (2) proliferation of Paneth cells through activation of the IL-6/Stat3 pathway.

Conclusion: Our findings indicate that a single injection of a small quantity of WJ-Muse may be a new and easy therapeutic strategy for treating lethal GIS.

Keywords: Muse cells; Radio-induced gastro-intestinal syndrome; Regeneration; Stem cell microenvironment.


Conflict of interest statement

The authors declare that they have no competing interest.

Figures

Fig. 1
Fig. 1
WJ-Muse have biological advantages in comparison with BM-Muse. A Proportion of Muse cells among the BM-MSC or the WJ-MSC population, before and after amplification until passage 7 of culture. B Comparison of the cumulative population doubling levels (CPDL) of BM-MSC and WJ-MSC between passage 3 and passage 8 of culture. Data are represented with means ± SEM. C Representative flow analysis of CD45 (hematopoietic marker) and CD105 (MSC marker) in BM-Muse and WJ-Muse cells. D mRNA expression by RT-qPCR of Sox2, Nanog and Oct3/4 in WJ-Muse compared to BM-Muse. Data are represented with means ± SEM, *p < 0.05 (two-tailed Mann–Whitney U test). E Adipogenic, osteogenic and epithelial differentiation of BM-Muse and WJ-Muse. Upper images: morphological features of BM-Muse and WJ-Muse are illustrated before and after differentiation. Adipocyte cells are stained with oil Red O; osteocyte cells are immunostained with osteocalcin (red) and counterstained with Dapi (blue); Lower histograms: epithelial differentiation was shown in BM-Muse and WJ-Muse with mRNA expression of cytokeratin18 (CK18) and occluding (OCLN) with or without retinoic acid treatment. F Comparative analysis of biological processes occurring in BM-Muse and WJ-Muse cells, identified by proteomic analysis
Fig. 2
Fig. 2
WJ-Muse display immunosuppressive properties. A Left: Representative flow analysis of HLA-G5 (soluble human leukocyte antigen-G5 marker), HLA-G1 (membrane-bound human leukocyte antigen-G1 marker), HLA-DR (MHC Class II, human leukocyte antigen marker) and PD-L1 (human Programmed death-ligand 1) in naive WJ-Muse. IgG were used as reference controls. Right: Representative flow analysis of HLA-G1, HLA-DR and PD-L1 in TNFα/IFNγ-primed WJ-Muse compared to naive WJ-Muse. B Evaluation of IDO, Cox2, PD-L1 and TGFβ1 expression level by quantitative real time PCR, in TNFα/IFNγ-primed WJ-Muse compared to naive WJ-Muse. Data are represented with means ± SEM, **p < 0.01; ***p < 0.001; ****p < 0.0001 (unpaired Student’s t test). C 105 human peripheral blood mononuclear cells (hPBMC) or murine spleen lymphocytes (mSL) were co-cultured with 104 WJ-Muse in order to evaluate their allogeneic or xenogeneic immune privilege. Frequency and proliferation of BrdU-labeled CD3+ T-cells were analyzed by flow cytometry and compared to hPBMC or mSL alone. Data are represented with means ± SEM. D Human peripheral blood mononuclear cells (hPBMC) or murine spleen lymphocytes (mSL) activated with concanavalin A were co-cultured with 5 × 103, 10 × 103 or 20 × 103 WJ-Muse to determine their allogeneic and xenogeneic immunosuppressive potential, respectively. Frequency (top) and proliferation (bottom) of human (left) or murine (right) BrdU-labeled CD3+ T-cells were analyzed by flow cytometry and compared, respectively, with activated hPBMC or mSL alone. Data are represented with means ± SEM, *p < 0.05, **p < 0.01 (two-tailed Mann–Whitney U test). E Arginase-1 (Arg1) and Nitric oxide synthase-2 (Nos2) mRNA expression were measured in bone marrow-derived macrophages (BMDM), which have been co-cultured for 7 days with WJ-Muse. Data are represented with mean ± SEM
Fig. 3
Fig. 3
Muse improve survival by maintaining the intestinal integrity in GIS mouse model. A Representative images of immunofluorescence showing Lysozyme-positive cells (red) in the small intestine of non-treated or Muse-treated mice at 7 days after irradiation. Integrated GFP+ Muse (green) are identified with white arrows. Nuclei were counterstained with DAPI (blue). B Kaplan–Meier survival analysis (left) and weight loss changes (right) for 29 days of 18 Gy abdominal exposed mice receiving or not a 50,000 MSC or 50,000 Muse-treatment 4 h after irradiation. Statistical difference of survival between groups was determined by Log-rank (Mantel-Cox) test, with *p ≤ 0.05 considered as significant. Weight data are represented with means ± SEM. C Kaplan–Meier survival analysis (left) and weight loss changes (right) for 29 days of 18 Gy abdominal exposed mice receiving or not a 50,000 Muse-treatment 4 h, 24 h or 5 days after irradiation. Statistical difference of survival between groups was determined by Log-rank (Mantel-Cox) test, with *p ≤ 0.05 considered as significant. Weight data are represented with means ± SEM. D Illustration (left), length (middle) and weight (right) of the small intestine of non-treated or Muse-treated mice 7 days after irradiation, compared to non-irradiated (NIR) control mice. Data are represented with means ± SEM, *p < 0.05; ns: not significant (two-tailed Mann–Whitney U test). E Representative HE staining of small intestine of non-treated or Muse-treated mice at 1, 3.5 and 7 days after irradiation, compared to non-irradiated control mice. F Histogram plots showing the percentage of surviving clonogenic crypts in small intestine of non-treated or Muse-treated mice at 3.5 days after irradiation, compared to non-irradiated control mice. Data are represented with means ± SEM, *p < 0.05; ****p < 0.001 (two-tailed Mann–Whitney U test)
Fig. 4
Fig. 4
Muse are required for intestinal epithelium regeneration. A Intestinal permeability illustrated by histogram plots showing 4-kDa FITC-Dextran levels measured in the plasma of non-treated or Muse-treated mice at 7 days after irradiation, compared to non-irradiated control mice. Data are represented with means ± SEM, *p < 0.05; ****p < 0.001 (two-tailed Mann–Whitney U test). B Representative immunohistochemical images showing the expression of ZO-1 protein (brown) in ileum sections of non-treated or Muse-treated mice at 7 days after irradiation, compared to non-irradiated control mice. Nuclei were counterstained with hematoxylin (blue). C Representative immunofluorescent images showing EpCAM-positive cells (red) in the small intestine of non-treated or Muse-treated mice at 7 days after irradiation, compared to non-irradiated control mice. Nuclei were counterstained with DAPI (blue). D Representative immunofluorescent images showing CD24-positive cells (green) and Ki67-positive cells (red) in the small intestine of non-treated or Muse-treated mice at 7 days after irradiation, compared to non-irradiated control mice. Nuclei were counterstained with DAPI (blue)
Fig. 5
Fig. 5
Monocyte/M2-Macrophage recruitment is induced by Muse treatment. A Histogram plots showing MCP-1 secretion level in supernatant of 7 h-cultured terminal ileum excised from non-treated or Muse-treated at 1 or 7 days after irradiation, compared to non-irradiated control mice. Data are represented with means ± SEM, *p < 0.05; **p < 0.01 (two-tailed Mann–Whitney U test). B Representative flow cytometry gating strategy for analysis of monocyte subset in lamina propria isolated from small intestine of non-treated (top) or Muse-treated (bottom) mice at 1 day after irradiation. Histograms plots showing the proportion of M1-like monocytes (Ly6Chi) among the alive CD45+ population from the lamina propria (left) and lamina epithelialis (right) fractions of non-treated or Muse-treated mice at 1 day after irradiation, compared to non-irradiated control mice (bottom). Data are represented with means ± SEM, *p < 0.05 (two-tailed Mann–Whitney U test). C Representative immunofluorescence images showing CD68-positive (green) and CD206-positive (red) macrophages in the small intestine of non-treated or Muse-treated mice at 7 days after irradiation, compared to non-irradiated control mice. Nuclei were counterstained with DAPI (blue)
Fig. 6
Fig. 6
Muse enhance Paneth cell proliferation and IL-6/Stat3 signaling pathway. A Histogram plots showing IL-6 level in supernatant of 7-h-cultured intestine excised from non-treated or Muse-treated mice 1 or 7 days after irradiation, compared to non-irradiated mice. Data are represented with means ± SEM, *p < 0.05 (two-tailed Mann–Whitney U test). B Representative immunofluorescence images showing Lysozyme-positive cells (red) in the ileum of non-treated or Muse-treated mice 1 day after irradiation, compared to non-irradiated mice. Nuclei were counterstained with DAPI (blue) (top). Histogram plots showing Paneth cell number per crypts (bottom). Data are represented with means ± SEM, *p < 0.05; **p < 0.01 (two-tailed Mann–Whitney U test). C Histograms plots showing total cell number in the lamina epithelialis fraction (left) and proportion of Paneth cells (CD24hiCD166med/+) among CD45neg population (right) in non-treated or Muse-treated mice 1 day after irradiation. Data are represented with means ± SEM, **p < 0.01 (two-tailed Mann–Whitney U test). D Representative cropping western blot showing protein level of cleaved caspase-3 in Paneth cells isolated from two non-treated and two Muse-treated mice 1 day after irradiation (left). GAPDH was used as internal control. Full length blots are presented in Additional file 1: Fig. S4A. Quantitative analysis of cleaved caspase 3 protein level normalized to GAPDH (right). Data are represented with means ± SEM. E Representative immunofluorescence images showing Lysozyme-positive cells (green) and Ki67-positive cells (red) in ileum of non-treated or Muse-treated mice 1 day after irradiation, compared to non-irradiated mice. Nuclei were counterstained with DAPI (blue). F Representative cropping western blot showing protein levels of p-Stat3 and Stat3 in Paneth cells isolated from two non-treated and two Muse-treated mice 1 day after irradiation. GAPDH was used as internal control (left). Full length blots are presented in Additional file 1: Fig. S4B. Quantitative analysis of the p-Stat3/Stat3 ratio after normalization to GAPDH (right). Data are represented with means ± SEM. *p < 0.05 (two-tailed Mann–Whitney U test)

References

    1. François A, Milliat F, Guipaud O, Benderitter M. Inflammation and immunity in radiation damage to the gut mucosa. Biomed Res Int. 2013;2013:123241. - PMC - PubMed
    1. Gelberg HB. Comparative anatomy, physiology, and mechanisms of disease production of the esophagus, stomach, and small intestine. Toxicol Pathol. 2014;42:54–66. - PubMed
    1. Potten CS. Stem cells in gastrointestinal epithelium: numbers, characteristics and death. Philos Trans R Soc Lond B Biol Sci. 1998;353:821–830. - PMC - PubMed
    1. Barker N, van Oudenaarden A, Clevers H. Identifying the stem cell of the intestinal crypt: strategies and pitfalls. Cell Stem Cell. 2012;11:452–460. - PubMed
    1. Santos AJM, Lo Y-H, Mah AT, Kuo CJ. The intestinal stem cell niche: homeostasis and adaptations. Trends Cell Biol. 2018;28:1062–1078. - PMC - PubMed

Publication types

LinkOut - more resources