Review
. 2023 Jul 31;15(15):3898.
doi: 10.3390/cancers15153898.

Metabolites and Immune Response in Tumor Microenvironments

Affiliations
Review

Metabolites and Immune Response in Tumor Microenvironments

Salvatore Cortellino et al. Cancers (Basel). .

Abstract

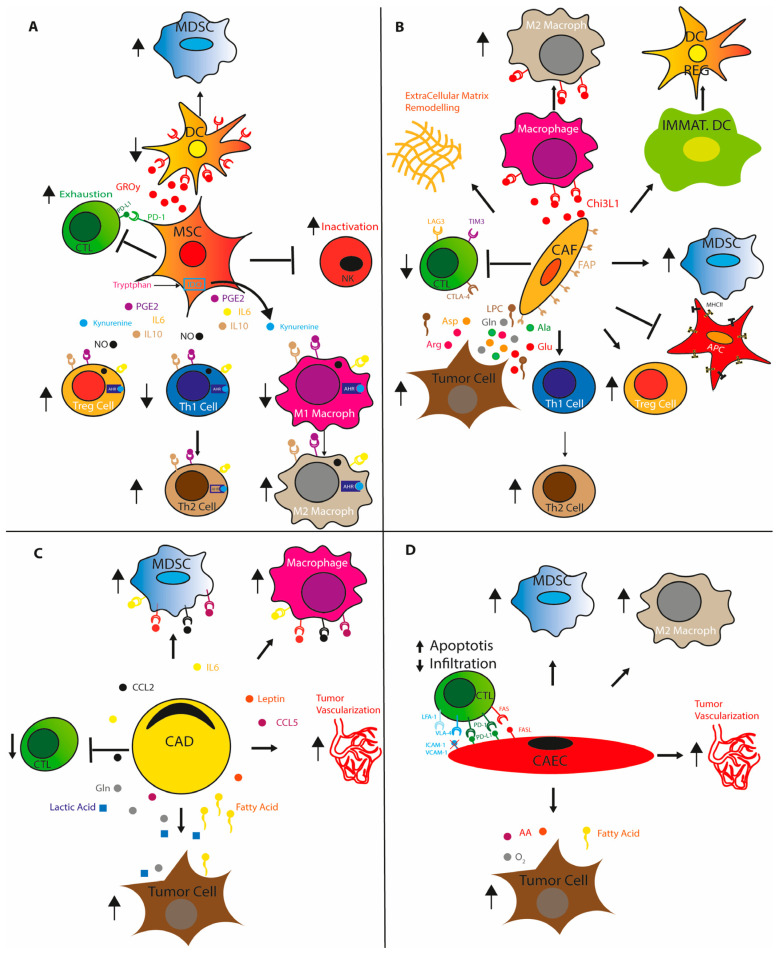
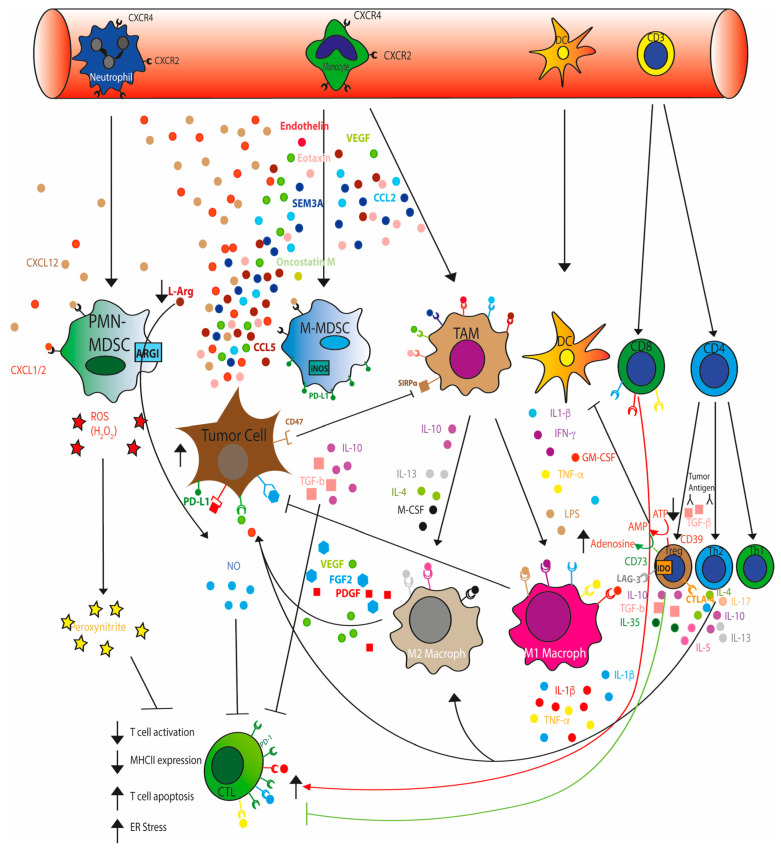
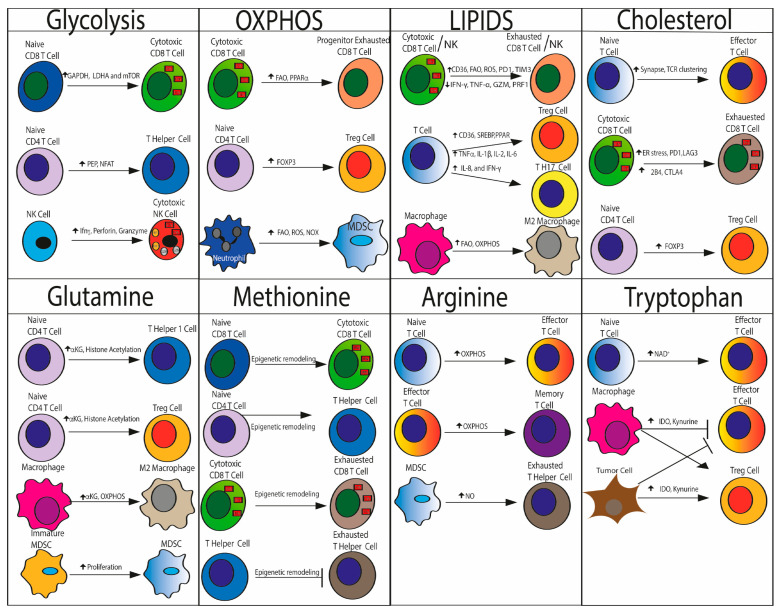
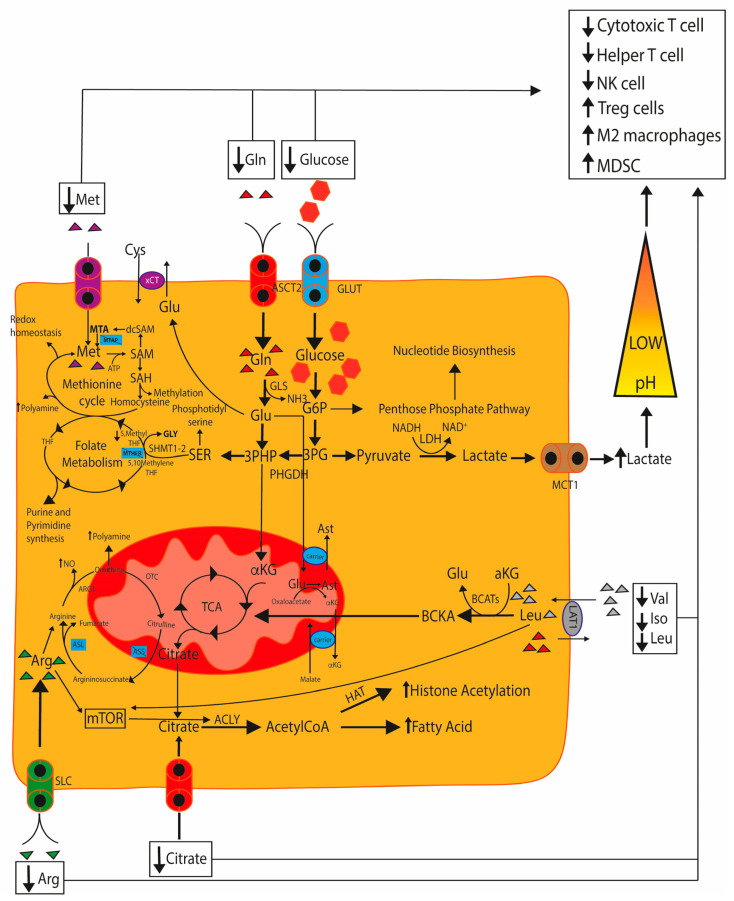
The remodeled cancer cell metabolism affects the tumor microenvironment and promotes an immunosuppressive state by changing the levels of macro- and micronutrients and by releasing hormones and cytokines that recruit immunosuppressive immune cells. Novel dietary interventions such as amino acid restriction and periodic fasting mimicking diets can prevent or dampen the formation of an immunosuppressive microenvironment by acting systemically on the release of hormones and growth factors, inhibiting the release of proinflammatory cytokines, and remodeling the tumor vasculature and extracellular matrix. Here, we discuss the latest research on the effects of these therapeutic interventions on immunometabolism and tumor immune response and future scenarios pertaining to how dietary interventions could contribute to cancer therapy.

Keywords: diets; immune system; metabolism.


Conflict of interest statement

V.D.L. holds intellectual property rights on clinical uses of FMD and equity interest in L-Nutra, a company that markets medical food.

Figures

Figure 1
Figure 1
Stromal cells contribute to generate an immunosuppressive tumor microenvironment. (A) Mesenchymal stem cells (MSC). (B) Cancer associated fibroblasts (CAFs). (C) Cancer associated adipocytes (CADs) and (D) Cancer associated endothelial cells (CAECs) promote immune suppressive cells recruitment, proliferation and differentiation by releasing chemokines, cytokines and metabolites in TME. Stromal cells induce T cells exhaustion by expressing immune checkpoint and prevents T cell recruitment by reshaping tumor vasculature. IL6, IL10: interleukin 6, 10; PGE2: prostaglandin E2; ID01: Indoleamine-pyrrole2,3-dioxygenase; AHR: Aryl Hydrocarbon Receptor; GRO-y: Growth-regulated oncogene-Y chemokine; Chi3L1: chitinase-like protein 3; Gin: glutamine; Glu: glutamate; Arg: arginine; Ala: alanine; Asp: aspartate; LPC: lysophosphatidylcholine; MDSCs: myeloid-derived suppressor cells; CTLs: cytotoxic T lymphocytes; DCs: dendritic cells; DCregs: regulatory DCs.
Figure 2
Figure 2
Cancer cells shape the tumor microenvironment through secretion of soluble factors and recruitment of immunosuppressive cells. Neutrophils and monocytes migrate to TME attracted by chemokines such as CXCL12 and CXCL1, released by cancer cells, and differentiate into polymorphonuclear (PMN−) and mononuclear (M−) MDSCs. PMN-MDSCs suppress immune cells by producing ROS, peroxinitrite and prostaglandins and depleting TME of arginine by upregulating arginase I expression. M-MDSCs inhibit T cells, B cells and natural killer (NK) cells by producing nitric oxide (NO), immunosuppressive IL-10 and TGFβ and immune checkpoint molecules such as PDL1. Chemokine and growth factors (VEGF, CCL2, CCL5, CSF-1, EMAP-II, endothelin-2, SEMA3A, oncostatin M, and eotaxin), secreted by cancer cells, promote the migration of monocytes into the TME and their differentiation into tumor-associated macrophages (TAMs). TAMs differentiate into anti-tumor M1 macrophages upon stimulation with IFN-γ, lipopolysaccharide, IL-1β, TNF and/or GM-CSF, and into pro-tumor M2 macrophages upon stimulation with IL-4, IL-10, IL-13 and/or M-CSF. Tumor antigens, cytokines (such as TGF-B) promote CD4 differentiation in immunosuppressive Treg and T helper type 2 cells (Th2). Th2 cells secrete protumor cytokines IL-4, IL-5, IL-10, IL-13, and IL-17, recruits M2 macrophages by releasing IL-5 and IL-13 and promotes MDSCs infiltration by increasing vascular leakage through IL17 secretion. Tregs impair CTL, NK and dendritic cell function by secreting immunosuppressive cytokines such as IL-10, TGF-β and IL-35, expressing the immune checkpoint receptor (LAG3, CTLA4) the enzyme IDO, which converts tryptophan to kynurenine and CD39 and CD73 nucleases that convert ATP to adenosine.
Figure 3
Figure 3
Metabolic changes in TME regulates adaptive and innate immune system function. Glycolysis supports naïve CD8 and CD4 T cells and NK cell activation. Progenitor exhausted T cells, Tregs and MDDSC rely on oxidative phosphorylation (OXPHOS) and fatty acid oxidation (FAO) Increased concentration of FFAs within TME leads to CD8 T cell and NK exhaustion, renders T cell exhausted and anergic, and promotes the differentiation of CD4 T cells into Tregs and Th17 and skews macrophage polarization toward protumoral M2-like TAMs which mainly depend on FAO and OXPHOS for their metabolism and bioenergetic demands. Glutamine metabolism promotes CD4 T cell differentiation towards Th1 and Treg cells, TAM polarization towards the protumor M2 phenotype and MDSC expansion. Methionine metabolism regulate T cell activation and exhaustion by remodeling epigenetic landscape. Arginine enhances T cells survival and supports effector and memory T cells generation by modulates OXPHOS activity, whereas production of nitric oxide from arginine catabolism by MDSC-expressed arginase leads to Thelper cell dysfunction and anergy. Tryptophane is required for T lymphocyte effector functions as promotes NAD+ synthesis. Conversion of tryptophan to kynurenine via IDO1, expressed by tumors and macrophages, promotes Treg expansion and renders effector T cells exhausted. Cholesterol improves cytotoxic function by enhancing immunological synapse formation and maturation, and promoting TCR clustering and signaling. Instead, high cholesterol content in TME hampers T cell function as induces ER stress and expression of exhaustion markers, such as PD-1, LAG-3, TIM-3, 2B4 and CTLA-4. Finally cholesterol induces FOXP3 expression and promotes Treg differentiation. LDHA: lactate dehydrogenase A; GAPDH: glyceraldehyde-3-phosphate dehydrogenase; PEP: phosphoenolpyruvate; NFAT-1: nuclear factor of activated T cells; lfnγ: interferon-γ; PRF1: perforin; GZM: granzyme B; α-KG: α-ketoglutarate; NO: nitric oxide; OXPHOS: oxidative phosphorylation; FAO: fatty acid oxidation; ROS: reactive oxygen species; NOX: NADPH oxidase isoforms.
Figure 4
Figure 4
Cancer metabolism promotes immunosuppressive TME. Cancer cells mainly rely on glycolysis as it supports the biosynthesis of nucleotide, via penthose phosphate pathway and folate metabolism cycle, and molecules involved in controlling the redox state of the cell, via methionine cycle. LDH: lactate dehydrogenase; 3PG: 3-phosphoglyceric acid; 3PHP: 3-phospho-hydroxypyruvate; Glu: glutamate; α-KG: α-ketoglutarate; TCA: tricarboxylic acid cycle; ACLY: ATP citrate lyase; OXPHOS: oxidative phosphorylation; MAS: malate-aspartate shuttle; xCT: Cystine/Glutamate Antiporter; MTAP: methylthioadenosine phosphorylase; MTHFR: methylenetetrahydrofolate reductase; ASS1: arginine synthase 1; ASL: argininosuccinate lyase; Arg: arginine; SLC6A14, SLC7A3, SLC7A9: arginine transporters; NO: nitric oxide; ARG1: arginase 1; Lat1: branched amino acids transporter; BCKA: branched-chain α-ketoacids.

References

    1. Elia I., Schmieder R., Christen S., Fendt S.M. Organ-Specific Cancer Metabolism and Its Potential for Therapy. Handb. Exp. Pharmacol. 2016;233:321–353. doi: 10.1007/164_2015_10. - DOI - PubMed
    1. Mayers J.R., Torrence M.E., Danai L.V., Papagiannakopoulos T., Davidson S.M., Bauer M.R., Lau A.N., Ji B.W., Dixit P.D., Hosios A.M., et al. Tissue of origin dictates branched-chain amino acid metabolism in mutant Kras-driven cancers. Science. 2016;353:1161–1165. doi: 10.1126/science.aaf5171. - DOI - PMC - PubMed
    1. Yuneva M.O., Fan T.W., Allen T.D., Higashi R.M., Ferraris D.V., Tsukamoto T., Mates J.M., Alonso F.J., Wang C., Seo Y., et al. The metabolic profile of tumors depends on both the responsible genetic lesion and tissue type. Cell Metab. 2012;15:157–170. doi: 10.1016/j.cmet.2011.12.015. - DOI - PMC - PubMed
    1. Pavlova N.N., Thompson C.B. The Emerging Hallmarks of Cancer Metabolism. Cell Metab. 2016;23:27–47. doi: 10.1016/j.cmet.2015.12.006. - DOI - PMC - PubMed
    1. Hofer S.J., Davinelli S., Bergmann M., Scapagnini G., Madeo F. Caloric Restriction Mimetics in Nutrition and Clinical Trials. Front. Nutr. 2021;8:717343. doi: 10.3389/fnut.2021.717343. - DOI - PMC - PubMed

LinkOut - more resources