

Radiomics and Hybrid Models Based on Machine Learning to Predict Levodopa-Induced Dyskinesia of Parkinson's Disease in the First 6 Years of Levodopa Treatment
- PMID: 37568874
- PMCID: PMC10417024
- DOI: 10.3390/diagnostics13152511
Radiomics and Hybrid Models Based on Machine Learning to Predict Levodopa-Induced Dyskinesia of Parkinson's Disease in the First 6 Years of Levodopa Treatment
Abstract
Background: Current research on the prediction of movement complications associated with levodopa therapy in Parkinson's disease (PD) is limited. levodopa-induced dyskinesia (LID) is a movement complication that seriously affects the life quality of PD patients. One-third of PD patients develop LID within 1 to 6 years of levodopa treatment. This study aimed to construct models based on radiomics and machine learning to predict early LID in PD.
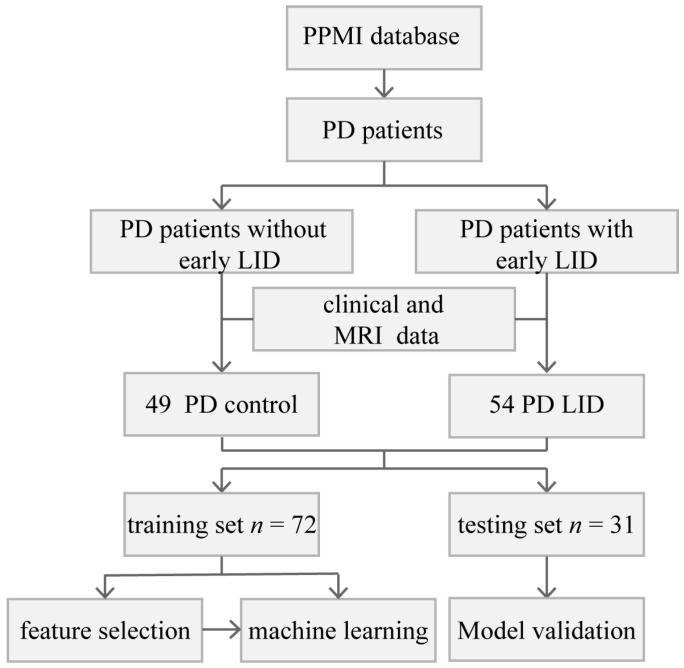
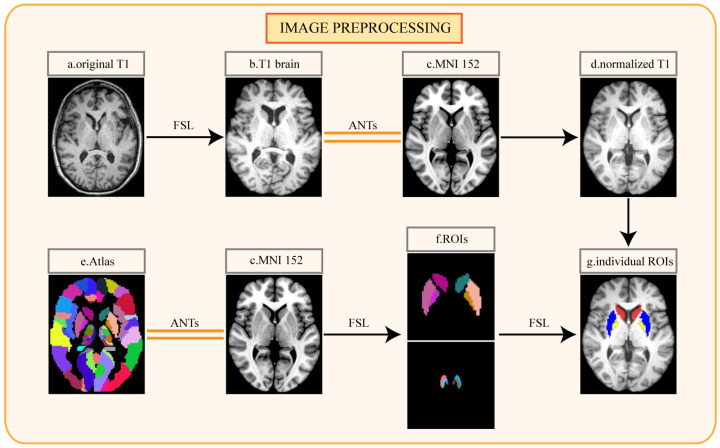
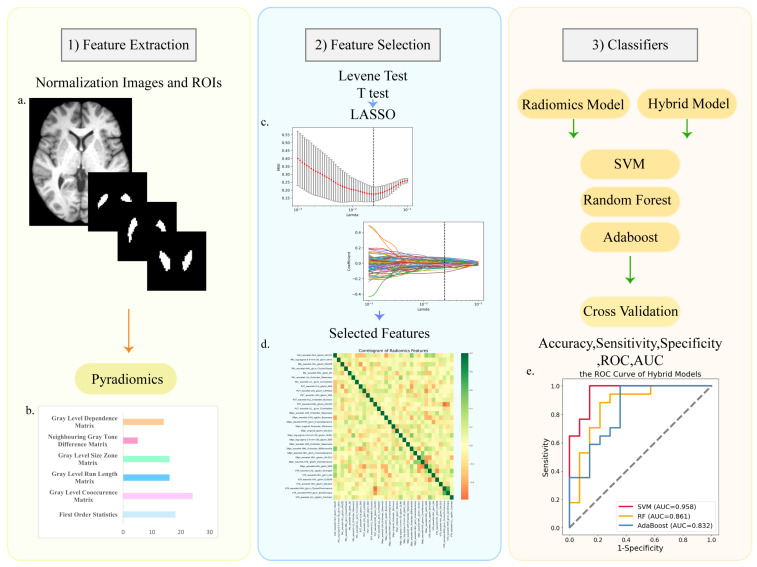
Methods: We extracted radiomics features from the T1-weighted MRI obtained in the baseline of 49 PD control and 54 PD with LID in the first 6 years of levodopa therapy. Six brain regions related to the onset of PD were segmented as regions of interest (ROIs). The least absolute shrinkage and selection operator (LASSO) was used for feature selection. Using the machine learning methods of support vector machine (SVM), random forest (RF), and AdaBoost, we constructed radiomics models and hybrid models. The hybrid models combined the radiomics features and the Unified Parkinson's Disease Rating Scale part III (UPDRS III) total score. The five-fold cross-validation was performed and repeated 20 times to validate the stability of the classifiers. We used sensitivity, specificity, accuracy, receiver operating characteristic (ROC) curves, and area under the ROC curve (AUC) for model validation.
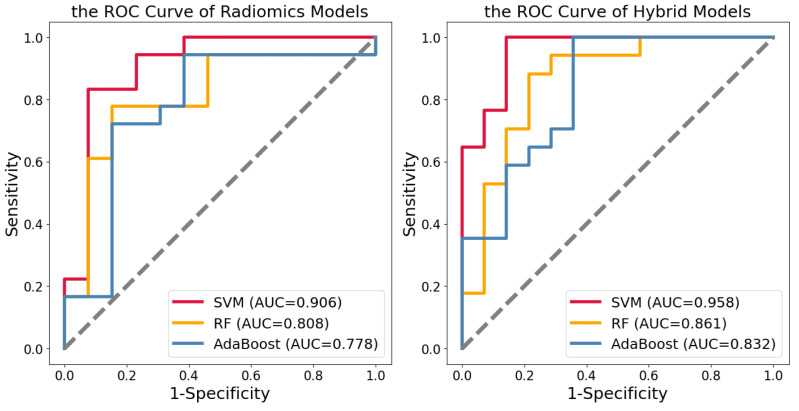
Results: We selected 33 out of 6138 radiomics features. In the testing set of the radiomics model, the AUC values of the SVM, RF, and AdaBoost classifiers were 0.905, 0.808, and 0.778, respectively, and the accuracies were 0.839, 0.742, and 0.710. The hybrid models had better prediction performance. In the testing set, the AUC values of SVM, RF, and AdaBoost classifiers were 0.958, 0.861, and 0.832, respectively, and the accuracies were 0.903, 0.806, and 0.774.
Conclusions: Our results indicate that T1-weighted MRI is valuable in predicting early LID in PD. This work demonstrates that the combination of radiomics features and clinical features has good potential and value for identifying early LID in PD.
Keywords: Parkinson’s disease; dyskinesias; levodopa; machine learning; magnetic resonance imaging.
Conflict of interest statement
The authors declare no conflict of interest.
Figures
References
Grants and funding
LinkOut - more resources
Full Text Sources
