. 2023 Jul 26;24(15):12008.
doi: 10.3390/ijms241512008.

Protective Effects of 3'-Epilutein and 3'-Oxolutein against Glutamate-Induced Neuronal Damage

Affiliations

Protective Effects of 3'-Epilutein and 3'-Oxolutein against Glutamate-Induced Neuronal Damage

Ramóna Pap et al. Int J Mol Sci. .

Abstract

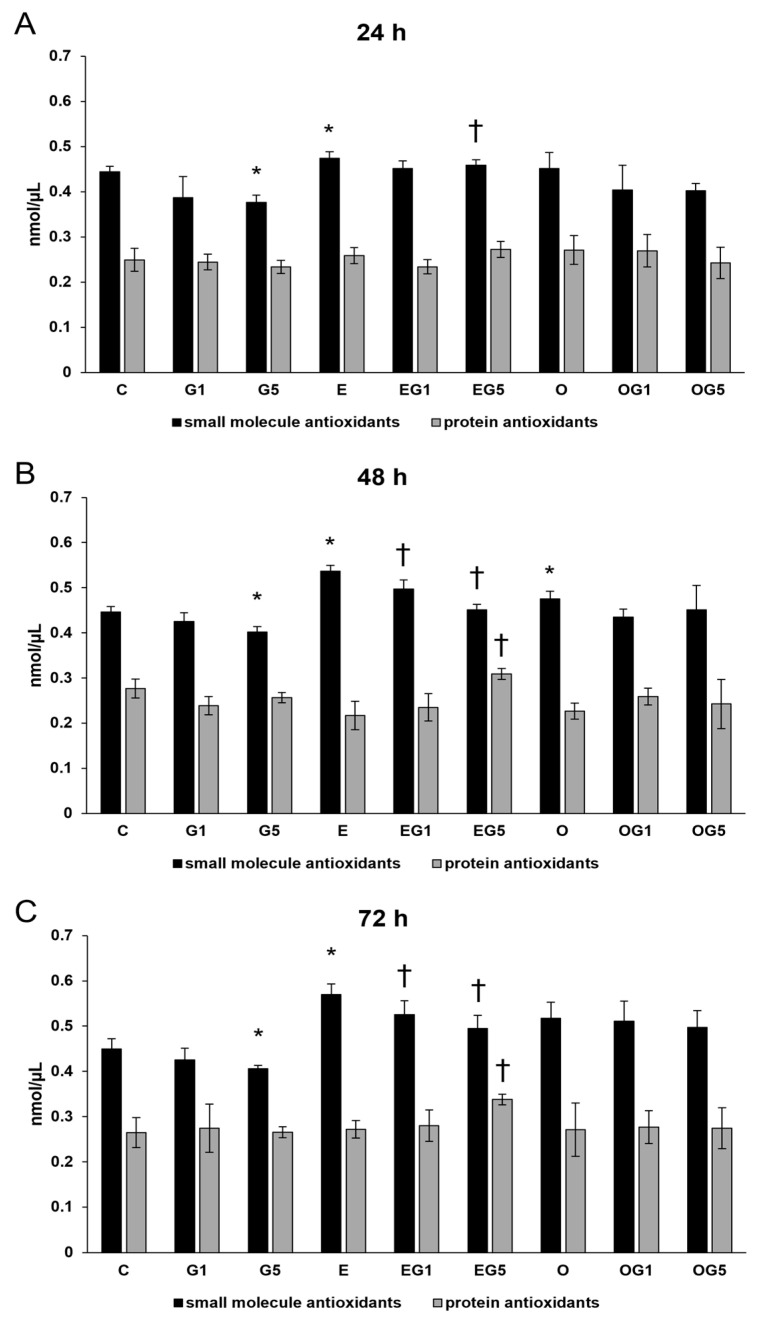
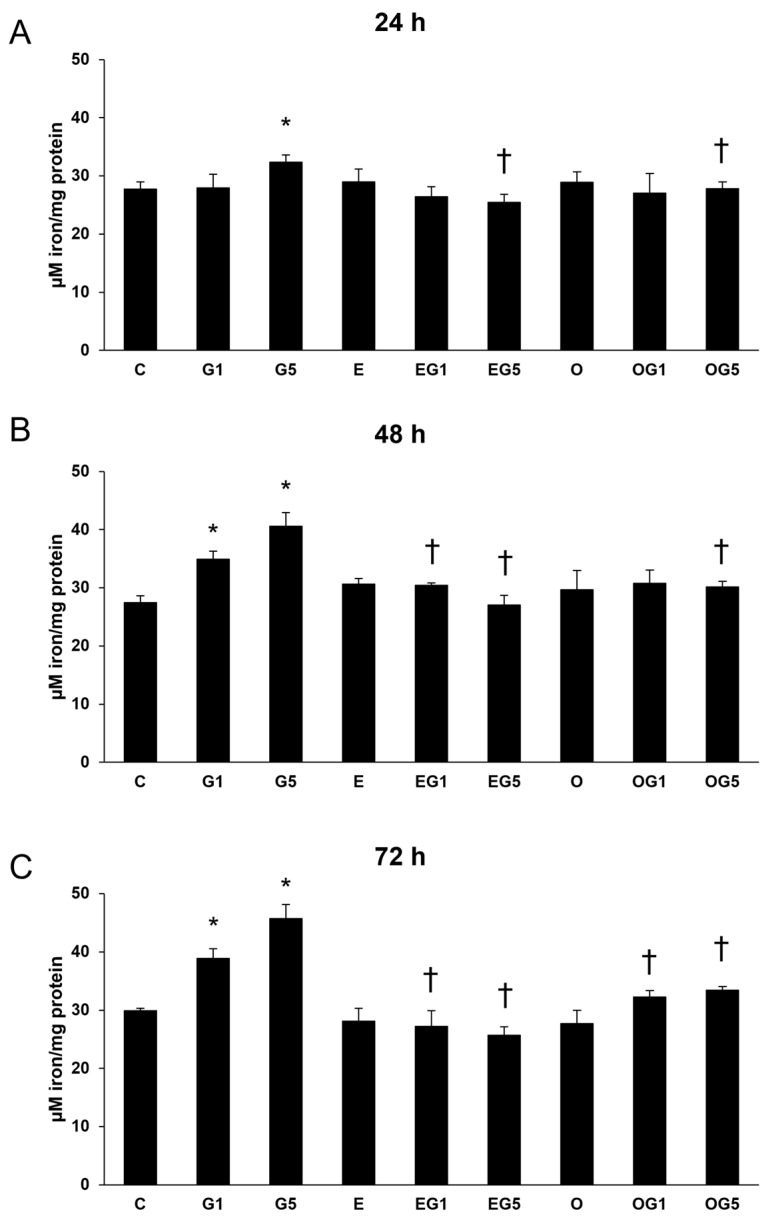
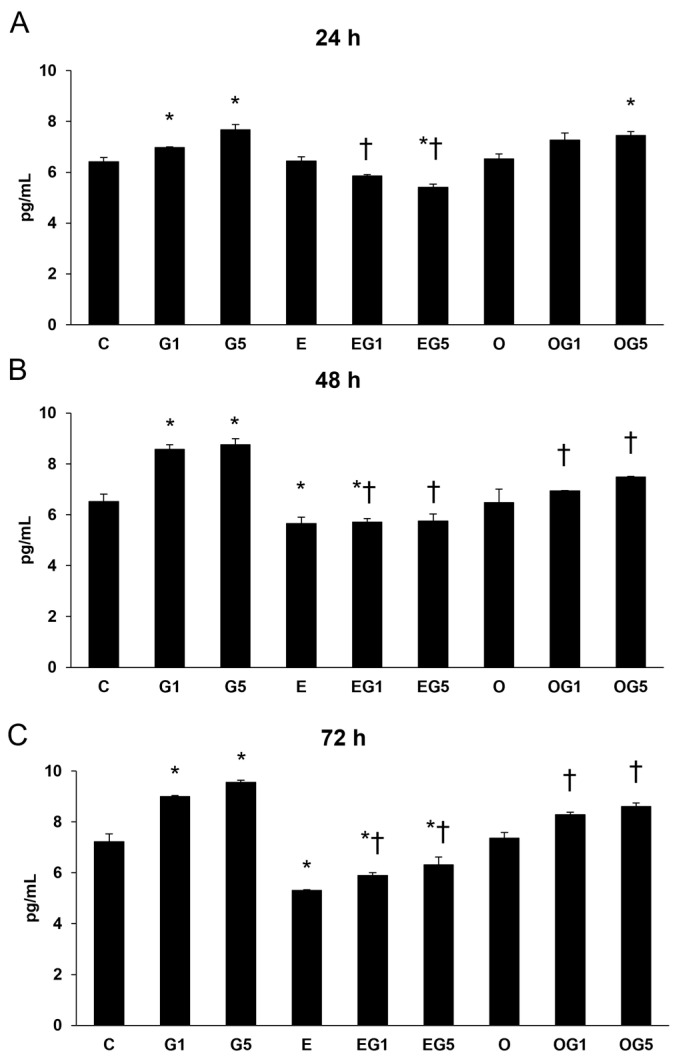
Dietary lutein can be naturally metabolized to 3'-epilutein and 3'-oxolutein in the human body. The epimerization of lutein can happen in acidic pH, and through cooking, 3'-epilutein can be the product of the direct oxidation of lutein in the retina, which is also present in human serum. The 3'-oxolutein is the main oxidation product of lutein. Thus, the allylic oxidation of dietary lutein can result in the formation of 3'-oxolutein, which may undergo reduction either to revert to dietary lutein or epimerize to form 3'-epilutein. We focused on the effects of 3'-epilutein and 3'-oxolutein itself and on glutamate-induced neurotoxicity on SH-SY5Y human neuroblastoma cells to identify the possible alterations in oxidative stress, inflammation, antioxidant capacity, and iron metabolism that affect neurological function. ROS measurements were performed in the differently treated cells. The inflammatory state of cells was followed by TNFα, IL-6, and IL-8 cytokine ELISA measurements. The antioxidant status of the cells was determined by the total antioxidant capacity kit assay. The alterations of genes related to ferroptosis and lipid peroxidation were followed by gene expression measurements; then, thiol measurements were performed. Lutein metabolites 3'-epilutein and 3'-oxolutein differently modulated the effect of glutamate on ROS, inflammation, ferroptosis-related iron metabolism, and lipid peroxidation in SH-SY5Y cells. Our results revealed the antioxidant and anti-inflammatory features of 3'-epilutein and 3'-oxolutein as possible protective agents against glutamate-induced oxidative stress in SH-SY5Y cells, with greater efficacy in the case of 3'-epilutein.

Keywords: 3′-epilutein; 3′-oxolutein; glutamate; neuron; oxidative stress.


Conflict of interest statement

The authors declare no conflict of interest.

Figures

Figure 1
Figure 1
Reactive oxygen species (ROS) detection after 3′-epilutein and 3′-oxolutein and glutamate treatments in SH-SY5Y cells at 10 min (A), at 20 min (B), and at 30 min (C). The changes in ROS were determined as a percentage of control. The bars represent the mean values (±SD) of three independent experiments (n = 3), each performed in quadruplicate, and are presented relative to their control cells. For better transparency, the measured ROS of DMSO controls is not presented. The asterisk signs the statistical significance of glutamate treatments compared to control; cross marks the statistical significance of combined (e.g., 3′-epilutein with glutamate) treatments compared to glutamate treatments at 10 min, 20 min, or 30 min (p < 0.05). Abbreviations: C—control; G1—1 mM glutamate; G5—5 mM glutamate; E—3′-epilutein; O—3′-oxolutein; EG1—3′-epilutein + 1 mM glutamate; EG5—3′-epilutein + 5 mM glutamate; OG1—3′-oxolutein + 1 mM glutamate; OG5—3′-oxolutein + 5 mM glutamate; OD—optical density.
Figure 2
Figure 2
Total antioxidant capacity (TAC) determinations after 3′-epilutein and 3′-oxolutein and glutamate treatments in SH-SY5Y cells at 24 h (A), at 48 h (B), and at 72 h (C). The columns represent the mean values in nmol/µL, and error bars indicate the standard deviation (SD) of three independent experiments (n = 3), each performed in quadruplicate, and are presented relative to their own control cells. Asterisk indicates the statistical significance of glutamate-treated cells compared to controls at 24 h, 48 h, and 72 h; cross marks the statistical significance of combined (e.g., 3′-epilutein with glutamate) treatments compared to glutamate treatments at 24 h, 48 h, and 72 h; the level of significance was p < 0.05. Abbreviations: C—control; G1—1 mM glutamate; G5—5 mM glutamate; E—3′-epilutein; O—3′-oxolutein; EG1—3′-epilutein + 1 mM glutamate; EG5—3′-epilutein + 5 mM glutamate; OG1—3′-oxolutein + 1 mM glutamate; OG5—3′-oxolutein + 5 mM glutamate.
Figure 3
Figure 3
Determination of the effects of 3′-epilutein and 3′-oxolutein on SOD activity of the SH-SY5Y cells at 24 h (A), at 48 h (B), and at 72 h (C). The result was expressed as U/mL. The bars represent the mean values (±SD) of three independent experiments (n = 3) performed in triplicate and are presented relative to their control cells. Asterisk marks the statistical significance of glutamate treatments compared to control, cross represents the statistical significance of combined (e.g., 3′-epilutein + glutamate) treatments compared to the glutamate treatments at 24 h, 48 h, and 72 h (p < 0.05). Abbreviations: C—control; G1—1 mM glutamate; G5—5 mM glutamate; E—3′-epilutein; O—3′-oxolutein; EG1—3′-epilutein + 1 mM glutamate; EG5—3′-epilutein + 5 mM glutamate; OG1—3′-oxolutein + 1 mM glutamate; OG5—3′-oxolutein + 5 mM glutamate.
Figure 4
Figure 4
Relative mRNA expression of TfR1, FTH, FPN, and HO-1 in 3′-epilutein and 3′-oxolutein and glutamate-treated SH-SY5Y cells at 24 h (A), at 48 h (B), and at 72 h (C). The relative expression of controls was regarded as 1 and is not indicated on the column diagrams. The bars represent the mean values (±SD) of three independent experiments (n = 3) performed in triplicate and are presented relative to their control cells. Asterisk marks the statistical significance of glutamate treatments compared to control, cross represents the statistical significance of combined (e.g., 3′-epilutein + glutamate) treatments compared to the glutamate treatments at 24 h, 48 h, and 72 h (p < 0.05). Abbreviations: G1—1 mM glutamate; G5—5 mM glutamate; E—3′-epilutein; O—3′-oxolutein; EG1—3′-epilutein + 1 mM glutamate; EG5—3′-epilutein + 5 mM glutamate; OG1—3′-oxolutein + 1 mM glutamate; OG5—3′-oxolutein + 5 mM glutamate.
Figure 5
Figure 5
Determinations of iron content in 3′-epilutein and 3′-oxolutein and glutamate-treated SH-SY5Y cells at 24 h (A), at 48 h (B), and at 72 h (C). The results of iron levels were normalized against the protein concentration and were expressed as µM iron/mg protein. The bars represent the mean values (±SD) of three independent experiments (n = 3) performed in triplicate and are presented relative to their control cells. Asterisk represents the statistical significance of glutamate treatments compared to control; cross signs the statistical significance of combined (e.g., 3′-epilutein + glutamate) treatments compared to the glutamate treatments at 24 h, 48 h, and 72 h (p < 0.05). Abbreviations: C—control; G1—1 mM glutamate; G5—5 mM glutamate; E—3′-epilutein; O—3′-oxolutein; EG1—3′-epilutein + 1 mM glutamate; EG5—3′-epilutein + 5 mM glutamate; OG1—3′-oxolutein + 1 mM glutamate; OG5—3′-oxolutein + 5 mM glutamate.
Figure 6
Figure 6
Relative mRNA expression of ALOX5, ALOX15, and ACSL4 in 3′-epilutein and 3′-oxolutein and glutamate-treated SH-SY5Y cells. The relative expression of controls was regarded as 1 and is not indicated on the column diagrams. The bars represent the mean values (±SD) of three independent experiments (n = 3) performed in triplicate and are presented relative to their control cells. Asterisk signs the statistical significance of glutamate treatments compared to control; cross marks the statistical significance of combined (e.g., 3′-epilutein + glutamate) treatments compared to the glutamate treatments at 24 h, 48 h, and 72 h (p < 0.05). Abbreviations: G1—1 mM glutamate; G5—5 mM glutamate; E—3′-epilutein; O—3′-oxolutein; EG1—3′-epilutein + 1 mM glutamate; EG5—3′-epilutein + 5 mM glutamate; OG1—3′-oxolutein + 1 mM glutamate; OG5—3′-oxolutein + 5 mM glutamate.
Figure 7
Figure 7
Thiol determinations after 3′-epilutein and 3′-oxolutein and glutamate treatments in SH-SY5Y cells at 24 h (A), at 48 h (B), and at 72 h (C). The columns represent the mean values in µM, and error bars indicate the standard deviation (±SD) of three independent experiments (n = 3), each performed in quadruplicate, and are presented relative to own control cells. Asterisk shows the statistical significance of glutamate-treated cells compared to controls at 24 h, 48 h, and 72 h; cross signs statistical significance of combined (e.g., 3′-epilutein with glutamate) treatments compared to glutamate treatments at 24 h, 48 h, and 72 h; the level of significance was p < 0.05. Abbreviations: C—control; G1—1 mM glutamate; G5—5 mM glutamate; E—3′-epilutein; O—3′-oxolutein; EG1—3′-epilutein + 1 mM glutamate; EG5—3′-epilutein + 5 mM glutamate; OG1—3′-oxolutein + 1 mM glutamate; OG5—3′-oxolutein + 5 mM glutamate.
Figure 8
Figure 8
Determination of proinflammatory IL-6 secretion after 3′-epilutein, 3′-oxolutein, and glutamate treatments of the SH-SY5Y cells at 24 h (A), at 48 h (B), and at 72 h (C). The columns represent the mean values expressed in pg/mL concentration, and error bars indicate the standard deviation (±SD) of three independent experiments (n = 3), each performed in quadruplicate, and are presented relative to own control cells. Asterisk shows the statistical significance of glutamate-treated cells compared to controls at 24 h, 48 h, and 72 h; cross signs statistical significance of combined (e.g., 3′-epilutein with glutamate) treatments compared to glutamate treatments at 24 h, 48 h, and 72 h; the level of significance was p < 0.05. Abbreviations: C—control; G1—1 mM glutamate; G5—5 mM glutamate; E—3′-epilutein; O—3′-oxolutein; EG1—3′-epilutein + 1 mM glutamate; EG5—3′-epilutein + 5 mM glutamate; OG1—3′-oxolutein + 1 mM glutamate; OG5—3′-oxolutein + 5 mM glutamate.
Figure 9
Figure 9
Determination of proinflammatory IL-8 secretion after 3′-epilutein, 3′-oxolutein, and glutamate treatments of the SH-SY5Y cells at 24 h (A), at 48 h (B), and at 72 h (C). The columns represent the mean values expressed in pg/mL concentration. Error bars indicate the standard deviation (±SD) of three independent experiments (n = 3), each performed in quadruplicate, and are presented relative to own control cells. Asterisk marks the statistical significance of glutamate-treated cells compared to controls at 24 h, 48 h, and 72 h; cross signs statistical significance of combined (e.g., 3′-epilutein with glutamate) treatments compared to glutamate treatments at 24 h, 48 h, and 72 h; the level of significance was p < 0.05. Abbreviations: C—control; G1—1 mM glutamate; G5—5 mM glutamate; E—3′-epilutein; O—3′-oxolutein; EG1—3′-epilutein + 1 mM glutamate; EG5—3′-epilutein + 5 mM glutamate; OG1—3′-oxolutein + 1 mM glutamate; OG5—3′-oxolutein + 5 mM glutamate.
Figure 10
Figure 10
Determination of TNFα secretion after 3′-epilutein, 3′-oxolutein, and glutamate treatments of the SH-SY5Y cells at 24 h (A), at 48 h (B), and at 72 h (C). The columns represent the mean values expressed in pg/mL concentration, and error bars indicate the standard deviation (±SD) of three independent experiments (n = 3), each performed in quadruplicate, and are presented relative to own control cells. Asterisk signs statistical significance of glutamate-treated cells compared to controls at 24 h, 48 h, and 72 h, cross represents the statistical significance of combined (e.g., 3′-epilutein with glutamate) treatments compared to glutamate treatments at 24 h, 48 h, and 72 h; the level of significance was p < 0.05. Abbreviations: C—control; G1—1 mM glutamate; G5—5 mM glutamate; E—3′-epilutein; O—3′-oxolutein; EG1—3′-epilutein + 1 mM glutamate; EG5—3′-epilutein + 5 mM glutamate; OG1—3′-oxolutein + 1 mM glutamate; OG5—3′-oxolutein + 5 mM glutamate.

Similar articles

Cited by

References

    1. Chen X., Guo C., Kong J. Oxidative stress in neurodegenerative diseases. Neural Regen. Res. 2012;7:376–385. doi: 10.1146/annurev.pharmtox.36.1.83. - DOI - PMC - PubMed
    1. Teleanu D.M., Niculescu A.G., Lungu I.I., Radu C.I., Vladâcenco O., Roza E., Costăchescu B., Grumezescu A.M., Teleanu R.I. An Overview of Oxidative Stress, Neuroinflammation and Neurodegenerative Diseases. Int. J. Mol. Sci. 2022;23:5938. doi: 10.3390/ijms23115938. - DOI - PMC - PubMed
    1. Milani A., Basirnejad M., Shahbazi S., Bolhassani A. Carotenoids: Biochemistry, pharmacology and treatment. Br. J. Pharmacol. 2017;174:1290–1324. doi: 10.1111/bph.13625. - DOI - PMC - PubMed
    1. Saini R.K., Prasad P., Lokesh V., Shang X., Shin J., Keum Y.S., Lee J.H. Carotenoids: Dietary Sources, Extraction, Encapsulation, Bioavailability, and Health Benefits—A Review of Recent Advancements. Antioxidants. 2022;11:795. doi: 10.3390/antiox11040795. - DOI - PMC - PubMed
    1. Park H.A., Hayden M.M., Bannerman S., Jansen J., Crowe-White K.M. Anti-apoptotic effects of carotenoids in neurodegeneration. Molecules. 2020;25:3453. doi: 10.3390/molecules25153453. - DOI - PMC - PubMed