. 2023 Jul 27;24(15):12058.
doi: 10.3390/ijms241512058.

SARS-CoV-2 Spike Protein Interaction Space

Affiliations

SARS-CoV-2 Spike Protein Interaction Space

Claudiu N Lungu et al. Int J Mol Sci. .

Abstract

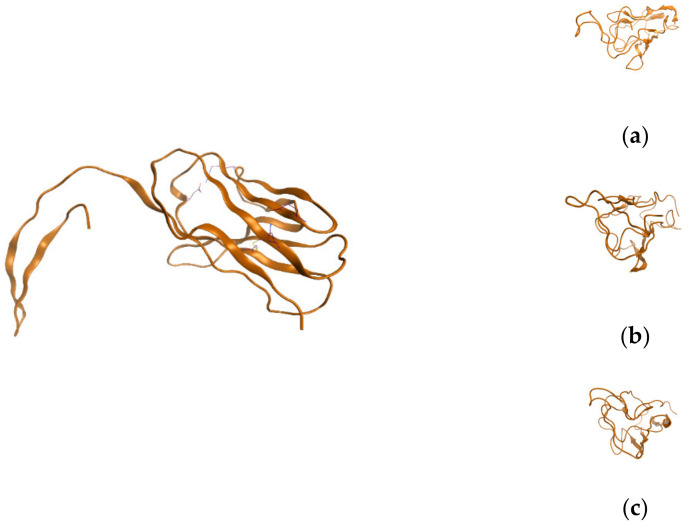
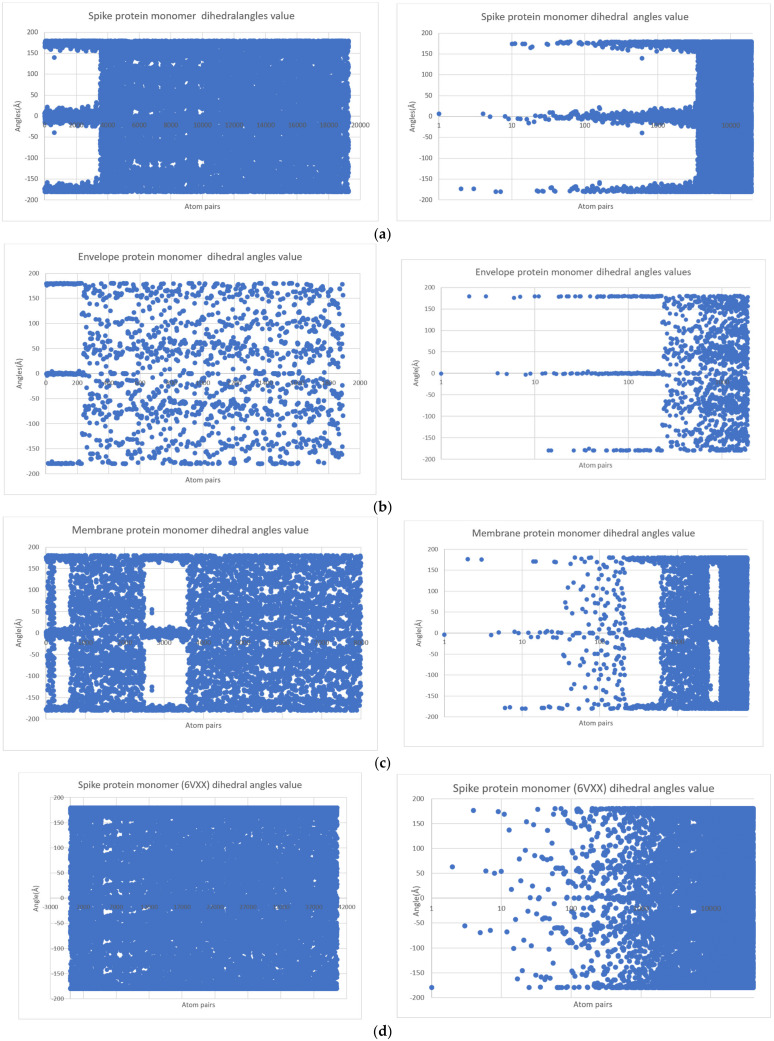
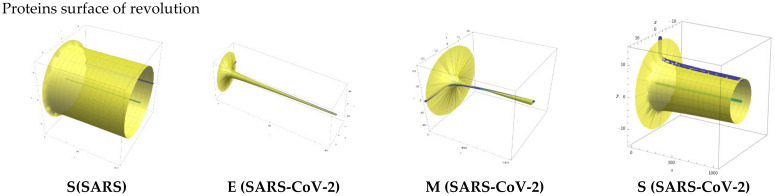
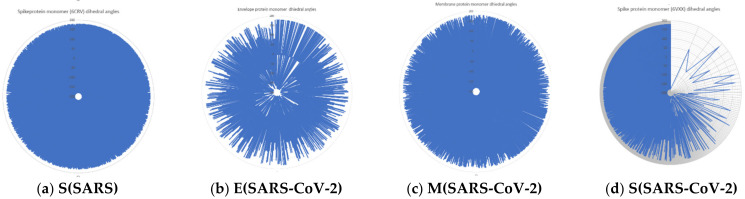
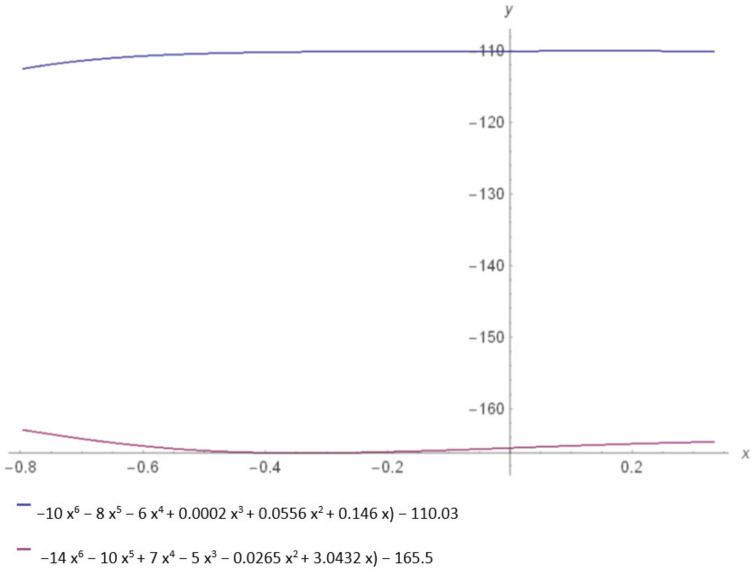
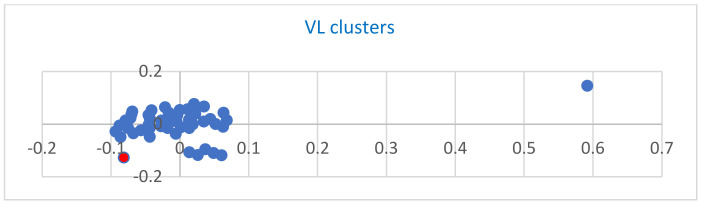
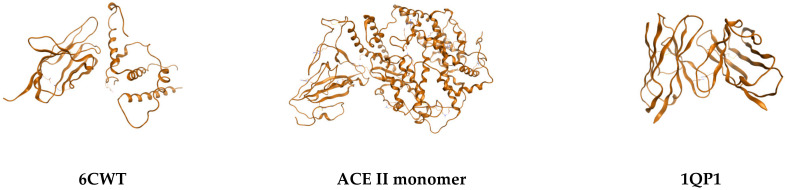
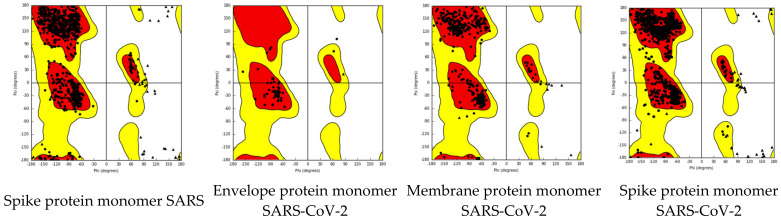
Severe acute respiratory syndrome coronavirus 2 (SARS-CoV-2) is a +sense single-strand RNA virus. The virus has four major surface proteins: spike (S), envelope (E), membrane (M), and nucleocapsid (N), respectively. The constitutive proteins present a high grade of symmetry. Identifying a binding site is difficult. The virion is approximately 50-200 nm in diameter. Angiotensin-converting enzyme 2 (ACE2) acts as the cell receptor for the virus. SARS-CoV-2 has an increased affinity to human ACE2 compared with the original SAR strain. Topological space, and its symmetry, is a critical component in molecular interactions. By exploring this space, a suitable ligand space can be characterized accordingly. A spike protein (S) computational model in a complex with ACE 2 was generated using silica methods. Topological spaces were probed using high computational throughput screening techniques to identify and characterize the topological space of both SARS and SARS-CoV-2 spike protein and its ligand space. In order to identify the symmetry clusters, computational analysis techniques, together with statistical analysis, were utilized. The computations are based on crystallographic protein data bank PDB-based models of constitutive proteins. Cartesian coordinates of component atoms and some cluster maps were generated and analyzed. Dihedral angles were used in order to compute a topological receptor space. This computational study uses a multimodal representation of spike protein interactions with some fragment proteins. The chemical space of the receptors (a dimensional volume) suggests the relevance of the receptor as a drug target. The spike protein S of SARS and SARS-CoV-2 is analyzed and compared. The results suggest a mirror symmetry of SARS and SARS-CoV-2 spike proteins. The results show thatSARS-CoV-2 space is variable and has a distinct topology. In conclusion, surface proteins grant virion variability and symmetry in interactions with a potential complementary target (protein, antibody, ligand). The mirror symmetry of dihedral angle clusters determines a high specificity of the receptor space.

Keywords: COVID-19; QSAR; SARS-CoV-2; antibody; antibody binding; chemical space; paratope; spike protein.


Conflict of interest statement

The authors declare no conflict of interest.

Figures

Figure 1
Figure 1
(A) I-Frag interaction map between ACEII monomer and spike protein monomer (6VXX) based on I-Frag interaction scores; (B) Radar plot based on I-Frag interaction scores between ACE II monomer and 6VXX monomer; (C,D) 6VXX sequence1A. I-Frag interaction map between 6VXX monomer and Aa based on I-Frag interaction scores; (D). Radar plot based on I-Frag interaction scores between 6VXX monomer and sequence1; (E) 6CVR sequence1 Frag interaction map between 6CVR monomer and sequence1 based on I frag interaction scores; (F). Radar plot based on I-Frag interaction scores between 6CVR monomer and sequence1; (G) I-Frag interaction map between 6VXX monomer and 6VXX based on I frag interaction scores; (H) Radar plot based on I-Frag interaction scores between 6VXX monomer and 6VXX monomer 6VXX monomer.
Figure 1
Figure 1
(A) I-Frag interaction map between ACEII monomer and spike protein monomer (6VXX) based on I-Frag interaction scores; (B) Radar plot based on I-Frag interaction scores between ACE II monomer and 6VXX monomer; (C,D) 6VXX sequence1A. I-Frag interaction map between 6VXX monomer and Aa based on I-Frag interaction scores; (D). Radar plot based on I-Frag interaction scores between 6VXX monomer and sequence1; (E) 6CVR sequence1 Frag interaction map between 6CVR monomer and sequence1 based on I frag interaction scores; (F). Radar plot based on I-Frag interaction scores between 6CVR monomer and sequence1; (G) I-Frag interaction map between 6VXX monomer and 6VXX based on I frag interaction scores; (H) Radar plot based on I-Frag interaction scores between 6VXX monomer and 6VXX monomer 6VXX monomer.
Figure 2
Figure 2
Scatter plots representing: (a) I Frag score results from interaction between the ACEII monomer and 6VXX monomer, characterized by 678,370 interaction pairs between one Aa; from 6VXX and one Aa; from ACE II (OX axes). The I Frag score corresponding to each pair of Aa is represented on oy axes. A logarithmic trendline (dash points) is also drawn. (b) 6VXX interaction with sequence1 is characterized by almost 7000 Aa pairs interacting (OX axes). The I Frag score corresponding to each pair of Aa is represented on OY axes. A logarithmic trendline (dash points) is also drawn (I Frag scores values significative of stronger interactions). (c) Aa sequence (epitope) interaction with 6CVR. (d) Spike protein interaction with itself.
Figure 2
Figure 2
Scatter plots representing: (a) I Frag score results from interaction between the ACEII monomer and 6VXX monomer, characterized by 678,370 interaction pairs between one Aa; from 6VXX and one Aa; from ACE II (OX axes). The I Frag score corresponding to each pair of Aa is represented on oy axes. A logarithmic trendline (dash points) is also drawn. (b) 6VXX interaction with sequence1 is characterized by almost 7000 Aa pairs interacting (OX axes). The I Frag score corresponding to each pair of Aa is represented on OY axes. A logarithmic trendline (dash points) is also drawn (I Frag scores values significative of stronger interactions). (c) Aa sequence (epitope) interaction with 6CVR. (d) Spike protein interaction with itself.
Figure 3
Figure 3
Homology model of the sequence, together with three favorable structural conformations: (ac).
Figure 4
Figure 4
Dihedral angles of surface protein monomers. On the right, dihedral angles are represented after the log representation of the ox axis. (a) Spike protein monomer of SARS dihedral angle population; (b) envelope protein monomer of dihedral angle population of SARS-CoV-2; (c) membrane protein monomer of dihedral angle population of SARS-CoV-2; (d) spike protein monomer of dihedral angle population of SARS-CoV-2.
Figure 5
Figure 5
Protein monomers surface of revolution. The surface of resolution is generated using the logarithmic trendline dihedral angles equation. The axis of revolution is represented in green. The generator (dihedral angle trendline equation) is represented in blue (see also Supplementary Materials File S2).
Figure 6
Figure 6
Radar plots of proteins monomers dihedral angles population (see also Supplementary Materials File S3).
Figure 7
Figure 7
Spike protein energetically allowed regions represented by blue spike protein SARS and pink spike proteins SARS-CoV-2.
Figure 8
Figure 8
VL cluster. Two major groups of clusters are observed: a major group composed of VL: 2, 3, 4, 5, 6, 8, 10, 11, 12, 13, 14, 15, 16, 17, 18, 19, 20, 21, 22, 25, 26, 27, 28, 29, 30, 31, 32, 33, 34, 36, 37, 38, 39, 40, 41, 41, 43, 44, 46, 47; a small one composed of VL 7, 9, 23, 25, 45 and two single clusters 1 and 35.
Figure 9
Figure 9
Most favorable interaction of fragment 47 (6CWT), represented with ACE II monomer and anther VL fragment 26with a polynomial discriminant value of 347,490 to demonstrate the specificity of VL—spike protein interaction and the lack of mass effect in this computational study.
Figure 10
Figure 10
Ramachandran plots of viral proteins monomers. The spike protein of SARSA and SARS-CoV-2 have similar allowed regions. Antiparallel ß sheets, right-handed ἀ helix, and collagen triple helix are dominant in spike protein for both SARS and SARS-CoV-2.
Figure 11
Figure 11
Property space of spike protein of SARS and SARS-CoV-2. Spike property space of SARS-CoV-2.

Similar articles

References

    1. Bakhiet M., Taurin S. SARS-CoV-2: Targeted managements and vaccine development. Cytokine Growth Factor Rev. 2021;58:16–29. doi: 10.1016/j.cytogfr.2020.11.001. - DOI - PMC - PubMed
    1. De Oliveira Campos D.M., Fulco U.L., de Oliveira C.B.S., Oliveira J.I.N. SARS-CoV-2 virus infection: Targets and antiviral pharmacological strategies. J. Evid. Based Med. 2020;13:255–260. doi: 10.1111/jebm.12414. - DOI - PMC - PubMed
    1. Walls A.C., Park Y.J., Tortorici M.A., Wall A., McGuire A.T., Veesler D. Structure, Function, and Antigenicity of the SARS-CoV-2 Spike Glycoprotein. Cell. 2020;181:281. doi: 10.1016/j.cell.2020.02.058. - DOI - PMC - PubMed
    1. Awadasseid A., Wu Y., Tanaka Y., Zhang W. SARS-CoV-2 variants evolved during the early stage of the pandemic and the effects of mutations on adaptation in Wuhan populations. Int. J. Biol. Sci. 2021;17:97–106. doi: 10.7150/ijbs.47827. - DOI - PMC - PubMed
    1. Sternberg A., Naujokat C. Structural features of coronavirus SARS-CoV-2 spike protein: Targets for vaccination. Life Sci. 2020;257:118056. doi: 10.1016/j.lfs.2020.118056. - DOI - PMC - PubMed