. 2023 Jul 28;24(15):12137.
doi: 10.3390/ijms241512137.

Influence of a Single Deuterium Substitution for Protium on the Frequency Generation of Different-Size Bubbles in IFNA17

Affiliations

Influence of a Single Deuterium Substitution for Protium on the Frequency Generation of Different-Size Bubbles in IFNA17

Alexandr Basov et al. Int J Mol Sci. .

Abstract

The influence of a single 2H/1H replacement on the frequency generation of different-size bubbles in the human interferon alpha-17 gene (IFNA17) under various energies was studied by a developed algorithm and mathematical modeling without simplifications or averaging. This new approach showed the efficacy of researching DNA bubbles and open states both when all hydrogen bonds in nitrogenous base pairs are protium and after an 2H-substitution. After a single deuterium substitution under specific energies, it was demonstrated that the non-coding region of IFNA17 had a more significant regulatory role in bubble generation in the whole gene than the promoter had. It was revealed that a single deuterium substitution for protium has an influence on the frequency generation of DNA bubbles, which also depends on their size and is always higher for the smaller bubbles under the largest number of the studied energies. Wherein, compared to the natural condition under the same critical value of energy, the bigger raises of the bubble frequency occurrence (maximums) were found for 11-30 base pair (bp) bubbles (higher by 319%), 2-4 bp bubbles (higher by 300%), and 31 bp and over ones (higher by 220%); whereas the most significant reductions of the indicators (minimums) were observed for 11-30 bp bubbles (lower by 43%) and bubbles size over 30 bp (lower by 82%). In this study, we also analyzed the impact of several circumstances on the AT/GC ratio in the formation of DNA bubbles, both under natural conditions and after a single hydrogen isotope exchange. Moreover, based on the obtained data, substantial positive and inverse correlations were revealed between the AT/GC ratio and some factors (energy values, size of DNA bubbles). So, this modeling and variant of the modified algorithm, adapted for researching DNA bubbles, can be useful to study the regulation of replication and transcription in the genes under different isotopic substitutions in the nucleobases.

Keywords: DNA; DNA bubbles; deuterium; dynamics of a double-stranded DNA molecule; interferon alpha-17 gene; open states; rotational movements of nitrogenous bases.


Conflict of interest statement

The authors declare no conflict of interest.

Figures

Figure 6
Figure 6
A–T/G–C ratio of the OS and different DNA bubbles after a single 2H/1H replacement throughout 0.250–0.600 energy diapason in IFNA17. Note: Energy = x × 1022, Nm (where x can be 0.250, 0.300, 0.350, 0.400, 0.450, 0.500, 0.550, or 0.600), each dot is the median, each upper cross dash is the 75th percentile, and each lower cross dash is the 25th percentile.
Figure 1
Figure 1
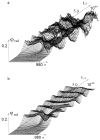
Graphs of angular deviations of the 1-st chain nitrogenous bases of IFNA17 over a period of time: [0, t = 5.0 × 10⁻¹⁰ s], under Ecr equals 0.250·10−22 N·m (a) and Ecr equals 0.600·10−22 N·m (b).
Figure 2
Figure 2
Dynamics of the different-size DNA bubble occurrence ((a) 2–4 bps, (b) 5–10 bps, (c) 11–30 bps, (d) over 30 bps) in the gene encoding interferon alpha 17 under natural conditions and after a single 2H/1H replacement (with gradation of the bubble occurrence frequency by modified BJ algorithm). Note: for each energy, the 1st (highest) cross dash is Pimax, the 2nd cross dash is the bottom of the range “Maximum”, the 3rd cross dash is the top of the range “Minimum”, and the 4th cross dash is Pimin; the red line is the DNA bubble occurrence frequency under the condition that all hydrogen bonds in IFNA17 are 1H (P0), bps are nitrogenous base pairs.
Figure 3
Figure 3
Dynamics of the open state (OS) occurrence in the gene encoding interferon alpha 17 under natural conditions and after a single 2H/1H replacement (with gradation of the OS occurrence frequency by the modified BJ algorithm). Note, for each energy: the 1st (highest) cross dash is Pimax, the 2nd cross dash is the bottom of the range “Maximum”, the 3rd cross dash is the top of the range “Minimum”, and the 4th cross dash is Pimin; the red line is the OS occurrence frequency under the condition that all hydrogen bonds in IFNA17 are 1H (P0).
Figure 4
Figure 4
Distribution of nucleobase pairs in the three parts of IFNA17 leading, after a single 2H/1H replacement, to extreme frequencies of different-size DNA bubble occurrences ((a) 2–4 bps, (b) 5–10 bps, (c) 11–30 bps, (d) over 30 bps). Note: the red dot is the location of the deuterium atom in the gene, which leads to the maximum probability of DNA bubble occurrence (“Maximum” range); the green dot is the location of the deuterium atom in the gene, which leads to the minimum probability of DNA bubble occurrence (“Minimum” range, Pi > 0.0); and the dark-blue dot is the location of the deuterium atom in the gene, which leads to the probability of 0.0 for a DNA bubble occurrence (close states, Pi = 0.0).
Figure 5
Figure 5
Distribution of nucleobase pairs in the three parts of IFNA17, leading after a single 2H/1H replacement, to the extreme frequencies of OS occurrences (1 bps). Note: the red dot is the location of the deuterium atom in the gene, which leads to the maximum probability of OS occurrence (“Maximum” range); the green dot is the location of the deuterium atom in the gene, which leads to the minimum probability of OS occurrence (“Minimum” range, Pi > 0.0); and the dark-blue dot is the location of the deuterium atom in the gene, which leads to the probability of 0.0 for an OS occurrence (close states, Pi = 0.0).
Figure 7
Figure 7
A–T fractions of the different DNA bubbles and OS after a single 2H/1H isotopic substitution throughout the 0.250–0.450 energy range in IFNA17. Note: 1, 6 and 11 are OS; 2, 7 and 12 are bubble group 1; 3, 8 and 13 are bubble group 2; 4, 9 and 14 are bubble group 3; 5, 10 and 15 are bubble group 4; 6–10 were generated by nucleobases from the “Maximum” range; 11–15 were generated by nucleobases from the “Minimum” range; and 1–5 were generated by nucleobases located out of both the “Maximum” and “Minimum” ranges.

Similar articles

References

    1. Metzler R., Ambjörnsson T., Hanke A., Fogedby H.C. Single DNA denaturation and bubble dynamics. J. Phys. Condens. Matter. 2009;21:034111. doi: 10.1088/0953-8984/21/3/034111. - DOI - PubMed
    1. Dzhimak S., Svidlov A., Elkina A., Gerasimenko E., Baryshev M., Drobotenko M. Genesis of Open States Zones in a DNA Molecule Depends on the Localization and Value of the Torque. Int. J. Mol. Sci. 2022;23:4428. doi: 10.3390/ijms23084428. - DOI - PMC - PubMed
    1. Altan-Bonnet G., Libchaber A., Krichevsky O. Bubble dynamics in double-stranded DNA. Phys. Rev. Lett. 2003;90:138101. doi: 10.1103/PhysRevLett.90.138101. - DOI - PubMed
    1. Alexandrov B.S., Wille L.T., Rasmussen K.Ø., Bishop A.R., Blagoev K.B. Bubble statistics and dynamics in double-stranded DNA. Phys. Rev. E. 2006;74:050901. doi: 10.1103/PhysRevE.74.050901. - DOI - PubMed
    1. Clark D.P., Pazdernik N.J., McGehee M.R. Molecular Biology. 3rd ed. Elsevier B.V.; Amsterdam, The Netherlands: 2019. Chapter 11—Transcription of Genes; pp. 332–361. - DOI

LinkOut - more resources