. 2023 Jul 29;24(15):12168.
doi: 10.3390/ijms241512168.

ω-3 Polyunsaturated Fatty Acids Improve the Blood-Brain-Barrier Integrity in Contrast-Induced Blood-Brain-Barrier Injury in Uremic Mice

Affiliations

ω-3 Polyunsaturated Fatty Acids Improve the Blood-Brain-Barrier Integrity in Contrast-Induced Blood-Brain-Barrier Injury in Uremic Mice

Jin Ah Shin et al. Int J Mol Sci. .

Abstract

In patients with chronic kidney disease, the need for examinations using contrast media (CM) increases because of underlying diseases. Although contrast agents can affect brain cells, the blood-brain barrier (BBB) protects against brain-cell damage in vivo. However, uremia can disrupt the BBB, increasing the possibility of contrast-agent-induced brain-cell damage in patients with chronic kidney disease (CKD). ω-3 polyunsaturated fatty acids (PUFAs) have shown protective effects on various neurological disorders, including uremic brain injury. This study examined whether ω-3 PUFAs attenuate damage to the BBB caused by uremia and contrast agents in a uremic mouse model and evaluated its associated mechanisms. C57BL/6 mice (eight weeks old, male) and fat-1 mice (b6 background/eight weeks old, male) were divided into groups according to uremic induction, CM, and ω-3 PUFA administration. Uremia was induced via 24 h ischemia-reperfusion (IR) renal injury. One day after CM treatment, the brain tissue, kidney tissue, and blood were collected. The expression levels of glial fibrillary acidic protein (GFAP), claudin 5, CD31, laminin α4, and laminin α5 increased in ω-3 PUFA + CM-treated uremic mice and the brain of fat-1 + CM-treated uremic mice compared with those in the brains of CM-treated uremic mice. The pro-apoptotic protein expression decreased, whereas the anti-apoptotic proteins increased in ω-3 PUFA + CM-treated uremic mice and fat-1 + CM-treated uremic mice compared with CM-treated uremic mice. In addition, the brain-expression levels of p-JNK, p-P53, and p-P38 decreased in the ω-3 PUFA + CM-treated uremic mice and fat-1 + CM-treated uremic mice compared with those in wild-type uremic mice. Our results confirm that uremic toxin and CM damage the BBB and cause brain-cell death. ω-3 PUFAs play a role in BBB protection caused by CM in uremic mice.

Keywords: blood–brain barrier (BBB); contrast media (CM); ischemia–reperfusion; uremic toxin; ω-3 PUFA.


Conflict of interest statement

The authors declare no conflict of interest.

Figures

Figure 1
Figure 1
Renal function and histology after ischemic–reperfusion (IR) renal injury. Renal function (WT, wild-type sham; fat-1, fat-1 induction sham; ω-3, ω-3 PUFA oral-administration sham; IR, IR renal injury in wild-type mice; fat-1 + IR, IR renal injury in fat-1 induction mice; ω-3 + IR, IR renal injury in ω-3 PUFA orally administered mice.) (A) The levels of blood urea nitrogen (BUN) and serum creatinine (s-Cr) were significantly increased in the IR group compared with those in each control group. (B) Representative kidney section with hematoxylin and eosin staining. Tubulointerstitial injuries represent dilated renal tubules and tubular necrosis and inflammatory cells. Original magnification, 200×. Scale bar = 50 μm. The bar represents mean ± SD. *** p < 0.001.
Figure 2
Figure 2
Hippocampal damage in ischemia–reperfusion (IR) kidney. (A) Representative immunofluorescence-stained brain section. Immunofluorescent staining was performed using the cell proliferation marker Ki67 and neuronal nuclei marker (NeuN) in the brain. Ki67 and NeuN expression significantly increased in the brains of WT IR + CM mice. Original magnification, 200×. Scale bar = 50 μm. (B) Representative TUNEL-stained brain section. The number of TUNEL-positive cells increased in the brains of WT IR + CM mice. Original magnification, 200×. Scale bar = 50 μm. Bar represents mean ± standard deviation. IR + CM, IR renal injury in wild-type mice administered with CM; fat-1 IR + CM, IR renal injury in fat-1 induction mice administered with CM; ω-3 IR + CM, IR renal injury in ω-3 PUFA orally treated mice administered with CM. * p < 0.05, ** p < 0.01.
Figure 3
Figure 3
ω-3 PUFAs protect against CM in the brains of IR-injured fat-1 mice. (AE) Representative immunofluorescence-stained brain section. Immunofluorescence staining was performed in the brains using the astrocyte marker GFAP, pericyte marker CD31, endothelial cell marker claudin 5, and extracellular matrix (ECM) markers laminin α4 and α5. Original magnification, 200×. Scale bar = 50 μm. (F) Representative TUNEL-stained brain section. Original magnification, 200×. Scale bar = 50 μm. (G) Representative Western blot of brain lysis: brain of fat-1 IR + CM shows decreased Bax, cleaved caspase-3, and increased Bcl2 expression compared with the brain of WT IR + CM. WT IR + CM. Bar represents mean ± SD. WT, wild-type sham; fat-1, fat-1 induction sham; WT IR + CM, IR renal injury in wild-type mice administered with CM; fat-1 IR + CM, IR renal injury in fat-1 induction mice administered with CM. * p < 0.05, ** p < 0.01, *** p < 0.001.
Figure 3
Figure 3
ω-3 PUFAs protect against CM in the brains of IR-injured fat-1 mice. (AE) Representative immunofluorescence-stained brain section. Immunofluorescence staining was performed in the brains using the astrocyte marker GFAP, pericyte marker CD31, endothelial cell marker claudin 5, and extracellular matrix (ECM) markers laminin α4 and α5. Original magnification, 200×. Scale bar = 50 μm. (F) Representative TUNEL-stained brain section. Original magnification, 200×. Scale bar = 50 μm. (G) Representative Western blot of brain lysis: brain of fat-1 IR + CM shows decreased Bax, cleaved caspase-3, and increased Bcl2 expression compared with the brain of WT IR + CM. WT IR + CM. Bar represents mean ± SD. WT, wild-type sham; fat-1, fat-1 induction sham; WT IR + CM, IR renal injury in wild-type mice administered with CM; fat-1 IR + CM, IR renal injury in fat-1 induction mice administered with CM. * p < 0.05, ** p < 0.01, *** p < 0.001.
Figure 4
Figure 4
ω-3 PUFAs protect against CM in the brains of IR-injured ω-3 PUFA mice. (AE) Representative immunofluorescence-stained brain section: Immunofluorescence staining was performed in the brain using the astrocyte marker GFAP, pericyte marker CD31, endothelial cell marker claudin 5, and extracellular matrix (ECM) markers laminin α4 and α5. Original magnification, 200×. Scale bar = 50 μm. (F) Representative TUNEL-stained brain section. Original magnification, 200×. Scale bar = 50 μm. (G) Representative Western blot of brain lysis: brain of ω-3 PUFA IR + CM shows decreased expression levels of Bax, cleaved caspase-3, and increased Bcl2 compared with the brain of WT IR + CM. Bar represents mean ± SD. WT, wild-type sham; ω-3, ω-3 PUFA oral-administration sham; WT IR + CM, IR renal injury in wild-type mice administered with CM; ω-3 PUFA IR + CM, IR renal injury in ω-3 PUFA oral-administration mice administered with CM. * p < 0.05, ** p < 0.01, *** p < 0.001.
Figure 4
Figure 4
ω-3 PUFAs protect against CM in the brains of IR-injured ω-3 PUFA mice. (AE) Representative immunofluorescence-stained brain section: Immunofluorescence staining was performed in the brain using the astrocyte marker GFAP, pericyte marker CD31, endothelial cell marker claudin 5, and extracellular matrix (ECM) markers laminin α4 and α5. Original magnification, 200×. Scale bar = 50 μm. (F) Representative TUNEL-stained brain section. Original magnification, 200×. Scale bar = 50 μm. (G) Representative Western blot of brain lysis: brain of ω-3 PUFA IR + CM shows decreased expression levels of Bax, cleaved caspase-3, and increased Bcl2 compared with the brain of WT IR + CM. Bar represents mean ± SD. WT, wild-type sham; ω-3, ω-3 PUFA oral-administration sham; WT IR + CM, IR renal injury in wild-type mice administered with CM; ω-3 PUFA IR + CM, IR renal injury in ω-3 PUFA oral-administration mice administered with CM. * p < 0.05, ** p < 0.01, *** p < 0.001.
Figure 5
Figure 5
Effects of ω-3 PUFAs on JNK/p-38 signaling. (A) Representative Western blot of brain lysis: the brains of fat-1 IR + CM mice show decreased JNK, p38, and p53-expression levels compared with the brains of WT IR + CM mice. (B) Representative Western blot of brain lysis: the brains of ω-3 PUFA IR + CM mice show decreased JNK, p38, and p53-expression levels compared with the brains of WT IR + CM mice. Bar represents mean ± SD. WT, wild-type sham; fat-1, fat-1 induction sham; ω-3, ω-3 PUFA oral-administration sham; WT IR + CM, IR renal injury in wild-type mice administered with CM; fat-1 IR + CM, IR renal injury in fat-1 induction mice administered with CM; ω-3 PUFA IR + CM, IR renal injury in ω-3 PUFA oral-administration mice administered with CM. * p < 0.05, ** p < 0.01, *** p < 0.001.
Figure 6
Figure 6
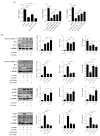
Effects of DHA and EPA on IS, CM, and JNK/p-38 activation toxicity in HBEC-5i. (A) IS and CM significantly reduced the survival of HBEC-5i cells in a dose-dependent manner. DHA and EPA increased the survival of HBEC-5i cells treated with IS and CM. (B) Representative Western blot: IS + CM-treated HBEC-5i cells had increased protein-expression levels of cleaved caspase-3, Bax, P-p38, P-JNK, and P-p53. DHA and EPA treatment reduces the protein expression of cleaved caspase-3, Bax, P-p38, P-JNK, and P-p53 in IS + CM-treated HBEC-5i cells. Bar represents mean ± SD. IS, indoxyl sulfate; CM, contrast medium (Omnihexol); DHA, docosahexaenoic acid; EPA, eicosapentaenoic acid. * p < 0.05, ** p < 0.01, *** p < 0.001.
Figure 7
Figure 7
Effects of DHA and EPA on IS and CM in HT22. (A) IS and CM significantly reduced the survival of HT22 cells in a dose-dependent manner. DHA and EPA increased the survival of HT22 cells treated with IS and CM. (B) Representative Western blot: IS + CM-treated HT22 cells had increased protein-expression levels of cleaved caspase-3 and Bax but decreased protein-expression levels of Bcl-2. DHA and EPA treatment reduced the protein-expression levels of cleaved caspase-3 and Bax in IS + CM-treated HT22 cells and increased the protein-expression level of Bcl-2. Bar represents mean ± SD. IS, indoxyl; CM, contrast medium (Omnihexol); DHA, docosahexaenoic acid; EPA, eicosapentaenoic acid. * p < 0.05, ** p < 0.01, *** p < 0.001.
Figure 8
Figure 8
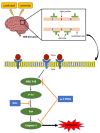
Schematic diagram. Ischemia–reperfusion (IR) increases kidney damage, and uremia induced by contrast medium (CM) causes BBB destruction and activates apoptosis. JNK/p38 signals involved in apoptosis activation cause neuroinflammatory and oxidative stress and result in BBB destruction. BBB damage caused by IR and CM in mice caused apoptosis and activated JNK/p38 signals. However, ω-3-PUFAs protected the BBB from IR and CM by inhibiting apoptosis and JNK/p38-signaling activation.
Figure 9
Figure 9
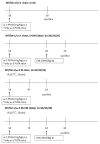
Illustration of the experimental schedule of mice. Schematic diagram of the experimental schedule. ω-3 PUFA mice receive 4 g/kg per os (PO) 24 h before all experimental schedules. The S + CM group received 10 mL/kg perfluorooctane sulfonate (ip) 24 h before the sacrifice, and the IR + CM group mice received 10 mL/kg perfluorooctane sulfonate (ip) 24 h after IR.

References

    1. Modi K., Padala S.A., Gupta M. Contrast-Induced Nephropathy. StatPearls Publishing; Treasure Island, FL, USA: 2023. - PubMed
    1. Junck L., Marshall W.H. Neurotoxicity of radiological contrast agents. Ann. Neurol. 1983;13:469–484. doi: 10.1002/ana.410130502. - DOI - PubMed
    1. Stacul F., on behalf of the Contrast Media Safety Committee of European Society of Urogenital Radiology (ESUR) van der Molen A.J., Reimer P., Webb J.A.W., Thomsen H.S., Morcos S.K., Almén T., Aspelin P., Bellin M.-F., et al. Contrast induced nephropathy: Updated ESUR Contrast Media Safety Committee guidelines. Eur. Radiol. 2011;21:2527–2541. doi: 10.1007/s00330-011-2225-0. - DOI - PubMed
    1. Avsenik J., Bisdas S., Popovic K.S. Blood-brain barrier permeability imaging using perfusion computed tomography. Radiol. Oncol. 2015;49:107–114. doi: 10.2478/raon-2014-0029. - DOI - PMC - PubMed
    1. Bobot M., Thomas L., Moyon A., Fernandez S., McKay N., Balasse L., Garrigue P., Brige P., Chopinet S., Poitevin S., et al. Uremic Toxic Blood-Brain Barrier Disruption Mediated by AhR Activation Leads to Cognitive Impairment during Experimental Renal Dysfunction. J. Am. Soc. Nephrol. 2020;31:1509–1521. doi: 10.1681/ASN.2019070728. - DOI - PMC - PubMed