. 2023 Aug 1;24(15):12325.
doi: 10.3390/ijms241512325.

Establishment and Characterization of Mild Atopic Dermatitis in the DNCB-Induced Mouse Model

Affiliations

Establishment and Characterization of Mild Atopic Dermatitis in the DNCB-Induced Mouse Model

Rebecca Riedl et al. Int J Mol Sci. .

Abstract

In dermatological research, 2,4-dinitrochlorbenzene (DNCB)-induced atopic dermatitis (AD) is a standard model as it displays many disease-associated characteristics of human AD. However, the reproducibility of the model is challenging due to the lack of information regarding the methodology and the description of the phenotype and endotype of the mimicked disease. In this study, a DNCB-induced mouse model was established with a detailed procedure description and classification of the AD human-like skin type. The disease was induced with 1% DNCB in the sensitization phase and repeated applications of 0.3% and 0.5% DNCB in the challenging phase which led to a mild phenotype of AD eczema. Pathophysiological changes of the dorsal skin were measured: thickening of the epidermis and dermis, altered skin barrier proteins, increased TH1 and TH2 cytokine expression, a shift in polyunsaturated fatty acids, increased pro-resolving and inflammatory mediator formation, and dysregulated inflammation-associated gene expression. A link to type I allergy reactions was evaluated by increased mast cell infiltration into the skin accompanied by elevated IgE and histamine levels in plasma. As expected for mild AD, no systemic inflammation was observed. In conclusion, this experimental setup demonstrates many features of a mild human-like extrinsic AD in murine skin.

Keywords: DNCB; atopic dermatitis mouse model; extrinsic; mild atopic dermatitis.


Conflict of interest statement

The authors declare no conflict of interest.

Figures

Figure 1
Figure 1
(a) Cumulative body weight gain of BALB/c mice during the experiment; (b) Dermatitis score of the treated area during the experiment; (c) Dermatitis score and images of the treated area at day 29. Data are presented as the mean ± standard error of the mean (SEM) (n = 5/group). Squares, dots and triangles represent one individual.
Figure 2
Figure 2
(a) Lymph node ratio and respective images; (b) Spleen ratio and respective images; (c) Skin thickness. Data are presented as the mean ± SEM (n = 5/group). Squares, dots and triangles represent one individual. *** p < 0.001 versus control.
Figure 3
Figure 3
(a) Representative hematoxylin and eosin (H&E) staining of dorsal skin sections showing epidermis (a), dermis (b), subcutis (sc), hair follicle (hf), and sebaceous glands (sg). The DNCB-treated skin displayed thickening of the epidermis (a), altered dermal skin structure (b), acanthosis and hyperkeratosis (c), and blood vessels (d) as well as spongiosis (*). (b) Representative H&E-stained sections, fluorescence staining of cell nuclei, cytokeratin-10, and filaggrin and toluidine staining of the treated dorsal skin. Scale bar: 100 µm. (c) Evaluation of the epidermal and dermal thickness on H&E-stained sections and epidermal hyperplasia using stained cell nuclei. (d) Evaluation of mast cell infiltration into the skin. Data are presented as the mean ± SEM (n = 4–5/group). Squares, dots and triangles represent one individual. * p < 0.05, ** p < 0.01 and *** p < 0.001 versus control. # p < 0.05 between DNCB groups.
Figure 3
Figure 3
(a) Representative hematoxylin and eosin (H&E) staining of dorsal skin sections showing epidermis (a), dermis (b), subcutis (sc), hair follicle (hf), and sebaceous glands (sg). The DNCB-treated skin displayed thickening of the epidermis (a), altered dermal skin structure (b), acanthosis and hyperkeratosis (c), and blood vessels (d) as well as spongiosis (*). (b) Representative H&E-stained sections, fluorescence staining of cell nuclei, cytokeratin-10, and filaggrin and toluidine staining of the treated dorsal skin. Scale bar: 100 µm. (c) Evaluation of the epidermal and dermal thickness on H&E-stained sections and epidermal hyperplasia using stained cell nuclei. (d) Evaluation of mast cell infiltration into the skin. Data are presented as the mean ± SEM (n = 4–5/group). Squares, dots and triangles represent one individual. * p < 0.05, ** p < 0.01 and *** p < 0.001 versus control. # p < 0.05 between DNCB groups.
Figure 4
Figure 4
Measurement of (a) IgE and (b) histamine concentrations in plasma of DNCB-treated skin. Data are presented as the mean ± SEM (n = 4–5/group). Squares, dots and triangles represent one individual. * p < 0.05 and *** p < 0.001 versus control.
Figure 5
Figure 5
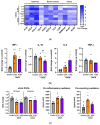
(a) Effects of DNCB on mRNA expression in skin. Heat maps present regulated genes compared to the control. Data are presented from individuals and as means (n = 3/group). (b) Measurement of cytokine expression in the skin. (c) Measurement of lipid mediator formation in the skin. Data present the ratio of omega-3 (n3) long-chain polyunsaturated fatty acids (PUFA) eicosapentaenoic (EPA) and docosahexaenoic (DHA) to the n6 PUFA arachidonic acid (AA), the sum of pro-inflammatory lipid mediators (PGD2, PGE2, PGF, TXB2, and LTB4), and the sum of pro-resolving lipid mediators (RvD5, PD1, MaR2, PDX, 17-HDHA, and 15-HEPE). Data are presented as the mean ± SEM (n = 4–5/group). Squares, dots and triangles represent one individual. * p < 0.05, ** p < 0.01 and *** p < 0.001 versus control. # p < 0.05 between DNCB groups.
Figure 6
Figure 6
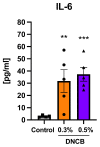
IL-6 expression from anti-CD3 and anti-CD28-activated splenocytes after 48 h of incubation. Data are presented as the mean ± SEM (n = 5/group). Squares, dots and triangles represent one individual. ** p < 0.01 and *** p < 0.001 versus control.
Figure 7
Figure 7
Time schedule of the DNCB-induced hlAD model on BALB/c mice by topical application.

Similar articles

Cited by

References

    1. Asher M.I., Montefort S., Björkstén B., Lai C.K., Strachan D.P., Weiland S.K., Williams H. Worldwide Time Trends in the Prevalence of Symptoms of Asthma, Allergic Rhinoconjunctivitis, and Eczema in Childhood: ISAAC Phases One and Three Repeat Multicountry Cross-Sectional Surveys. Lancet. 2006;368:733–743. doi: 10.1016/S0140-6736(06)69283-0. - DOI - PubMed
    1. Nutten S. Atopic Dermatitis: Global Epidemiology and Risk Factors. Ann. Nutr. Metab. 2015;66:8–16. doi: 10.1159/000370220. - DOI - PubMed
    1. Gittler J.K., Shemer A., Suárez-Fariñas M., Fuentes-Duculan J., Gulewicz K.J., Wang C.Q.F., Mitsui H., Cardinale I., de Guzman Strong C., Krueger J.G., et al. Progressive Activation of TH2/TH22 Cytokines and Selective Epidermal Proteins Characterizes Acute and Chronic Atopic Dermatitis. J. Allergy Clin. Immunol. 2012;130:1344–1354. doi: 10.1016/j.jaci.2012.07.012. - DOI - PMC - PubMed
    1. Guttman-Yassky E., Nograles K.E., Krueger J.G. Contrasting Pathogenesis of Atopic Dermatitis and Psoriasis—Part I: Clinical and Pathologic Concepts. J. Allergy Clin. Immunol. 2011;127:1110–1118. doi: 10.1016/j.jaci.2011.01.053. - DOI - PubMed
    1. Burgess J.A., Dharmage S.C., Byrnes G.B., Matheson M.C., Gurrin L.C., Wharton C.L., Johns D.P., Abramson M.J., Hopper J.L., Walters E.H. Childhood Eczema and Asthma Incidence and Persistence: A Cohort Study from Childhood to Middle Age. J. Allergy Clin. Immunol. 2008;122:280–285. doi: 10.1016/j.jaci.2008.05.018. - DOI - PubMed