. 2023 Aug 2;24(15):12348.
doi: 10.3390/ijms241512348.

Humanized NSG Mouse Models as a Preclinical Tool for Translational Research in Inflammatory Bowel Diseases

Affiliations

Humanized NSG Mouse Models as a Preclinical Tool for Translational Research in Inflammatory Bowel Diseases

Veronika Weß et al. Int J Mol Sci. .

Abstract

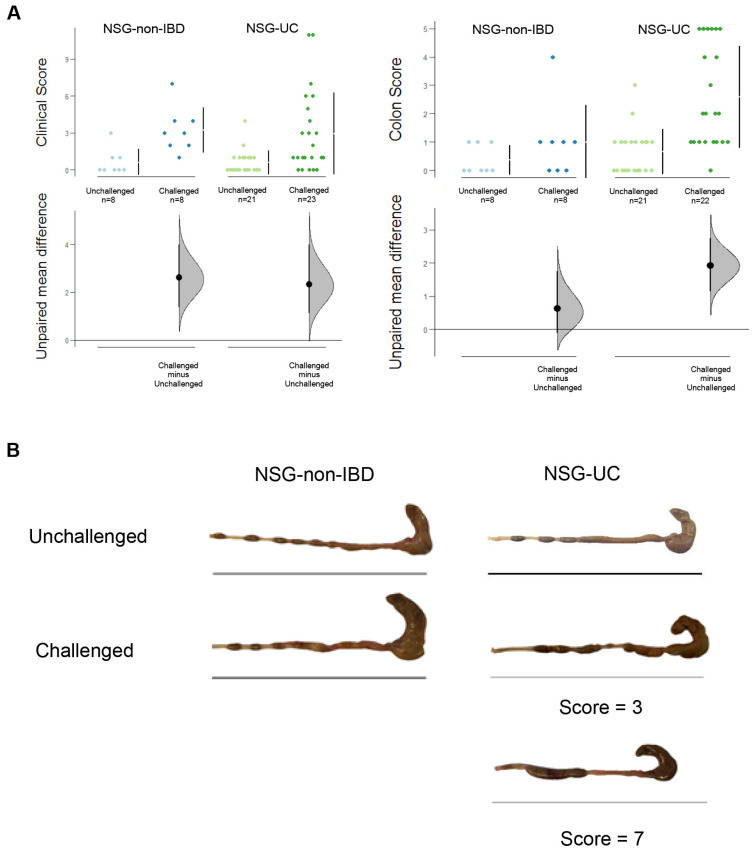
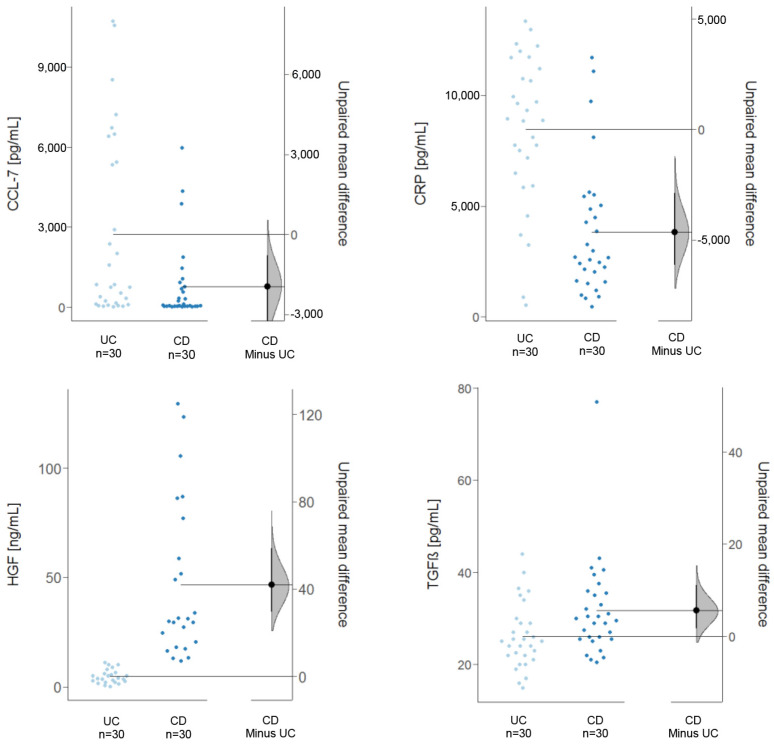
The development of animal models reflecting the pathologies of ulcerative colitis (UC) and Crohn's disease (CD) remains a major challenge. The NOD/SCID/IL2rγnull (NSG) mouse strain, which is immune-compromised, tolerates the engraftment of human peripheral blood mononuclear cells (PBMC) derived from patients with UC (NSG-UC) or CD (NSG-CD). This offers the opportunity to examine the impact of individual immunological background on the development of pathophysiological manifestations. When challenged with ethanol, NSG-UC mice exhibited a strong pro-inflammatory response, including the development of edemas, influx of human T cells, B cells and monocytes into the mucosa and submucosa, and elevated expression of the inflammatory markers CRP and CCL-7. Fibrotic alterations were characterized by an influx of fibroblasts and a thickening of the muscularis mucosae. In contrast, the development of pathological manifestations in NSG-CD mice developed without challenge and was signified by extensive collagen deposition between the muscularis propria and muscularis mucosae, as observed in the areas of strictures in CD patients. Vimentin-expressing fibroblasts supplanting colonic crypts and elevated expression of HGF and TGFß corroborated the remodeling phenotype. In summary, the NSG-UC and NSG-CD models partially reflect these human diseases and are powerful tools to examine the mechanism underlying the inflammatory processes in UC and CD.

Keywords: Crohn’s disease; IBD; NOD/SCID/IL2rγnull; NSG; animal models; immune-deficient; inflammatory bowel disease; mouse models; ulcerative colitis.


Conflict of interest statement

The authors declare no conflict of interest.

Figures

Figure 1
Figure 1
Schematic depiction of the animal model study: (A) flowchart and (B) scheme. NSG mice were reconstituted through injection of 4 × 10⁶ PBMCs in 100 µL of PBS into the tail vein on day 1 and were left unchallenged or challenged by rectal application of 150 µL of 10% ethanol on day 8, and 150 µL of 50% ethanol on day 15. Therapeutic antibodies (150 µL in PBS) were applied intraperitoneally (i.p.) on days 7 and 14 and small-molecule inhibitors were dissolved in 150 µL of PBS or 0.5% methylcellulose and injected via i.p. on days 7–9 and 14–17.
Figure 2
Figure 2
An inflammatory background of the donor and a challenge with ethanol are required to induce symptoms of UC in NSG-UC mice. (A) Clinical and macroscopic colon scores of NSG-non-IBD mice (unchallenged N = 2, n = 8; challenged N = 2, n = 8) and NSG-UC mice (unchallenged N = 4, n = 21; challenged N = 4, n = 23) depicted in Cumming plots. NSG mice were reconstituted with PBMCs on day 1 and were left unchallenged or challenged with 10% ethanol on day 8, and 50% ethanol on day 15. The upper part of the plot presents each data point in a swarmplot. The mean and standard deviation (SD) of each group are plotted as a gapped line, where the vertical lines correspond to the mean ± SD and the mean itself is depicted as a gap in the line. The 0 point of the difference axis is based on the mean of the reference group (control). The dots show the difference between groups (effect size/mean difference). The shaded curve shows the entire distribution of excepted sampling error for the difference between the means (the higher the peak, the smaller the error). The error bar in the filled circles indicates the 95% confidence interval (bootstrapped) for the difference between means. N: no. of donors, n: no. of mice. (B) Macrophotographs of representative colons. For the challenged NSG-UC mice, colons with a score of 3 and 7 are depicted. The bar indicates 10 cm.
Figure 3
Figure 3
An inflammatory background of the donor and a challenge with ethanol are required to induce pathological manifestations of UC in NSG-UC mice. The mice were treated as described in Figure 2. (A) Representative microphotographs of stained sections of distal parts of the colons: (I) H&E staining and (II) SR staining (boxed area). Thick arrows indicate edema and influx of inflammatory cells, dotted lines indicate crypt elongation, thin arrows indicate tufting, and arrow heads indicate fibrosis. Two different sections with different histological scores are depicted and compared to sections from NSG-non-IBD mice. Scale bar represents 100 µm. (B) Histological scores depicted as Cumming plot. The upper part of the plot presents each data point in a swarmplot. The mean and standard deviation (SD) of each group are plotted as a gapped line, where the vertical lines correspond to the mean ± SD and the mean itself is depicted as a gap in the line. The 0 point of the difference axis is based on the mean of the reference group (control). The dots show the difference between groups (effect size/mean difference). The shaded curve shows the entire distribution of excepted sampling error for the difference between the means (the higher the peak, the smaller the error). The error bar in the filled circles indicates the 95% confidence interval (bootstrapped) for the difference between means. N: no. of donors, n: no. of mice.
Figure 4
Figure 4
Pearson’s product-moment correlation analysis of murine histological scores and human clinical SCCAI scores depicted as a scatter plot. The SCCAI scores of patients whose PBMCs were used for reconstitution were correlated with the mean values of the histological scores of the respective NSG−UC mice challenged with ethanol.
Figure 5
Figure 5
Challenge with ethanol induces the expression of inflammatory markers in NSG-UC mice. The mice were treated as described in Figure 2 (unchallenged N = 2, n = 8; challenged N = 4, n = 24). Levels of msCRP, msCCL−7 and msIL−6 were detected using Luminex from colon extracts and depicted as Cumming plots. The upper part of the plot presents each data point in a swarmplot. The mean and standard deviation (SD) of each group are plotted as a gapped line, where the vertical lines correspond to the mean ± SD and the mean itself is depicted as a gap in the line. The 0 point of the difference axis is based on the mean of the reference group (control). The dots show the difference between groups (effect size/mean difference). The shaded curve shows the entire distribution of excepted sampling error for the difference between the means (the higher the peak, the smaller the error). The error bar in the filled circles indicates the 95% confidence interval (bootstrapped) for the difference between means. The labeling on the right side applies to all graphs. N: no. of donors, n: no. of mice.
Figure 6
Figure 6
Cells of human origin migrate into the mucosa and submucosa. Sections from the distal parts of the colon were stained with green Alexafluor anti-human CD4, CD8, CD19 and CD14. Scale bar represents 100 µm.
Figure 7
Figure 7
Colonic fibroblasts exhibit a heterogeneous morphology. Immunohistochemical analysis of (A) sections of NSG-non-IBD and NSG-UC mice challenged with ethanol and of (B) isolated fibroblasts from mouse colons. Arrows indicate muscularis mucosae, and arrow heads indicate influx of myofibroblasts into fibrotic areas. The sections were stained with anti-vimentin, anti-αSMA (green Alexafluor), anti-desmin, anti-TRPA1 (red Alexafluor), DAPI blue and H&E. Scale bar represents 100 µm or 200 µm.
Figure 8
Figure 8
Examples of OPLS-DA analysis of inflammatory parameters obtained from NSG-UC mice treated with Infliximab or Tofacitinib. The mice were treated as described in [21]. Clinical, colonic and histological scores, and levels of msIL−6, msTGFß, msCRP, msCCL−7 and tryptophan were used for modeling. R2X: fraction of variation in the × variables explained by the model; R2Y: fraction of variation in the Y variables explained by the model, Q2Y: fraction of variation in the Y variables predicted by the model; RMSEE: root mean square error of estimation.
Figure 9
Figure 9
The pathophysiological phenotype in NSG-CD mice. The mice were reconstituted with PBMCs derived from CD donors and treated as described in Figure 2. Sections from the distal parts of the colon of the NSG-CD mice challenged with ethanol were analyzed. (A) H&E and SR staining (boxed area). (B) Immunohistochemical analysis using anti−human CD45, anti−human CD8, antimurine vimentin (green Alexafluor), and anti−Col1(red Alexafluor). Scale bar represents 100 µm. (C) Clinical, colon, and histological scores of challenged and unchallenged NSG-CD mice depicted as Cumming plot. The upper part of the plot presents each data point in a swarmplot. The mean and standard deviation (SD) of each group are plotted as a gapped line, where the vertical lines correspond to the mean ± SD and the mean itself is depicted as a gap in the line. The 0 point of the difference axis is based on the mean of the reference group (control). The dots show the difference between groups (effect size/mean difference). The shaded curve shows the entire distribution of excepted sampling error for the difference between the means (the higher the peak, the smaller the error). The error bar in the filled circles indicates the 95% confidence interval (bootstrapped) for the difference between means. N: no. of donors, n: no. of mice.
Figure 10
Figure 10
Inflammatory and remodeling markers are differentially expressed in the NSG−UC and NSG−CD models. Levels of CCL−7 (UC: N = 5, n = 30; CD: N = 5, n = 30), CRP (UC: N = 5, n = 30; CD: N = 5, n = 30), TGFß (UC: N = 5, n = 30; CD: N = 5, n = 30), and HGF (UC: N = 4, n = 30; CD: N = 4, n = 24) depicted as Cumming plots. The upper part of the plot presents each data point in a swarmplot. The mean and standard deviation (SD) of each group are plotted as a gapped line, where the vertical lines correspond to the mean ± SD and the mean itself is depicted as a gap in the line. The 0 point of the difference axis is based on the mean of the reference group (control). The dots show the difference between groups (effect size/mean difference). The shaded curve shows the entire distribution of excepted sampling error for the difference between the means (the higher the peak, the smaller the error). The error bar in the filled circles indicates the 95% confidence interval (bootstrapped) for the difference between means. N: no. of donors, n: no. of mice.

Similar articles

Cited by

References

    1. Ng S.C., Shi H.Y., Hamidi N., Underwood F.E., Tang W., Benchimol E.I., Panaccione R., Ghosh S., Wu J.C.Y., Chan F.K.L., et al. Worldwide incidence and prevalence of inflammatory bowel disease in the 21st century: A systematic review of population-based studies. Lancet. 2017;390:2769–2778. doi: 10.1016/S0140-6736(17)32448-0. - DOI - PubMed
    1. Molodecky N.A., Soon I.S., Rabi D.M., Ghali W.A., Ferris M., Chernoff G., Benchimol E.I., Panaccione R., Ghosh S., Barkema H.W., et al. Increasing incidence and prevalence of the inflammatory bowel diseases with time, based on systematic review. Gastroenterology. 2012;142:46–54.e42. doi: 10.1053/j.gastro.2011.10.001. - DOI - PubMed
    1. Sartor R.B. Mechanisms of disease: Pathogenesis of Crohn’s disease and ulcerative colitis. Nat. Clin. Pract. Gastroenterol. Hepatol. 2006;3:390–407. doi: 10.1038/ncpgasthep0528. - DOI - PubMed
    1. Baumgart D.C., Sandborn W.J. Crohn’s disease. Lancet. 2012;380:1590–1605. doi: 10.1016/S0140-6736(12)60026-9. - DOI - PubMed
    1. Guan Q. A Comprehensive Review and Update on the Pathogenesis of Inflammatory Bowel Disease. J. Immunol. Res. 2019;2019:7247238. doi: 10.1155/2019/7247238. - DOI - PMC - PubMed