. 2023 Aug 2;24(15):12364.
doi: 10.3390/ijms241512364.

A Sphingolipidomic Profiling Approach for Comparing X-ray-Exposed and Unexposed HepG2 Cells

Affiliations

A Sphingolipidomic Profiling Approach for Comparing X-ray-Exposed and Unexposed HepG2 Cells

Martina Moggio et al. Int J Mol Sci. .

Abstract

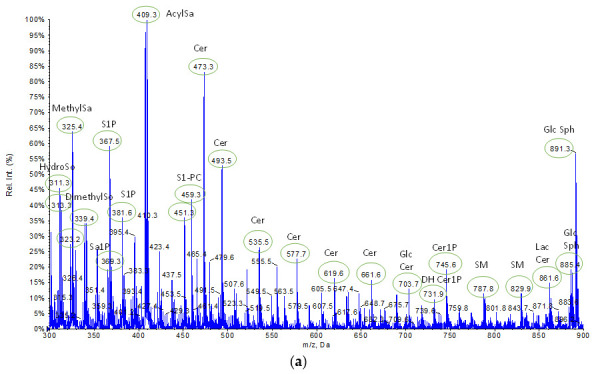
An analytical method based on tandem mass spectrometry-shotgun is presently proposed to obtain sphingolipidomic profiles useful for the characterization of lipid extract from X-ray-exposed and unexposed hepatocellular carcinoma cells (HepG2). To obtain a targeted lipidic profile from a specific biological system, the best extraction method must be identified before instrumental analysis. Accordingly, four different classic lipid extraction protocols were compared in terms of efficiency, specificity, and reproducibility. The performance of each procedure was evaluated using the Fourier-transform infrared spectroscopic technique; subsequently, the quality of extracts was estimated using electrospray ionization tandem mass spectrometry. The selected procedure based on chloroform/methanol/water was successfully used in mass spectrometry-based shotgun sphingolipidomics, allowing for evaluation of the response of cells to X-ray irradiation, the most common anticancer therapy. Using a relative quantitative approach, the changes in the sphingolipid profiles of irradiated cell extracts were demonstrated, confirming that lipidomic technologies are also useful tools for studying the key sphingolipid role in regulating cancer growth during radiotherapy.

Keywords: HepG2 cells; X-ray; extraction methods; mass spectrometry; sphingolipidomics.


Conflict of interest statement

The authors declare no conflict of interest.

Figures

Figure 1
Figure 1
Comparison of average FT-IR spectra for samples obtained from unirradiated HepG2 cells by different lipid extraction methods: (a) B&D; (b) modified BuMe; (c) SHA; (d) IPA.
Figure 2
Figure 2
High-wavenumber region of average spectra acquired from lipid samples extracted using the four adopted procedures.
Figure 3
Figure 3
Representative mass spectra of samples obtained by B&D method using unirradiated HepG2 cells: (a) in negative-ion mode; (b) in positive-ion mode.
Figure 3
Figure 3
Representative mass spectra of samples obtained by B&D method using unirradiated HepG2 cells: (a) in negative-ion mode; (b) in positive-ion mode.
Figure 4
Figure 4
Comparison of relative intensity calculated from mass spectra of samples obtained by different lipid extraction methods using unirradiated HepG2 cells: (a) in negative-ion mode; (b) in positive-ion mode. Error bars represent SD; the asterisks indicate that a significant difference relative to B&D method occurred at *** p < 0.001; ** p < 0.01; * p < 0.05.
Figure 4
Figure 4
Comparison of relative intensity calculated from mass spectra of samples obtained by different lipid extraction methods using unirradiated HepG2 cells: (a) in negative-ion mode; (b) in positive-ion mode. Error bars represent SD; the asterisks indicate that a significant difference relative to B&D method occurred at *** p < 0.001; ** p < 0.01; * p < 0.05.
Figure 5
Figure 5
Inter-assay reproducibility, expressed as percentage coefficient of variation CV%, of extraction methods for all SPL subclass in negative-ion (a) and positive-ion (b) mode. The dotted line represents the median CV% of the B&D method.
Figure 6
Figure 6
Representative mass spectra of samples obtained by B&D method using irradiated HepG2 cells: (a) in negative-ion mode; (b) in positive-ion mode.

References

    1. Hannun Y.A., Obeid L.M. Sphingolipids and their metabolism in physiology and disease. Nat. Rev. Mol. Cell Biol. 2018;19:175–191. doi: 10.1038/nrm.2017.107. - DOI - PMC - PubMed
    1. Filippo V., Song M.A., Zhang K., Vinters H.V., Tung S., Kirsch W.M., Yang J., Duerksen-Hughes P.J. Increased ceramide in brains with Alzheimer’s and other neurodegenerative diseases. J. Alzheimers Dis. 2012;29:537–547. doi: 10.3233/JAD-2011-111202. - DOI - PMC - PubMed
    1. Custodia A., Romaus-Sanjurjo D., Aramburu-Núñez M., Álvarez-Rafael D., Vázquez-Vázquez L., Camino-Castiñeiras J., Leira Y., Pías-Peleteiro J.M., Aldrey J.M., Sobrino T., et al. Ceramide/Sphingosine 1-Phosphate Axis as a Key Target for Diagnosis and Treatment in Alzheimer’s Disease and Other Neurodegenerative Diseases. Int. J. Mol. Sci. 2022;23:8082. doi: 10.3390/ijms23158082. - DOI - PMC - PubMed
    1. Piccoli M., Cirillo F., Ghiroldi A., Rota P., Coviello S., Tarantino A., La Rocca P., Lavota I., Creo P., Signorelli P., et al. Sphingolipids and Atherosclerosis: The Dual Role of Ceramide and Sphingosine-1-Phosphate. Antioxidants. 2023;12:143. doi: 10.3390/antiox12010143. - DOI - PMC - PubMed
    1. Ogretmen B. Sphingolipid metabolism in cancer signalling and therapy. Nat. Rev. Cancer. 2017;18:33–50. doi: 10.1038/nrc.2017.96. - DOI - PMC - PubMed

LinkOut - more resources