

The Effect of Adjuvant Therapy with Molecular Hydrogen on Endogenous Coenzyme Q10 Levels and Platelet Mitochondrial Bioenergetics in Patients with Non-Alcoholic Fatty Liver Disease
- PMID: 37569850
- PMCID: PMC10419858
- DOI: 10.3390/ijms241512477
The Effect of Adjuvant Therapy with Molecular Hydrogen on Endogenous Coenzyme Q10 Levels and Platelet Mitochondrial Bioenergetics in Patients with Non-Alcoholic Fatty Liver Disease
Abstract
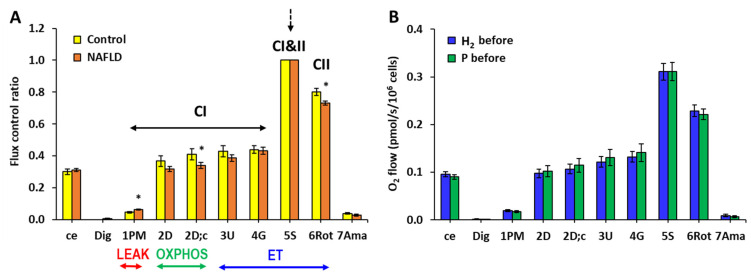
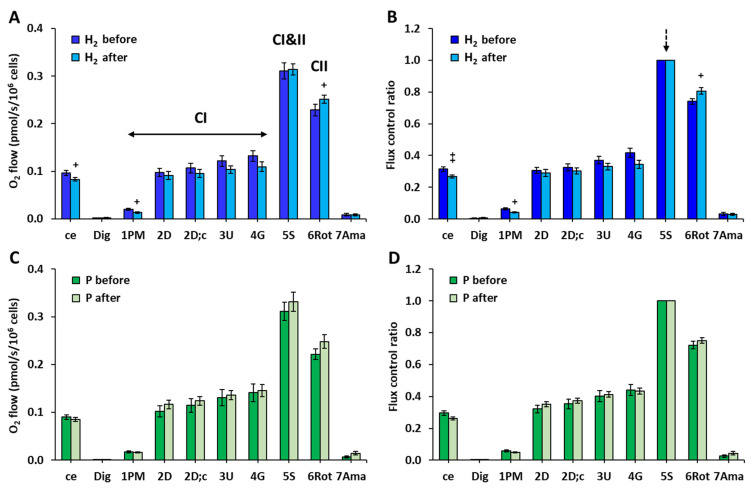
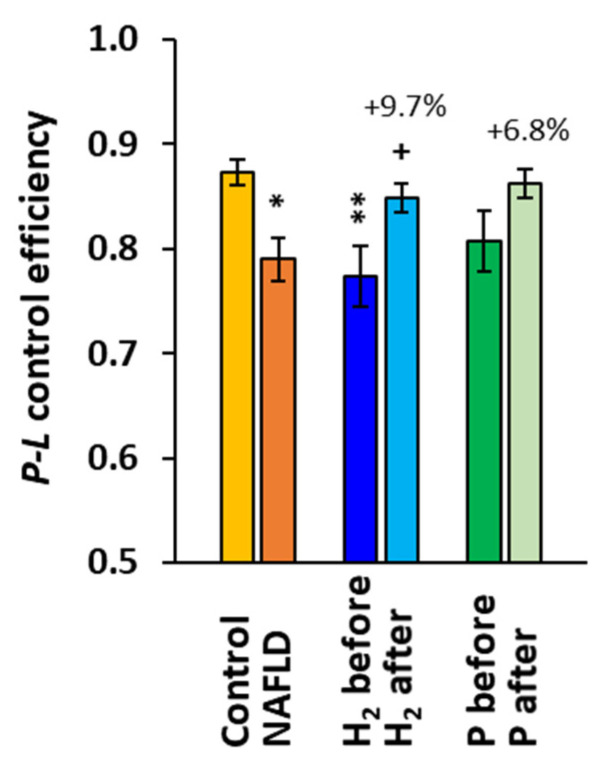
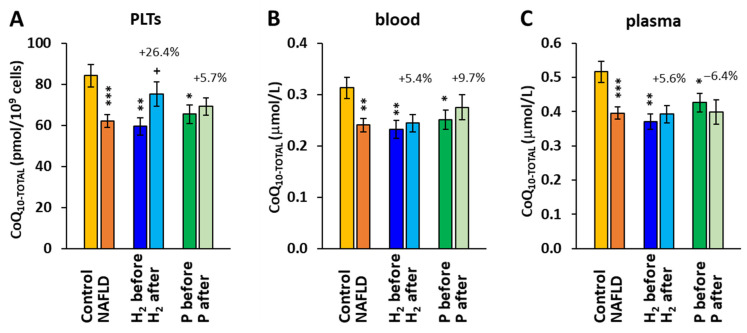
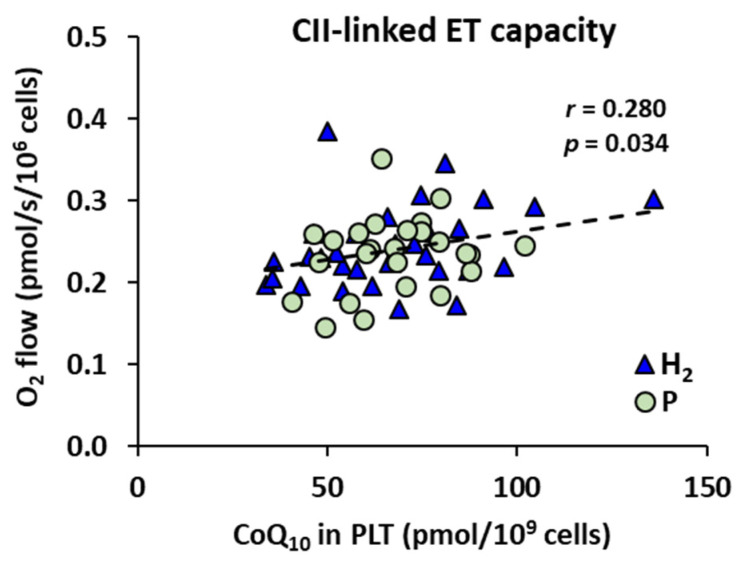
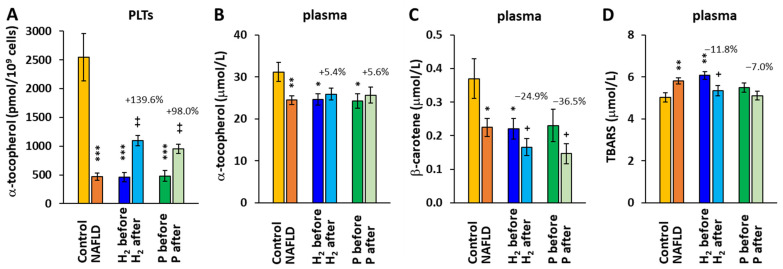
Molecular hydrogen (H2) has been recognized as a novel medical gas with antioxidant and anti-inflammatory effects. Non-alcoholic fatty liver disease (NAFLD) is a liver pathology with increased fat accumulation in liver tissue caused by factors other than alcohol consumption. Platelet mitochondrial function is considered to reflect systemic mitochondrial health. We studied the effect of adjuvant therapy with hydrogen-rich water (HRW) on coenzyme Q10 (CoQ10) content and platelet mitochondrial bioenergetics in patients with NAFLD. A total of 30 patients with NAFLD and 15 healthy volunteers were included in this clinical trial. A total of 17 patients (H2 group) drank water three × 330 mL/day with tablets producing HRW (>4 mg/L H2) for 8 weeks, and 13 patients (P group) drank water with placebo tablets producing CO2. The concentration of CoQ10-TOTAL was determined by the HPLC method, the parameter of oxidative stress, thiobarbituric acid reactive substances (TBARS), by the spectrophotometric method, and mitochondrial bioenergetics in platelets isolated from whole blood by high-resolution respirometry. The patients with NAFLD had lower concentrations of CoQ10-TOTAL in the blood, plasma, and platelets vs. the control group. Mitochondrial CI-linked LEAK respiration was higher, and CI-linked oxidative phosphorylation (OXPHOS) and CII-linked electron transfer (ET) capacities were lower vs. the control group. Plasma TBARS concentrations were higher in the H2 group. After 8 weeks of adjuvant therapy with HRW, the concentration of CoQ10 in platelets increased, plasma TBARS decreased, and the efficiency of OXPHOS improved, while in the P group, the changes were non-significant. Long-term supplementation with HRW could be a promising strategy for the acceleration of health recovery in patients with NAFLD. The application of H2 appears to be a new treatment strategy for targeted therapy of mitochondrial disorders. Additional and longer-term studies are needed to confirm and elucidate the exact mechanisms of the mitochondria-targeted effects of H2 therapy in patients with NAFLD.
Keywords: coenzyme Q10; mitochondria; molecular hydrogen; oxidative phosphorylation; platelets.
Conflict of interest statement
The authors declare no conflict of interest.
Figures
Similar articles
-
Reduced platelet mitochondrial respiration and oxidative phosphorylation in patients with post COVID-19 syndrome are regenerated after spa rehabilitation and targeted ubiquinol therapy.Front Mol Biosci. 2022 Oct 21;9:1016352. doi: 10.3389/fmolb.2022.1016352. eCollection 2022. Front Mol Biosci. 2022. PMID: 36339707 Free PMC article.
-
Platelet Mitochondrial Bioenergetics Reprogramming in Patients with Urothelial Carcinoma.Int J Mol Sci. 2021 Dec 30;23(1):388. doi: 10.3390/ijms23010388. Int J Mol Sci. 2021. PMID: 35008814 Free PMC article.
-
Platelet Mitochondrial Respiration, Endogenous Coenzyme Q10 and Oxidative Stress in Patients with Chronic Kidney Disease.Diagnostics (Basel). 2020 Mar 23;10(3):176. doi: 10.3390/diagnostics10030176. Diagnostics (Basel). 2020. PMID: 32210203 Free PMC article.
-
Perspective targeted diagnosis and therapy of mitochondrial bioenergetics across different diagnoses.Bratisl Lek Listy. 2024;125(11):693-700. doi: 10.4149/BLL_2024_105. Bratisl Lek Listy. 2024. PMID: 39487838 Review.
-
Effects of coenzyme Q10 supplementation on inflammation, angiogenesis, and oxidative stress in breast cancer patients: a systematic review and meta-analysis of randomized controlled- trials.Inflammopharmacology. 2021 Jun;29(3):579-593. doi: 10.1007/s10787-021-00817-8. Epub 2021 May 18. Inflammopharmacology. 2021. PMID: 34008150
Cited by
-
Hydrogen-Rich Water (HRW) Reduces Fatty Acid-Induced Lipid Accumulation and Oxidative Stress Damage through Activating AMP-Activated Protein Kinase in HepG2 Cells.Biomedicines. 2024 Jun 28;12(7):1444. doi: 10.3390/biomedicines12071444. Biomedicines. 2024. PMID: 39062020 Free PMC article.
-
A Narrative Review of Oxidative Stress and Liver Disease in Pregnancy: The Role of Antioxidants.Cureus. 2024 Jul 17;16(7):e64714. doi: 10.7759/cureus.64714. eCollection 2024 Jul. Cureus. 2024. PMID: 39156333 Free PMC article. Review.
-
Oral Administration of Hydrogen-rich Water: Biomedical Activities, Potential Mechanisms, and Clinical Applications.Curr Pharm Des. 2025;31(19):1537-1550. doi: 10.2174/0113816128330516241121150719. Curr Pharm Des. 2025. PMID: 39810534 Review.
-
Mechanisms and Application of Gas-Based Anticancer Therapies.Pharmaceuticals (Basel). 2023 Oct 2;16(10):1394. doi: 10.3390/ph16101394. Pharmaceuticals (Basel). 2023. PMID: 37895865 Free PMC article. Review.
-
Hydrogen Water: Extra Healthy or a Hoax?-A Systematic Review.Int J Mol Sci. 2024 Jan 12;25(2):973. doi: 10.3390/ijms25020973. Int J Mol Sci. 2024. PMID: 38256045 Free PMC article.
References
-
- Alomari M., Rashid M.U., Chadalavada P., Ragheb J., Zafar H., Suarez Z.K., Khazaaleh S., Gonzalez A.J., Castro F.J. Comparison between metabolic-associated fatty liver disease and nonalcoholic fatty liver disease: From nomenclature to clinical outcomes. World J. Hepatol. 2023;15:477–496. doi: 10.4254/wjh.v15.i4.477. - DOI - PMC - PubMed
Grants and funding
- APVV-19-0317/Slovak Research and Development Agency
- 2/0063/18/Scientific Grant Agency of the Ministry of Education, Science, Research and Sport of the Slovak Republic and Slovak Academy of Sciences
- 2/0092/222/Scientific Grant Agency of the Ministry of Education, Science, Research and Sport of the Slovak Republic and Slovak Academy of Sciences
- 2/0148/22/Scientific Grant Agency of the Ministry of Education, Science, Research and Sport of the Slovak Republic and Slovak Academy of Sciences
- 2019/4-CEMSAV-1/Ministry of Health of Slovak Republic
- ITMS 313011T431/Operational Program Integrated Infrastructure for the project: Research and development in medical sciences - the way to personalized treatment of serious neurological, cardiovascular and cancer diseases
- 2018/7838:1-26CO/Scientific Grant Agency of the Ministry of Education, Science, Research and Sport of the Slovak Republic and Slovak Academy of Sciences
LinkOut - more resources
Full Text Sources
