. 2023 Jul 31;16(15):5368.
doi: 10.3390/ma16155368.

Simulation of Corrosion Phenomena in Automotive Components: A Case Study

Affiliations

Simulation of Corrosion Phenomena in Automotive Components: A Case Study

Annalisa Ferrarotti et al. Materials (Basel). .

Abstract

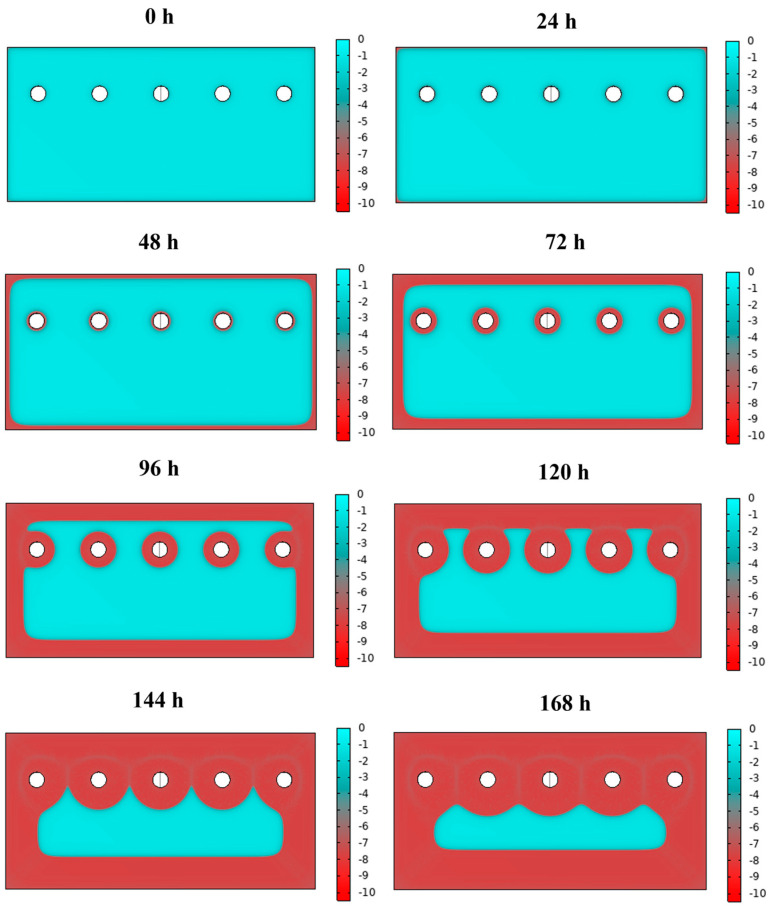
Mathematical modelling and software simulation nowadays are very effective tools for both understanding and predicting corrosion processes and the protection of metallic components. COMSOL Multiphysics 5.6 software provides validated mathematical models that can be used, for a given geometry, as a tool to predict and prevent corrosion of components. The corrosion of zinc-coated steel sheets has been studied in this work by comparing results of the simulations with laboratory tests carried out in a salt spray. Results of both the mathematical modelling and empirical tests give the possibility to estimate the stability of the protective zinc layer over time. The examination of the discrepancies between two analytical methods for the investigation of corrosion phenomena leads to possible modifications in the model in order to reach as much as possible coherence with experimental data. As a final result, a computational model of corrosion phenomena in an automotive component has been reached, allowing in the future to partially substitute laboratory tests, usually being highly time consuming and expensive.

Keywords: coating materials; computer simulations; corrosion.


Conflict of interest statement

The authors declare no conflict of interest.

Figures

Figure 1
Figure 1
Representation of the selected points of interest on the zinc-coated sheets of steel. Reported values are in mm.
Figure 2
Figure 2
Experimental polarisation curves (black) of the materials constituting the sheet, (a) curve referring to the core material (steel BH210) and (b) curve referring to the coating material (zinc). Possible variations of current at fixed voltage are represented by coloured curves (blue + 10%, green + 20%, red + 30%).
Figure 3
Figure 3
Results of the corrosion simulation on a zinc-coated steel sheet from the initial situation equal to 0 h up to 168 h. The thickness in micrometres of the Zn surface layer is shown in coloured scale (cyan: non-corroded; red: fully corroded).
Figure 4
Figure 4
Comparison of results of the corrosion simulation on zinc-coated steel sheets with experimental results, deriving from salt fog experimental tests, in different regions of the sheets. (ac) report experimental data on points near the boundaries, near the holes and inner points, respectively; (df) report data simulated with COMSOL Multiphysics, on points near the boundaries, near the holes and inner points, respectively.
Figure 5
Figure 5
Comparison of (left side) results of the corrosion simulation on zinc-coated steel sheets with (right side) experimental results, deriving from salt fog experimental tests, at different time intervals. The thickness variation of the Zn surface layer is shown in coloured micrometres in scale (cyan: non-corroded; red: fully corroded).
Figure 6
Figure 6
Comparison of results of the corrosion simulations on zinc-coated steel sheets from the initial situation equal to 0 h up to 168 h, increasing the experimental value of the current density to 10, 20 and 30%. The thickness of the Zn surface layer is shown in coloured micrometres scale (cyan: non-corroded; red: fully corroded).
Figure 7
Figure 7
Comparison of the results of the corrosion simulation with the variation of current density and experimental curve, in three different points of the zinc-coated steel sheets, located in different regions. (a) corresponds to point 9 placed near a hole, (b) corresponds to point 14 near the lateral edge of the sheet and (c) corresponds to point 15, an internal point.
Figure 8
Figure 8
Halving time as a function of current density increment of point 9 and 14. The linear fit of experimental data is shown as dashed-dot lines. For comparison, the experimental values of halving time are shown as red lines.

References

    1. Bardal E. Corrosion and Protection. Springer; Berlin/Heidelberg, Germany: 2004.
    1. Wang H., Han E.H. Simulation of Metastable Corrosion Pit Development under Mechanical Stress. Electrochim. Acta. 2013;90:128–134. doi: 10.1016/j.electacta.2012.11.056. - DOI
    1. Mizuno D. Automotive Corrosion and Accelerated Corrosion Tests for Zinc Coated Steels. ISIJ Int. 2018;58:1562–1568. doi: 10.2355/isijinternational.ISIJINT-2018-159. - DOI
    1. Altmayer F. Choosing an Accelerated Corrosion Test. Chicago, Scientific Control Laboratories Inc.; Chicago, IL, USA: 2002.
    1. Meade C.L. Accelerated Corrosion Testing. National Exposure Testing; Sylvania, OH, USA: 2000.