

Experimental Investigation of Phase Equilibria of the Ho-Ir-O Ternary System at 1073 K
- PMID: 37570110
- PMCID: PMC10419622
- DOI: 10.3390/ma16155406
Experimental Investigation of Phase Equilibria of the Ho-Ir-O Ternary System at 1073 K
Abstract
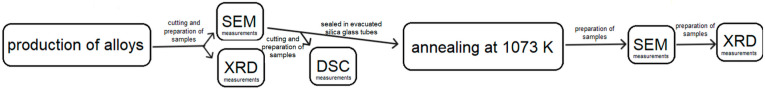
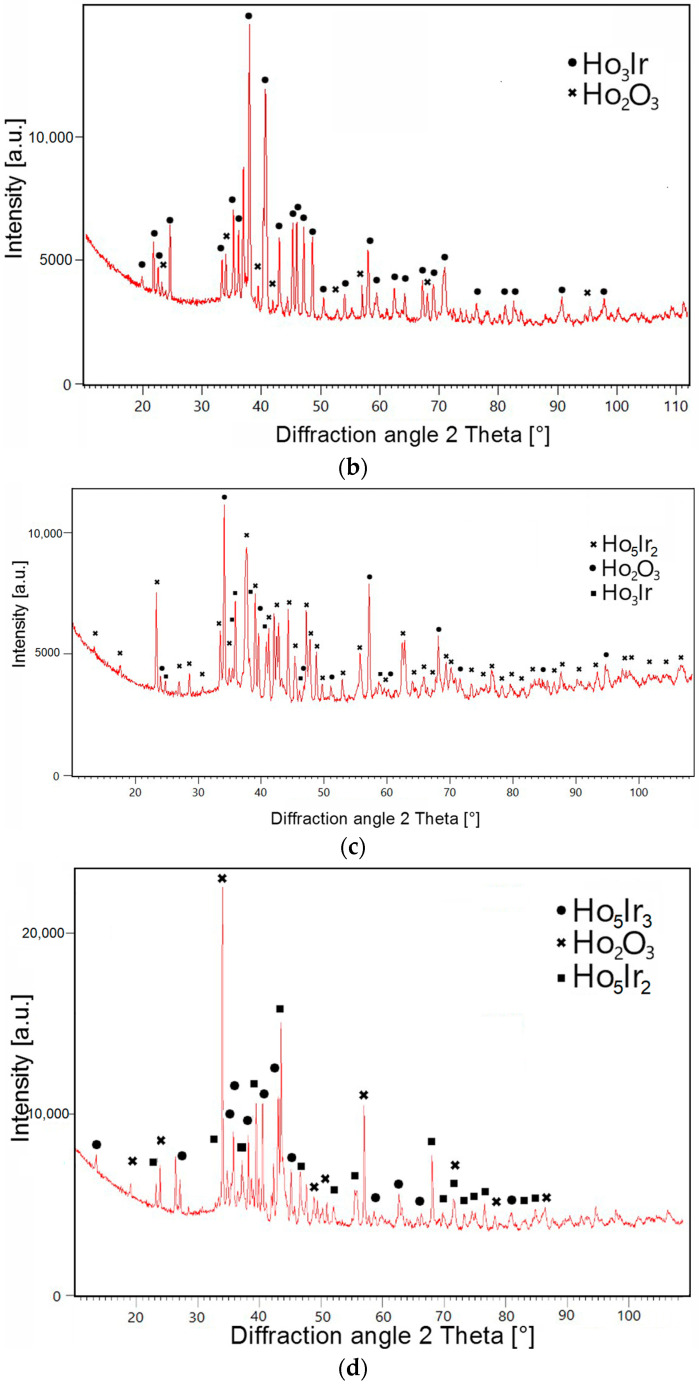
An experimental study of the phase equilibria of the Ho-rich part of the Ho-Ir-O ternary system at 1073 K by means of x-ray diffraction, differential scanning calorimetry, and scanning electron microscopy has been carried out. Ho-hcp and four binary compounds, namely Ho3Ir, Ho5Ir2, Ho5Ir3, and Ho2O3, were identified in the Ho-Ir-O model alloys after long-term annealing (350-1220 h). No solubility of iridium in Ho2O3 oxide and Ho-hcp was observed. No ternary phase was found. Based on the experimental results, an isothermal section of the Ho-rich part of the Ho-Ir-O system at 1073 K was constructed. In addition, the microstructure of as-cast alloys was studied. An irregular eutectic consisting of faceted Ho-phase in Ho3Ir phase was observed in the alloys with Ho-hcp + Ho3Ir + Ho2O3 phase composition, and the temperature of the eutectic reaction Ho-hcp + Ho3Ir ↔ liquid was determined.
Keywords: Ho-Ir-O system; eutectic microstructure; isothermal section; phase diagram; phase equilibria.
Conflict of interest statement
The authors declare no conflict of interest. The funders had no role in the design of the study, in the collection, analysis, or interpretation of data, in the writing of the manuscript, or in the decision to publish the result.
Figures


References
-
- Scapin M., Peroni L., Torregrosa C., Perillo-Marcone A., Calviani M., Pereira L.G., Léaux F., Meyer M. Experimental results and strength model identification of pure iridium. Int. J. Impact Eng. 2017;106:191–201. doi: 10.1016/j.ijimpeng.2017.03.019. - DOI
-
- Döhring T., Probst A.-C., Stollenwerk M., Emmerich F., Stehlíková V., Inneman A. Prototyping iridium coated mirrors for x-ray astronomy; Proceedings of the SPIE 10235, EUV and X-ray Optics: Synergy between Laboratory and Space V; Prague, Czech Republic. 31 May 2017; pp. 1023504–1023511. - DOI
-
- Baklanova N.I., Lozanov V.V., Titov A.T. The first evidence of the high oxidation resistance of the novel ternary tantalum-iridium-boron phase. Corros. Sci. 2019;160:108178. doi: 10.1016/j.corsci.2019.108178. - DOI
-
- López Ó., Padrón J.M. Iridium- and Palladium-Based Catalysts in the Pharmaceutical Industry. Catalysts. 2022;12:164. doi: 10.3390/catal12020164. - DOI
Grants and funding
LinkOut - more resources
Full Text Sources
Miscellaneous
