. 2023 Jul 26;28(15):5658.
doi: 10.3390/molecules28155658.

Modes of Action of a Novel c-MYC Inhibiting 1,2,4-Oxadiazole Derivative in Leukemia and Breast Cancer Cells

Affiliations

Modes of Action of a Novel c-MYC Inhibiting 1,2,4-Oxadiazole Derivative in Leukemia and Breast Cancer Cells

Min Zhou et al. Molecules. .

Abstract

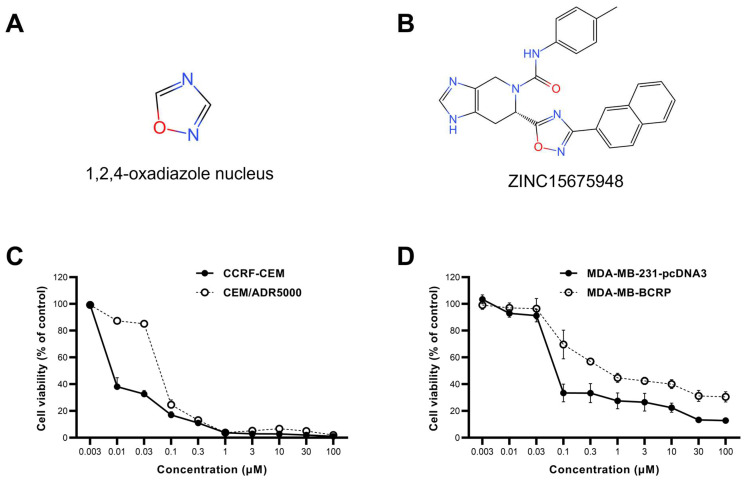
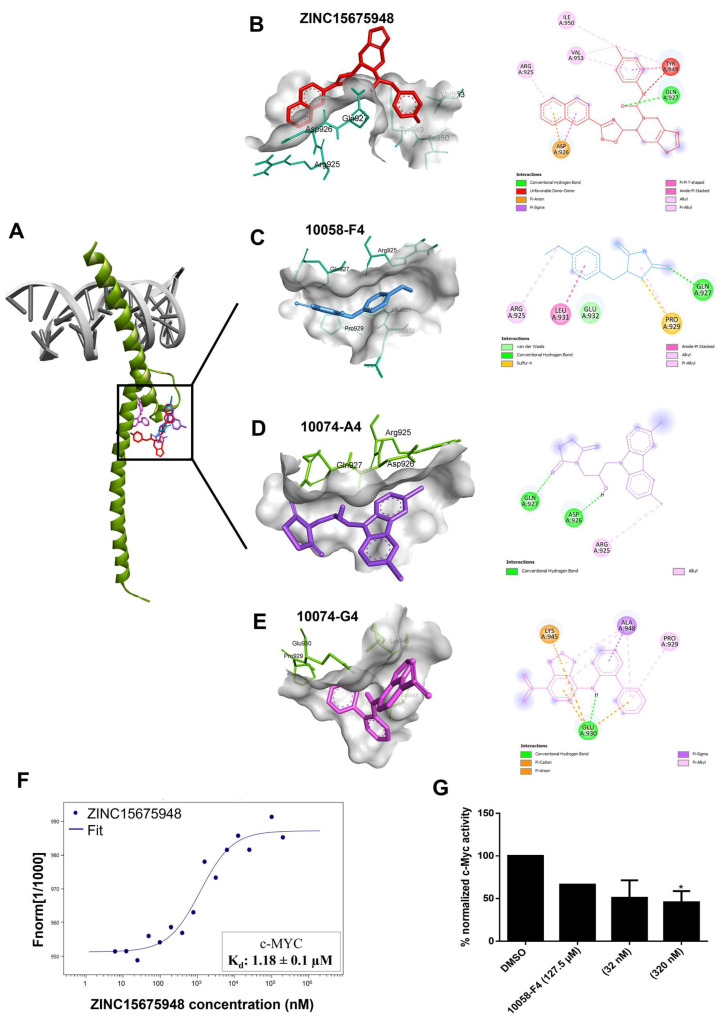
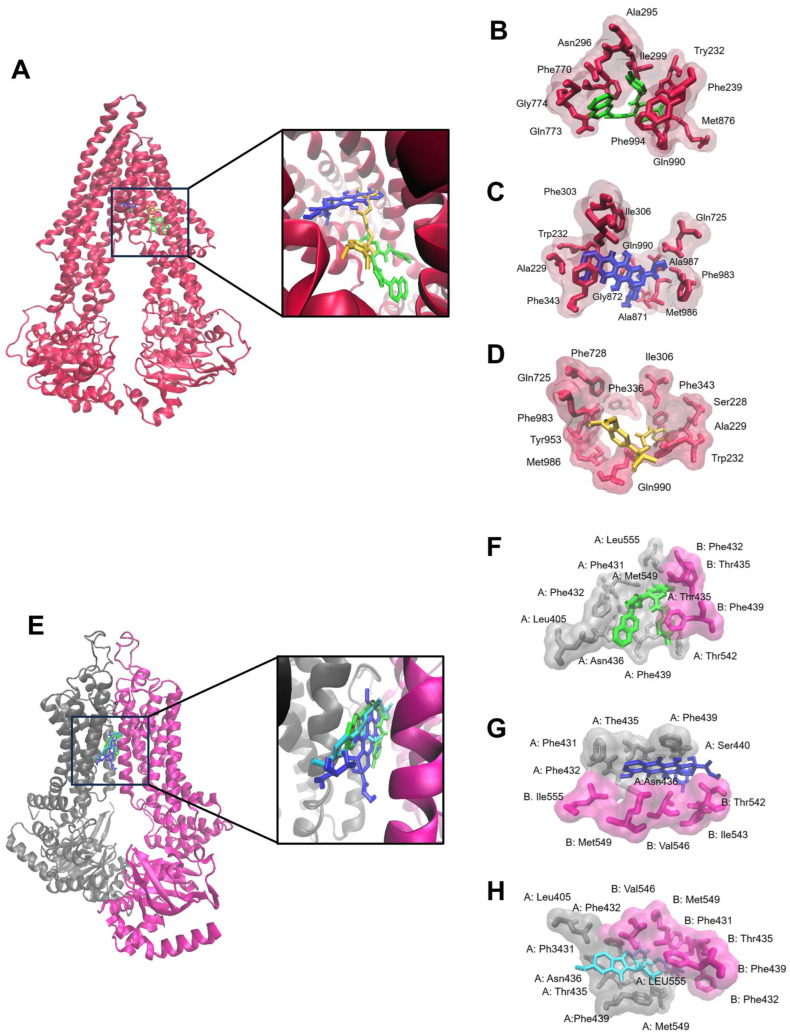
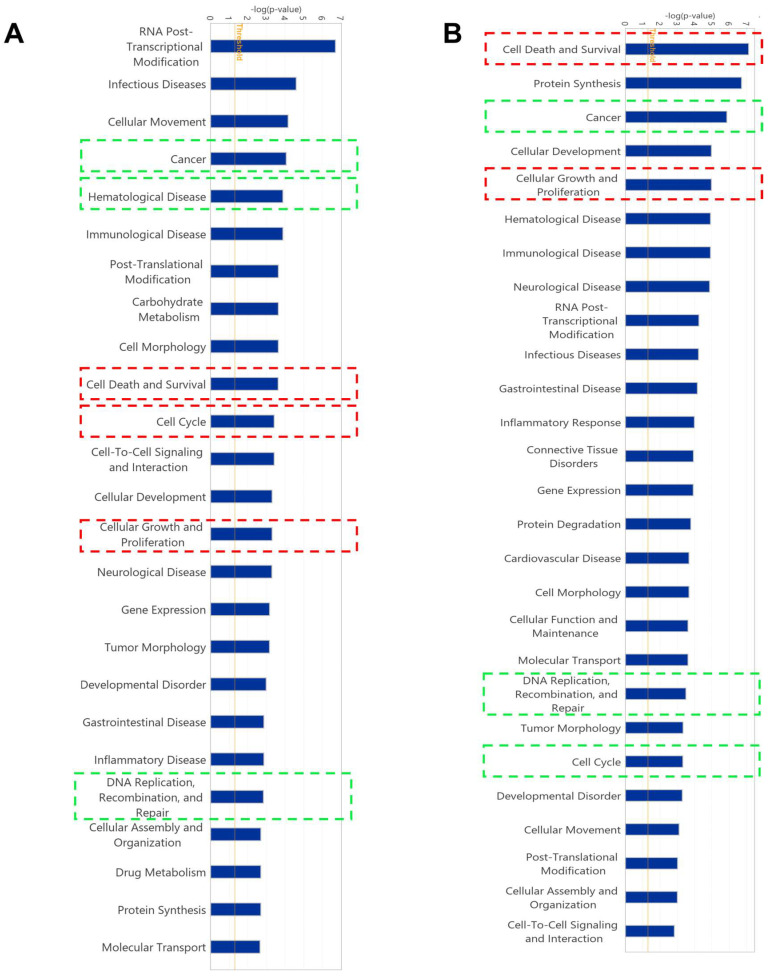
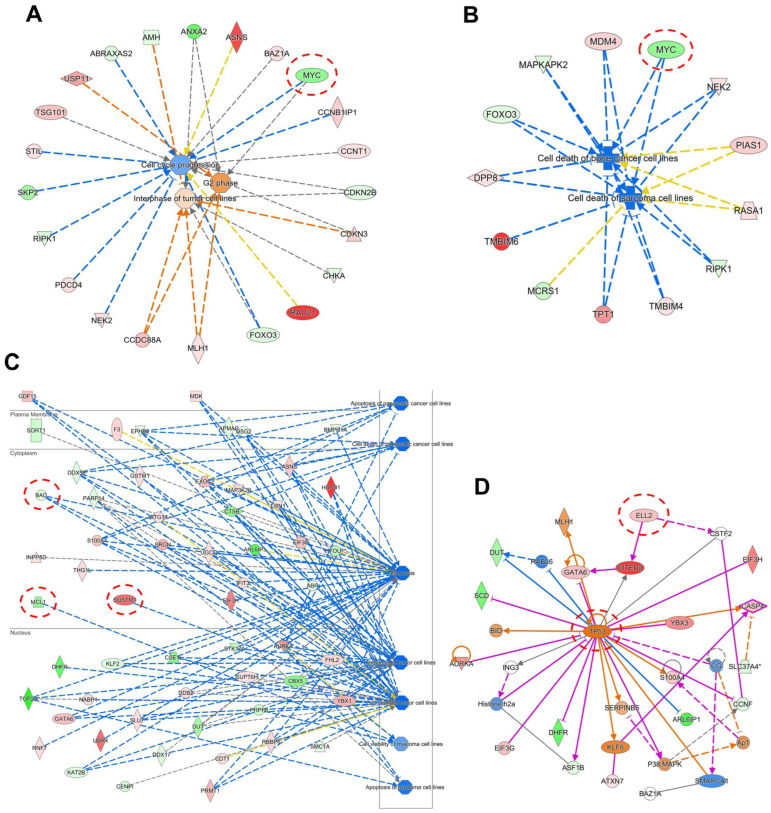
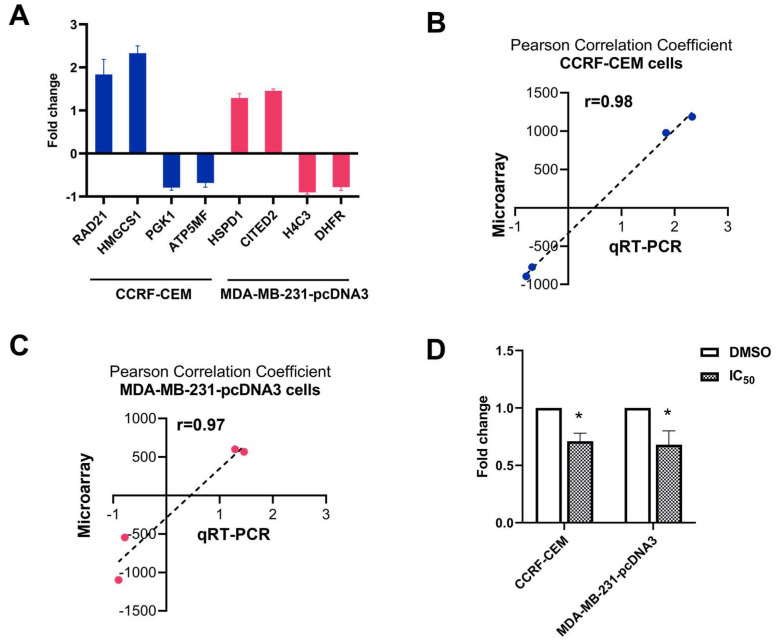
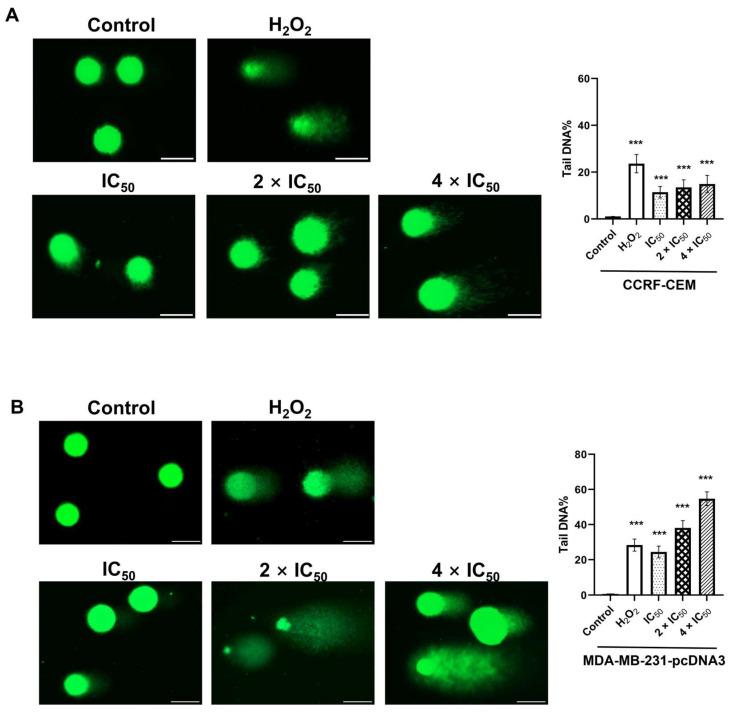
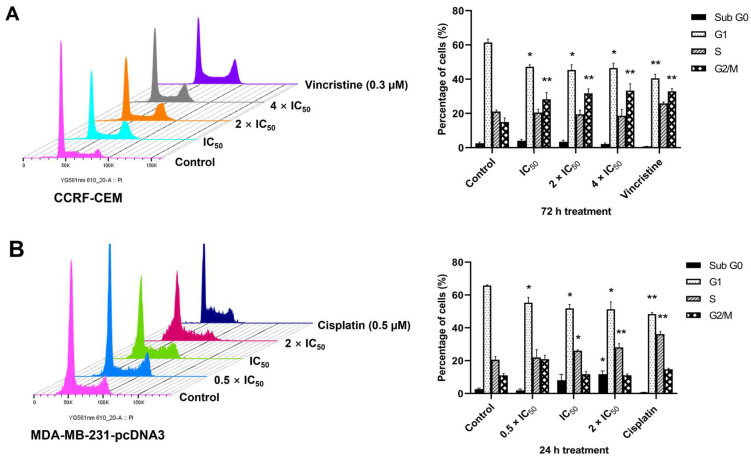
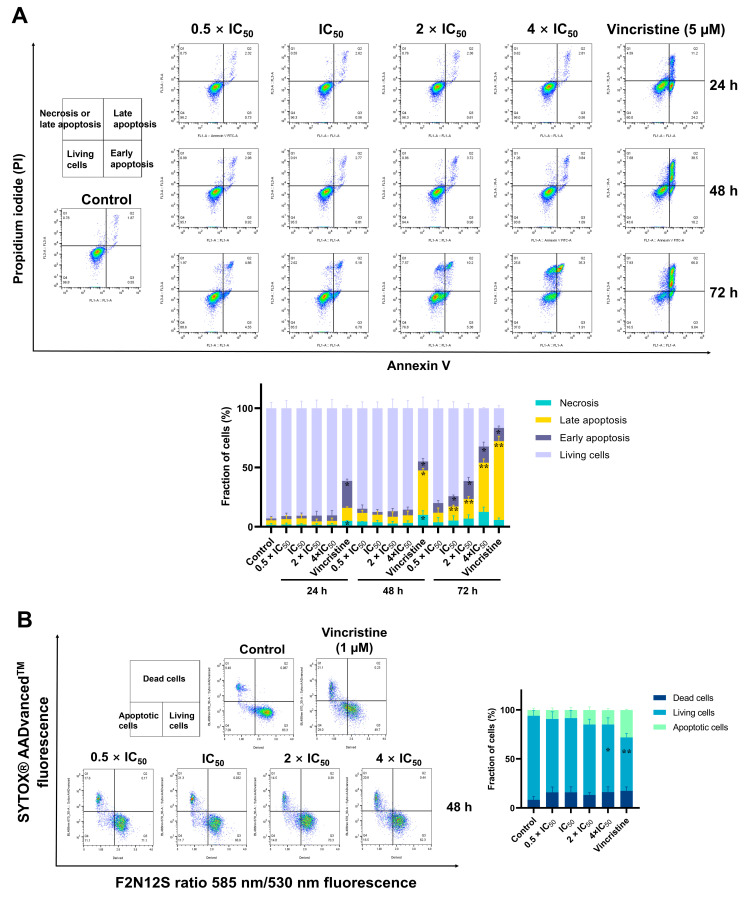
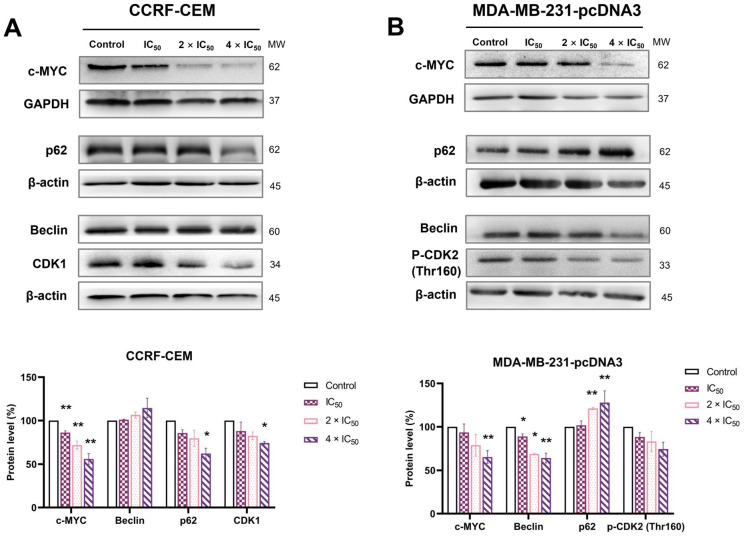
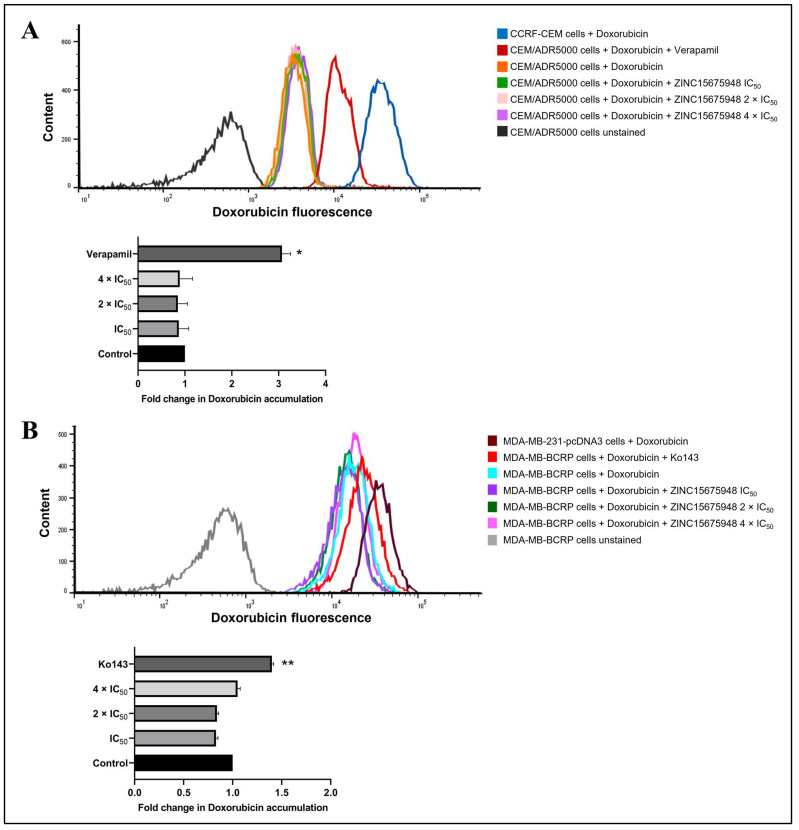
The c-MYC oncogene regulates multiple cellular activities and is a potent driver of many highly aggressive human cancers, such as leukemia and triple-negative breast cancer. The oxadiazole class of compounds has gained increasing interest for its anticancer activities. The aim of this study was to investigate the molecular modes of action of a 1,2,4-oxadiazole derivative (ZINC15675948) as a c-MYC inhibitor. ZINC15675948 displayed profound cytotoxicity at the nanomolar range in CCRF-CEM leukemia and MDA-MB-231-pcDNA3 breast cancer cells. Multidrug-resistant sublines thereof (i.e., CEM/ADR5000 and MDA-MB-231-BCRP) were moderately cross-resistant to this compound (<10-fold). Molecular docking and microscale thermophoresis revealed a strong binding of ZINC15675948 to c-MYC by interacting close to the c-MYC/MAX interface. A c-MYC reporter assay demonstrated that ZINC15675948 inhibited c-MYC activity. Western blotting and qRT-PCR showed that c-MYC expression was downregulated by ZINC15675948. Applying microarray hybridization and signaling pathway analyses, ZINC15675948 affected signaling routes downstream of c-MYC in both leukemia and breast cancer cells as demonstrated by the induction of DNA damage using single cell gel electrophoresis (alkaline comet assay) and induction of apoptosis using flow cytometry. ZINC15675948 also caused G2/M phase and S phase arrest in CCRF-CEM cells and MDA-MB-231-pcDNA3 cells, respectively, accompanied by the downregulation of CDK1 and p-CDK2 expression using western blotting. Autophagy induction was observed in CCRF-CEM cells but not MDA-MB-231-pcDNA3 cells. Furthermore, microarray-based mRNA expression profiling indicated that ZINC15675948 may target c-MYC-regulated ubiquitination, since the novel ubiquitin ligase (ELL2) was upregulated in the absence of c-MYC expression. We propose that ZINC15675948 is a promising natural product-derived compound targeting c-MYC in c-MYC-driven cancers through DNA damage, cell cycle arrest, and apoptosis.

Keywords: 1,2,4-oxadiazole; c-MYC inhibitor; leukemia; natural product derivative; oncogenes; triple-negative breast cancer.


Conflict of interest statement

The authors declare no conflict of interest.

Figures

Figure 1
Figure 1
The chemical structure and dose-response curve of ZINC15675948 determined by using the resazurin reduction assay. (A) 1,2,4-Oxadiazole nucleus. (B) Chemical structure of ZINC15675948. (C) Growth inhibition of ZINC15675948 toward leukemia CCRF-CEM and P-glycoprotein-overexpressing CEM/ADR5000 cell lines. (D) Growth inhibition of ZINC15675948 toward triple-negative breast cancer MDA-MB-231-pcDNA3 and BCRP overexpressing MDA-MB-BCRP cell lines. The data were plotted as mean ± SD from three independent experiments with each of the 6 parallel measurements.
Figure 2
Figure 2
Inhibition of c-MYC by ZINC15675948. (A) In silico molecular docking of ZINC15675948 and three known inhibitors 100F4-58, 10074-A4, and 10074-G5 to c-MYC. (B) Interacting amino acids of ZINC15675948 (red), (C) 10058-F4 (blue), (D) 10074-A4 (purple), (E) 10074-G4 (violet) interacting with c-MYC as visualized by Discovery Studio. (F) Binding kinetics of ZINC15675948 bound to c-MYC obtained by microscale thermophoresis. (G) Inhibition of c-MYC activity by ZINC15675948 as determined by a c-MYC reporter assay. Statistical significance (* p ≤ 0.05) was compared to DMSO (negative control). All experiments were performed three times independently.
Figure 3
Figure 3
Molecular docking of ZINC15675948 to the ABC transporters (A) P-gp and (E) BCRP. The proteins were presented in a new carton format. The ligands were displayed using a dynamic bond format with different colors: ZINC15675948 (green), doxorubicin (blue), verapamil (yellow), and Ko143 (cyan). The binding sites were visualized by P-gp residues that interact with (B) ZINC15675948, (C) doxorubicin, and (D) verapamil, as well as BCRP residues that interact with (F) ZINC15675948, (G) doxorubicin and (H) Ko143, are shown in a QuickSurf format.
Figure 4
Figure 4
Gene expression profiling as determined by Ingenuity Pathway Analysis (IPA) of CCRF-CEM and MDA-MB-231-pcDNA3 cells upon treatment with the IC50 concentration of ZINC15675948 for 24 h. Top cellular functions (red boxes) and diseases (green boxes) affected by ZINC15675948 in (A) CCRF-CEM and (B) MDA-MB-231-pcDNA3 cells. CCRF−CEM.
Figure 5
Figure 5
Molecular network generated using IPA software (content version: 51963813) from mRNA microarray hybridization affected by ZINC15675948 in CCRF-CEM and MDA-MB-231-pcDNA3 cells. (A) Cell cycle network in CCRF-CEM cells. The red circle highlights that c-MYC was downregulated and related to cell cycle regulation. (B) Cell death network in CCRF-CEM cells. The red circle highlights that c-MYC was also downregulated and involved in cell death. (C) Cell cycle network in MDA-MB-231-pcDNA3 cells. The red circles highlight that SQSTM1 (p62) was upregulated, while MCL-1 and BAD were downregulated. (D) The red circles highlight that TP53 and ELL2 were upregulated in MDA-MB-231-pcDNA3 cells.
Figure 6
Figure 6
Technical and biological verifications by qRT-PCR analyses in CCRF-CEM and MDA-MB-231-pcDNA3 cells upon treatment with the IC50 concentration of ZINC15675948 for 24 h. (A) Technical verifications of the top four deregulated genes in CCRF-CEM cells and MDA-MB-231-pcDNA3 cells, respectively. Linear regressions and Pearson correlation coefficients of microarray and qRT-PCR data obtained in (B) CCRF-CEM cells and (C) MDA-MB-231-pcDNA3 cells. (D) Downregulation of c-MYC expression in CCRF-CEM and MDA-MB-231-pcDNA3 cells upon treatment with ZINC15675948. Statistical significance (* p ≤ 0.05) was compared to control (DMSO). The results are represented as mean values ± SD of three independent experiments.
Figure 7
Figure 7
Analysis of DNA damage by single cell gel electrophoreses (alkaline comet assay) induced by ZINC15675948. Representative comet images captured in (A) CCRF-CEM and (B) MDA-MB-231-pcDNA3 cells treated with different concentrations for 24 h. H2O2 and DMSO served as positive or negative controls. Scale bar, 50 µm. The graph showed tail DNA percentage presented as mean values ± SEM from 50 comets. Statistical significance (*** p ≤ 0.001) was compared to DMSO.
Figure 8
Figure 8
Cell cycle analysis with ZINC15675948. (A) Histograms of cell cycle distribution in CCRF-CEM cells upon treatment with different concentrations of ZINC15675948 for 72 h. Vincristine and DMSO were used as positive and negative controls. (B) Histograms of cell cycle distribution in MDA-MB-231-pcDNA3 cells upon treatment with ZINC15675948 for 24 h. Cisplatin and DMSO were used as positive and negative controls. The results were represented as mean ± SD from three independent measurements. Statistical significance was analyzed using Student’s t-test, * p < 0.05, ** p < 0.01 compared with DMSO.
Figure 9
Figure 9
Detection of apoptosis induced by ZINC15675948 by flow cytometry. (A) Histograms of CCRF-CEM cells treated with different concentrations of ZINC15675948 for 24, 48, and 72 h. Vincristine (5 µM) and DMSO served as positive and negative controls. Apoptosis was detected using Annexin V and PI staining. (B) Histograms of MDA-MB-231-pcDNA3 cells treated with different concentrations of ZINC15675948 for 48 h. Vincristine (1 µM) and DMSO served as positive and negative controls. Apoptosis was determined using F2N12S and SYTOX® AADvancedTM dye. The experiments were performed three times independently. Statistical significance was analyzed using Student’s t-test, * p < 0.05, ** p < 0.01 vs. DMSO.
Figure 10
Figure 10
Western blot analysis of c-MYC and proteins involved in cell cycle and autophagy in (A) CCRF-CEM and (B) MDA-MB-231-pcDNA3 cells treated with various concentrations of ZINC15675948 for 24 h. Bands were normalized to GAPDH or β-actin for quantification (mean ± SEM). Error bars of three repetitions independently were shown. Statistical significance was shown by Student’s t-test, * p < 0.05, ** p < 0.01 compared with DMSO untreated cells.
Figure 11
Figure 11
Doxorubicin uptake assay with ZINC15675948. (A) Flow cytometric analysis of doxorubicin fluorescence intensity in unstained CEM/ADR5000 cells (autofluorescence, black), CEM/ADR5000 cells treated with doxorubicin (orange), doxorubicin in combination with ZINC15675948 IC50 (green), 2 × IC50 (pink), and 4 × IC50 (violet). CEM/ADR5000 cells treated with doxorubicin in combination with verapamil, a known P-gp inhibitor were used as a positive control. CCRF-CEM cells treated with doxorubicin (blue) were applied as a positive control for doxorubicin uptake. (B) Flow cytometric analysis of doxorubicin fluorescence intensity in unstained MDA-MB-BCRP cells (autofluorescence, red-brown), MDA-MB-BCRP cells treated with doxorubicin (cyan), doxorubicin in combination with ZINC15675948 IC50 (purple), 2 × IC50 (green), and 4 × IC50 (pink). MDA-MB-BCRP cells treated with doxorubicin in combination with Ko143 (red), a known BCRP inhibitor was used as a positive control. MDA-MB-231-pcDNA3 cells treated with doxorubicin (grey) were applied as a positive control for doxorubicin uptake. Quantification of fluorescence intensity is shown in the below bar diagram. Three replicates of the experiments were performed, and the results were shown as mean ± SD (* p ≤ 0.05, ** p ≤ 0.01, compared with doxorubicin-treated cells alone).

Similar articles

Cited by

References

    1. Bishop J.M. Molecular themes in oncogenesis. Cell. 1991;64:235–248. doi: 10.1016/0092-8674(91)90636-D. - DOI - PubMed
    1. Dang C.V. MYC on the path to cancer. Cell. 2012;149:22–35. doi: 10.1016/j.cell.2012.03.003. - DOI - PMC - PubMed
    1. Lourenco C., Resetca D., Redel C., Lin P., MacDonald A.S., Ciaccio R., Kenney T.M.G., Wei Y., Andrews D.W., Sunnerhagen M., et al. MYC protein interactors in gene transcription and cancer. Nat. Rev. Cancer. 2021;21:579–591. doi: 10.1038/s41568-021-00367-9. - DOI - PubMed
    1. Albihn A., Johnsen J.I., Henriksson M.A. MYC in oncogenesis and as a target for cancer therapies. Adv. Cancer Res. 2010;107:163–224. doi: 10.1016/s0065-230x(10)07006-5. - DOI - PubMed
    1. Sammak S., Hamdani N., Gorrec F., Allen M.D., Freund S.M.V., Bycroft M., Zinzalla G. Crystal structures and nuclear magnetic resonance studies of the apo form of the c-MYC: MAX bHLHZip complex reveal a helical basic region in the absence of DNA. Biochemistry. 2019;58:3144–3154. doi: 10.1021/acs.biochem.9b00296. - DOI - PMC - PubMed

Substances