. 2023 Aug 3;28(15):5865.
doi: 10.3390/molecules28155865.

Resveratrol Mitigates Bisphenol A-Induced Metabolic Disruptions: Insights from Experimental Studies

Affiliations

Resveratrol Mitigates Bisphenol A-Induced Metabolic Disruptions: Insights from Experimental Studies

Muhammad Sajid Hamid Akash et al. Molecules. .

Abstract

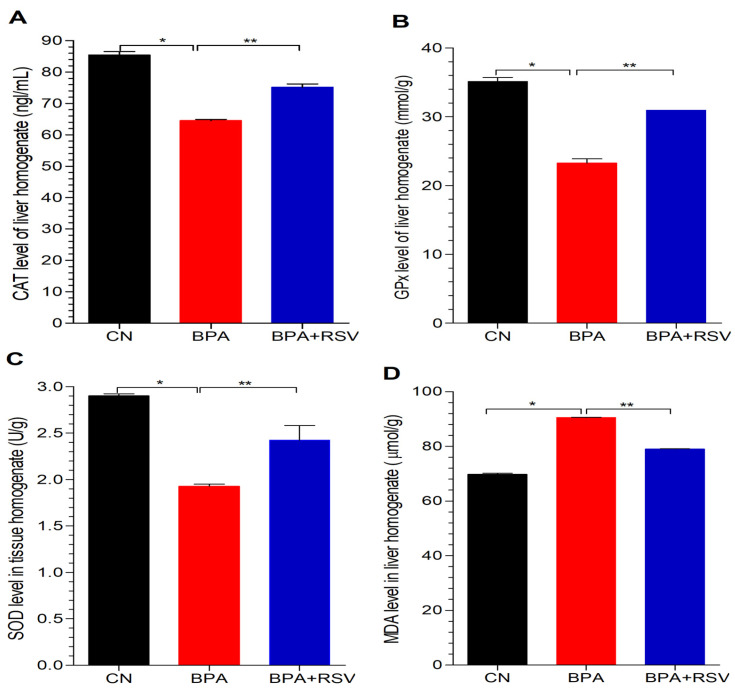
The aim of this study was to investigate the disruptions of metabolic pathways induced by bisphenol A (BPA) and explore the potential therapeutic intervention provided by resveratrol (RSV) in mitigating these disruptions through the modulation of biochemical pathways. Wistar albino rats were divided into three groups: group 1 served as the control, group 2 received 70 mg/Kg of BPA, and group 3 received 70 mg/kg of BPA along with 100 mg/Kg of RSV. After the treatment period, various biomarkers and gene expressions were measured to assess the effects of BPA and the potential protective effects of RSV. The results revealed that BPA exposure significantly increased the serum levels of α-amylase, α-glucosidase, G6PC, insulin, HbA1c, HMG-CoA reductase, FFAs, TGs, DPP-4, MDA, and proinflammatory cytokines such as TNF-α and IL-6. Concurrently, BPA exposure led to a reduction in the levels of antioxidant enzymes such as catalase (CAT), glutathione peroxidase (GPx), and superoxide dismutase (SOD), as well as GLUT4 and HDL cholesterol. However, the administration of RSV along with BPA significantly ameliorated these alterations in the biomarker levels induced through BPA exposure. RSV treatment effectively reduced the elevated levels of α-amylase, α-glucosidase, G6PC, insulin, HbA1c, HMG-CoA reductase, FFAs, TGs, DPP-4, MDA, and proinflammatory cytokines, while increasing the levels of antioxidant enzymes, GLUT4, and HDL cholesterol. Furthermore, BPA exposure suppressed the mRNA expression of glucokinase (GCK), insulin-like growth factor 1 (IGF-1), and glucose transporter 2 (GLUT2) and up-regulated the mRNA expression of uncoupling protein 2 (UCP2), which are all critical biomarkers involved in glucose metabolism and insulin regulation. In contrast, RSV treatment effectively restored the altered mRNA expressions of these biomarkers, indicating its potential to modulate transcriptional pathways and restore normal metabolic function. In conclusion, the findings of this study strongly suggest that RSV holds promise as a therapeutic intervention for BPA-induced metabolic disorders. By mitigating the disruptions in various metabolic pathways and modulating gene expressions related to glucose metabolism and insulin regulation, RSV shows potential in restoring normal metabolic function and counteracting the adverse effects induced by BPA exposure. However, further research is necessary to fully understand the underlying mechanisms and optimize the dosage and duration of RSV treatment for maximum therapeutic benefits.

Keywords: Glucokinase; RT-qPCR; endocrine disruptor; insulin growth factor 1; metabolic disorders; uncoupling protein 2.


Conflict of interest statement

Authors declare that they do not have any conflict of interest for this article.

Figures

Figure 1
Figure 1
Effect of treatment on (A) weight and (B) BMI. Data analyzed with two-way ANOVA, and Bonferroni’s multiple comparison test was used as a posttest to compare all pairs of columns; * indicates p < 0.05 when compared with control group, ** indicates p < 0.05 when compared with BPA treated group with control and RSV treated group, respectively.
Figure 2
Figure 2
Effect of treatment on fasting blood glucose levels. Data analyzed with two-way ANOVA, and Bonferroni’s multiple comparison test was used as a posttest to compare all pairs of columns; * indicates p < 0.05 when compared with control group, ** indicates p < 0.05 when compared with BPA-exposed group.
Figure 3
Figure 3
Effect of treatment on (A) insulin, (B) HbA1c, (C) HOMA-IR, and (D) DPP-4. Data analyzed with one-way ANOVA, and Bonferroni’s multiple comparison test was used as a posttest to compare all pairs of columns; * indicates p < 0.05 when compared with control group, ** indicates p < 0.05 when compared with BPA-exposed group.
Figure 4
Figure 4
Effect of treatment on (A) TGs, (B) FFAs, (C) HDL, and (D) HMG-CoA reductase. Data analyzed with one-way ANOVA, and Bonferroni’s multiple comparison test was used as a posttest to compare all pairs of columns; * indicates p < 0.05 when compared with control group, ** indicates p < 0.05 when compared with BPA-exposed group.
Figure 5
Figure 5
Effect of treatment on (A) alpha amylase, (B) alpha glucosidase, (C) G6PC = glucose 6 Phosphatase, and (D) GLUT4 = glucose transporters 4. Data analyzed with one-way ANOVA, and Bonferroni’s multiple comparison test was used as a posttest to compare all pairs of columns; * indicates p < 0.05 when compared with control group, ** indicates p < 0.05 when compared with BPA-exposed group.
Figure 6
Figure 6
Effect of treatment on (A) CAT = catalase, (B) GSH = glutathione, (C) SOD = superoxide dismutase, and (D) MDA = Malondialdehyde. Data analyzed with one-way ANOVA, and Bonferroni’s multiple comparison test was used as a posttest to compare all pairs of columns; * indicates p < 0.05 when compared with control group, ** indicates p < 0.05 when compared with BPA-exposed group.
Figure 7
Figure 7
Effect of treatment on (A) leptin, (B) adiponectin, (C) TNF-α, and (D) IL-6. Data analyzed with one-way ANOVA, and Bonferroni’s multiple comparison test was used as a posttest to compare all pairs of columns; * indicates p < 0.05 when compared with control group, ** indicates p < 0.05 when compared with BPA-exposed group.
Figure 8
Figure 8
Effect of BPA and RSV on mRNA expression (GCK, UCP2, IGF-1, and GLUT2). Data analyzed with two-way ANOVA, and Bonferroni’s multiple comparison test was used as a posttest to compare all pairs of columns; * indicates p < 0.05 when compared with control group, ** indicates p < 0.05 when compared with BPA-exposed group.
Figure 9
Figure 9
Photomicrographs of pancreas (AC) and liver (DF). (A) The circle is showing normal pancreatic appearance as Islets of Langerhans are present throughout the parenchyma which is an indication of active pancreatic parenchyma. (B) The arrow indicates that Islets of Langerhans are less in number which indicates necrotic changes in the pancreas. (C) The circle indicates the normal appearance of pancreas. (D) The circle shows the normal appearance of hepatic parenchyma and nuclei of the hepatocytes. (E) The arrow indicates vacuolar degradation and hazy vacuole, the circle is indicating perivascular cuffing, the triangle is indicating inflammatory zone, and the rectangle is indicating periportal fibrosis. (F) The circle indicates the normal appearance of nuclei and rectangle is showing condensed and pyknotic nuclei.
Figure 10
Figure 10
Quantitative analysis of histopathological examination. (A) Number of islets of Langerhans, (B), Necrotic changes, (C) necrosis in hepatic parenchyma, (D) pyknosis, (E) inflammation and (F) fibrosis. Data analyzed with one-way ANOVA, and Bonferroni’s multiple comparison test was used as a posttest to compare all pairs of columns.
Figure 11
Figure 11
Mechanism of BPA-induced impaired metabolic pathways and its amelioration with RSV. BPA-intoxication-induced impaired carbohydrate and lipid metabolism occurs, possibly via the activation of various intracellular signal transduction pathways.

Similar articles

Cited by

References

    1. Fang C., Ning B., Waqar A.B., Niimi M., Li S., Satoh K., Shiomi M., Ye T., Dong S., Fan J. Bisphenol A exposure induces metabolic disorders and enhances atherosclerosis in hyperlipidemic rabbits. J. Appl. Toxicol. 2015;35:1058–1070. doi: 10.1002/jat.3103. - DOI - PubMed
    1. Akash M.S.H., Sabir S., Rehman K. Bisphenol A-induced metabolic disorders: From exposure to mechanism of action. Environ. Toxicol. Pharmacol. 2020;77:103373. doi: 10.1016/j.etap.2020.103373. - DOI - PubMed
    1. Haq M.E.U., Akash M.S.H., Rehman K., Mahmood M.H. Chronic exposure of bisphenol A impairs carbohydrate and lipid metabolism by altering corresponding enzymatic and metabolic pathways. Environ. Toxicol. Pharmacol. 2020;78:103387. doi: 10.1016/j.etap.2020.103387. - DOI - PubMed
    1. Akash M.S.H., Ejaz ul Haq M., Sharif H., Rehman K. Bisphenol A and Neurological Disorders: From Exposure to Preventive Interventions. In: Akash M.S.H., Rehman K., editors. Environmental Contaminants and Neurological Disorders. Springer International Publishing; Cham, Switherland: 2021. pp. 185–200.
    1. Bonefeld-Jørgensen E.C., Long M., Hofmeister M.V., Vinggaard A.M. Endocrine-disrupting potential of bisphenol A, bisphenol A dimethacrylate, 4-n-nonylphenol, and 4-n-octylphenol in vitro: New data and a brief review. Environ. Health Perspect. 2007;115((Suppl. S1)):69–76. doi: 10.1289/ehp.9368. - DOI - PMC - PubMed