. 2023 Aug 5;28(15):5898.
doi: 10.3390/molecules28155898.

Identification of Bacterial Metabolites Modulating Breast Cancer Cell Proliferation and Epithelial-Mesenchymal Transition

Affiliations

Identification of Bacterial Metabolites Modulating Breast Cancer Cell Proliferation and Epithelial-Mesenchymal Transition

Gyula Ujlaki et al. Molecules. .

Abstract

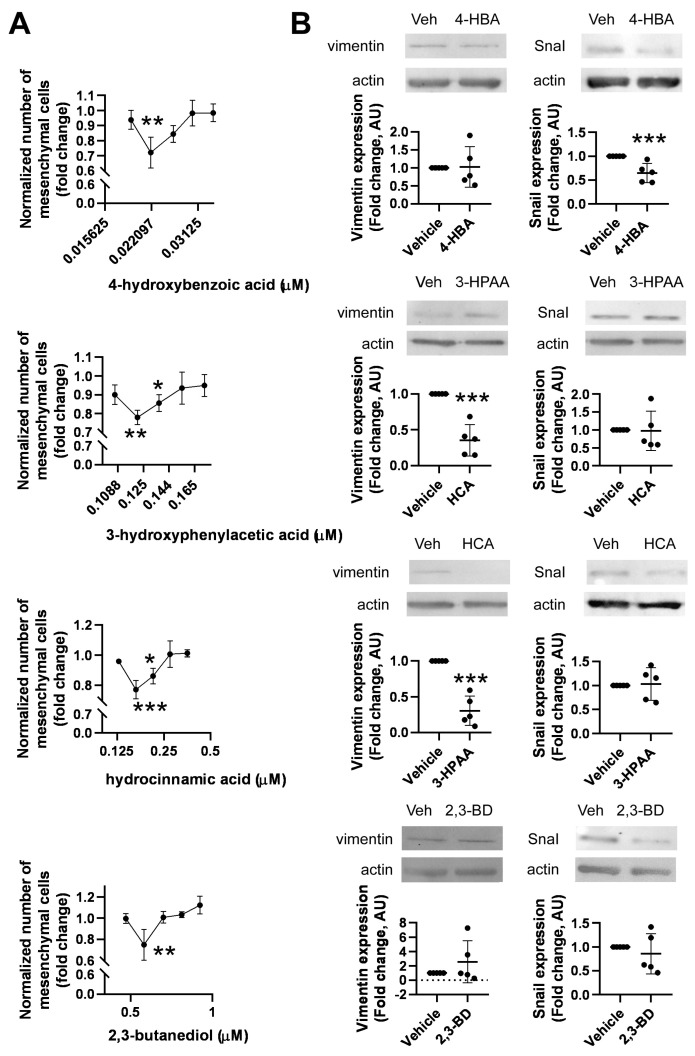
Breast cancer patients are characterized by the oncobiotic transformation of multiple microbiome communities, including the gut microbiome. Oncobiotic transformation of the gut microbiome impairs the production of antineoplastic bacterial metabolites. The goal of this study was to identify bacterial metabolites with antineoplastic properties. We constructed a 30-member bacterial metabolite library and screened the library compounds for effects on cell proliferation and epithelial-mesenchymal transition. The metabolites were applied to 4T1 murine breast cancer cells in concentrations corresponding to the reference serum concentrations. However, yric acid, glycolic acid, d-mannitol, 2,3-butanediol, and trans-ferulic acid exerted cytostatic effects, and 3-hydroxyphenylacetic acid, 4-hydroxybenzoic acid, and vanillic acid exerted hyperproliferative effects. Furthermore, 3-hydroxyphenylacetic acid, 4-hydroxybenzoic acid, 2,3-butanediol, and hydrocinnamic acid inhibited epithelial-to-mesenchymal (EMT) transition. We identified redox sets among the metabolites (d-mannitol-d-mannose, 1-butanol-butyric acid, ethylene glycol-glycolic acid-oxalic acid), wherein only one partner within the set (d-mannitol, butyric acid, glycolic acid) possessed bioactivity in our system, suggesting that changes to the local redox potential may affect the bacterial secretome. Of the nine bioactive metabolites, 2,3-butanediol was the only compound with both cytostatic and anti-EMT properties.

Keywords: 2,3-butanediol; 3-hydroxyphenylacetic acid; 4-hydroxybenzoic acid; bacterial metabolite; breast cancer; butyric acid; d-mannitol; dysbiosis; epithelial-mesenchymal transition; glycolic acid; high content screening; hydrocinnamic acid; metabolite signaling; microbiome; proliferation; secretome; trans-ferulic acid; vanillic acid.


Conflict of interest statement

Bai is a shareholder and CEO of Holobiont Diagnostics Ltd., which are involved in the development of microbiome-based diagnostic tools. Other authors declare no conflict of interest.

Figures

Figure 1
Figure 1
Validation of the methods used to assess cell proliferation. (A) The indicated number of cells were plated in 96-well plates for the SRB assay or PerkinElmer CellCarrier Ultra 96-well plates for the two high-content screening methods. On the following day, either the SRB assay or high-content screening method was conducted. For high-content screening, the nuclei were stained with DAPI, images were segmented using CellProfiler or the deep learning-based method, and nuclei numbers were counted using CellProfiler. The red lines indicate a 45° line, indicating the same number of cells as seeded. (B) Representative phase-contrast images of the wells containing the indicated number of cells. Abbreviations: DL—deep learning.
Figure 2
Figure 2
Identification of cytostatic bacterial metabolites in 4T1 breast cancer cells. The cells (800 4T1 cells/well) were plated in PerkinElmer CellCarrier Ultra 96-well plates and treated with the indicated metabolites at the specified concentrations for 48 h. Measurements were repeated at least three times using four technical replicates. Images were acquired and segmented using CellProfiler or the DL algorithm. Nuclei were counted in segmented images using CellProfiler. Data are represented as averages ± SDs of biological replicates. Values were normalized to vehicle-treated cells and expressed as fold changes. Each metabolite was statistically analyzed separately. (A) A heatmap representation of the effects of the metabolites on 4T1 cell proliferation. (B) The effects of the metabolites on 4T1 cell proliferation. Metabolite concentrations are displayed on the logarithmic axes. * and ** indicate statistically significant differences between vehicle-treated cells (control) and cells treated with the metabolite at p < 0.05 and p < 0.01, respectively. Abbreviations: DL—deep learning segmentation, CP—CellProfiler’s built-in method segmentation.
Figure 3
Figure 3
High-content screening-based methods can detect changes in cell morphology and indicate EMT. (A) 1.5 × 10⁶ 4T1 cells were plated in Petri dishes and treated with TGFβ or SB-431542 for 48 h. Cellular proteins were assessed using Western blotting with the indicated antibodies. Sample blots are shown along with their densitometric evaluation presented as means ± SD. Values were normalized to vehicle-treated (control) cells. (B) 800 4T1 cells/well were plated in PerkinElmer CellCarrier Ultra 96-well plates and treated with TGFβ or SB-431542 for 48 h. Nuclei were stained with DAPI, and cells were visualized using Texas Red-X Phalloidin. The images were segmented using the Harmony software (version 3.1.8) (PerkinElmer, Waltham, MA, USA) to identify cells with epithelial or mesenchymal morphology. Proportions of mesenchymal cells were normalized to total cell number and for inter-sample cell number differences. Normality was tested, and statistical significance was calculated as described in the Methods. Representative fluorescence microscopy images are presented. The scale bar equals 10 µm. *, **, and *** indicate statistically significant differences between vehicle-treated (control) cells and treated cells at p < 0.05, p < 0.01, and p < 0.001, respectively. Abbreviations: CTL—control, SB—SB-431542, TGFβ—transforming growth factor β.
Figure 4
Figure 4
Identification of bioactive bacterial metabolites that suppress EMT. 800 4T1 cells/well were seeded in PerkinElmer CellCarrier Ultra 96-well plates and treated with the indicated metabolites at the concentrations specified in Table 1 for 48 h. The acquired images were segmented using the Harmony software (version 3.1.8) (PerkinElmer) to identify cells with epithelial or mesenchymal morphology. Proportions of the mesenchymal cells were normalized to total cell numbers within a sample and to inter-sample cell number differences. Normality was assessed, and statistical significance was calculated as described in the Methods. Each metabolite was statistically analyzed separately. ** and *** indicate statistically significant differences between vehicle-treated (control) cells and cells treated with a compound at p < 0.01 and p < 0.001, respectively. Abbreviations: CC 1–5—concentrations indicated in Table 1, the number references increasing doses.
Figure 5
Figure 5
Identification of bioactive bacterial metabolites that suppress EMT. (A) 800 4T1 cells were plated on PerkinElmer CellCarrier Ultra 96-well plates and treated with the indicated metabolites at the concentrations specified in Table 1 for 48 h. The acquired images were segmented using the Harmony software (version 3.1.8) (PerkinElmer) to identify cells with epithelial or mesenchymal morphology. Proportions of the mesenchymal cells were normalized to total cell number within a sample and to inter-sample cell number differences. Normality was assessed, and statistical significance was calculated as described in the Methods. Each metabolite was statistically analyzed separately. (B) 1.5 × 10⁶ 4T1 cells were plated in Petri dishes and treated with the indicated metabolites at the concentrations specified in Table 1 for 48 h. Cellular proteins were assessed using Western blotting with the indicated antibodies. Sample blots and densitometry are shown (mean ± SD). Values were normalized to vehicle-treated (control) cells. *, **, and *** indicate statistically significant differences between vehicle-treated (control) cells and cells treated with a compound at p < 0.05, p < 0.01, and p < 0.001, respectively.
Figure 6
Figure 6
The biological and redox properties of bioactive bacterial metabolites were identified in this study. (A) Venn diagram of the bioactive metabolites highlighting their effects on cell proliferation and EMT. The arrows indicate the direction of changes (up—enhancement, down—inhibition); the green arrows indicate effects on cell proliferation, and the red arrows represent effects on EMT. (B) The schematic representation of the possible effects of the redox potential of the environment on the antiproliferative activity of the metabolites.

Similar articles

Cited by

References

    1. Dafni U., Tsourti Z., Alatsathianos I. Breast Cancer Statistics in the European Union: Incidence and Survival across European Countries. Breast Care. 2019;14:344–353. doi: 10.1159/000503219. - DOI - PMC - PubMed
    1. Miller K.D., Nogueira L., Mariotto A.B., Rowland J.H., Yabroff K.R., Alfano C.M., Jemal A., Kramer J.L., Siegel R.L. Cancer treatment and survivorship statistics, 2019. CA Cancer J. Clin. 2019;69:363–385. doi: 10.3322/caac.21565. - DOI - PubMed
    1. Thomas R.M., Jobin C. The Microbiome and Cancer: Is the ‘Oncobiome’ Mirage Real? Trends Cancer. 2015;1:24–35. doi: 10.1016/j.trecan.2015.07.005. - DOI - PMC - PubMed
    1. Urbaniak C., Gloor G.B., Brackstone M., Scott L., Tangney M., Reid G. The Microbiota of Breast Tissue and Its Association with Breast Cancer. Appl. Environ. Microbiol. 2016;82:5039–5048. doi: 10.1128/AEM.01235-16. - DOI - PMC - PubMed
    1. Hieken T.J., Chen J., Hoskin T.L., Walther-Antonio M., Johnson S., Ramaker S., Xiao J., Radisky D.C., Knutson K.L., Kalari K.R., et al. The Microbiome of Aseptically Collected Human Breast Tissue in Benign and Malignant Disease. Sci. Rep. 2016;6:30751. doi: 10.1038/srep30751. - DOI - PMC - PubMed