. 2023 Aug 3;23(15):6891.
doi: 10.3390/s23156891.

A Methodology to Model the Rain and Fog Effect on the Performance of Automotive LiDAR Sensors

Affiliations

A Methodology to Model the Rain and Fog Effect on the Performance of Automotive LiDAR Sensors

Arsalan Haider et al. Sensors (Basel). .

Abstract

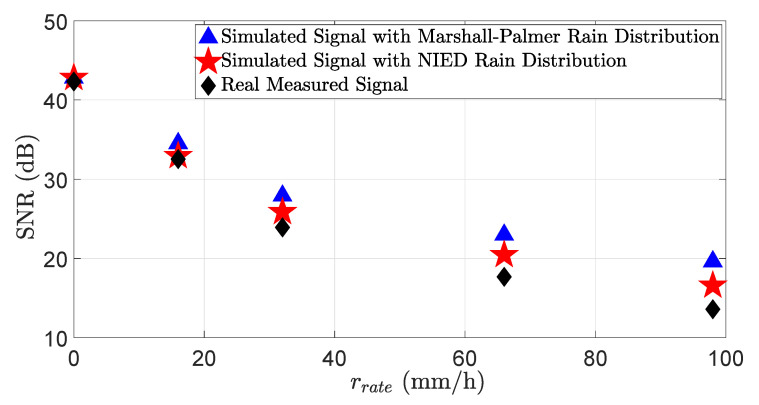
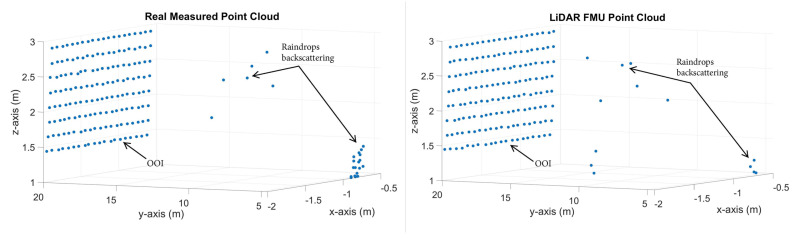
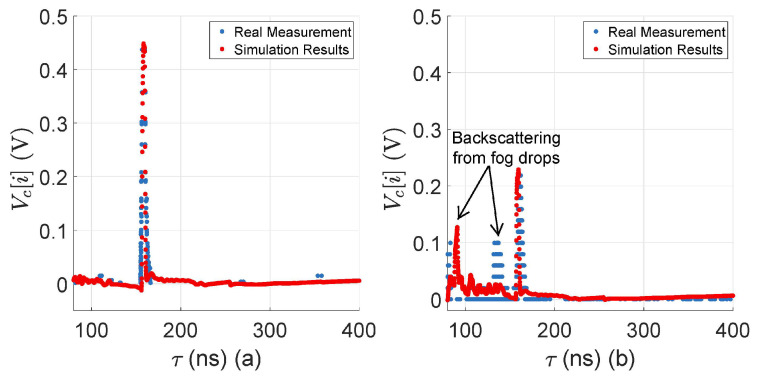
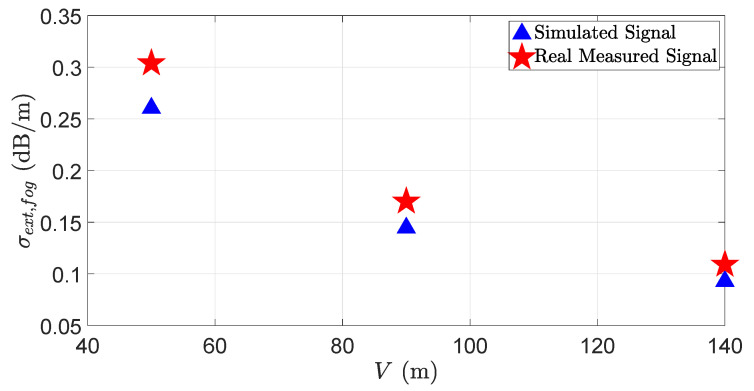
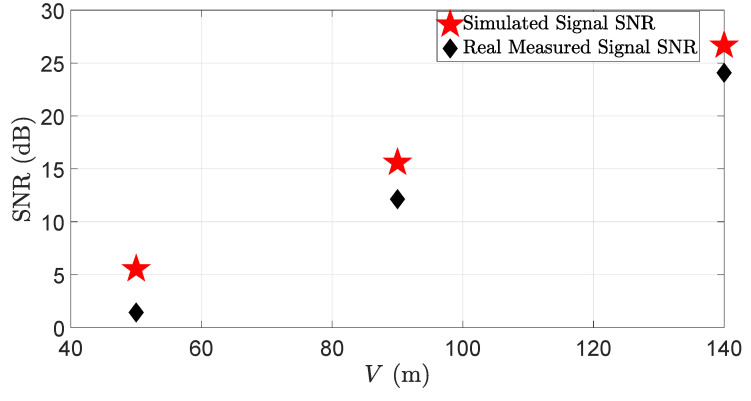
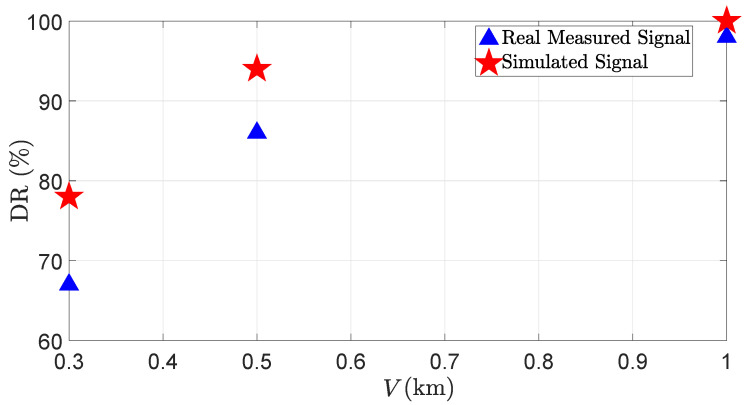
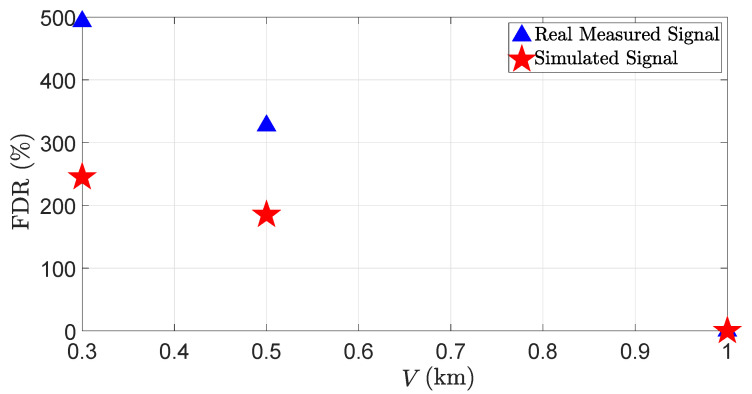
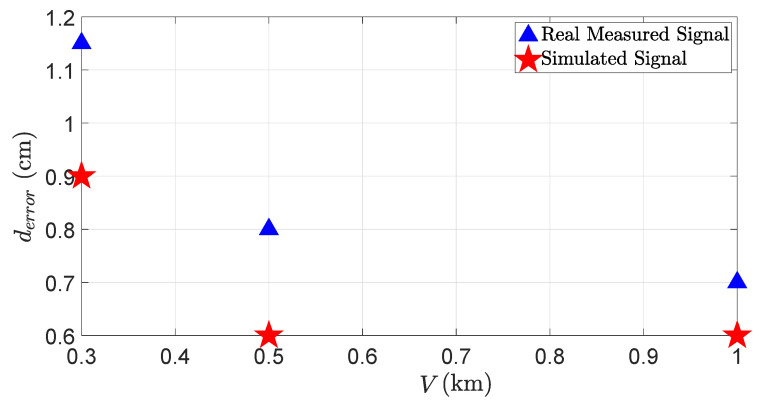
In this work, we introduce a novel approach to model the rain and fog effect on the light detection and ranging (LiDAR) sensor performance for the simulation-based testing of LiDAR systems. The proposed methodology allows for the simulation of the rain and fog effect using the rigorous applications of the Mie scattering theory on the time domain for transient and point cloud levels for spatial analyses. The time domain analysis permits us to benchmark the virtual LiDAR signal attenuation and signal-to-noise ratio (SNR) caused by rain and fog droplets. In addition, the detection rate (DR), false detection rate (FDR), and distance error derror of the virtual LiDAR sensor due to rain and fog droplets are evaluated on the point cloud level. The mean absolute percentage error (MAPE) is used to quantify the simulation and real measurement results on the time domain and point cloud levels for the rain and fog droplets. The results of the simulation and real measurements match well on the time domain and point cloud levels if the simulated and real rain distributions are the same. The real and virtual LiDAR sensor performance degrades more under the influence of fog droplets than in rain.

Keywords: LiDAR sensor; Mie theory; advanced driver-assistance system; backscattering; fog; functional mock-up interface; functional mock-up unit; open simulation interface; rain; sunlight.


Conflict of interest statement

The authors declare no conflict of interest.

Figures

Figure 1
Figure 1
LiDAR working principle. The LiDAR sensor mounted on the ego vehicle simultaneously sends and receives laser light, which is partly reflected off the surface of the target, in order to measure the distance [4].
Figure 2
Figure 2
Co-simulation framework of the proposed approach to model the rain and fog effect in a virtual LiDAR sensor.
Figure 3
Figure 3
Exemplary scan pattern of Cube 1. ±36° horizontal and ±15° vertical FoV, 50 scan lines, 0.4° horizontal angle spacing, frame rate 5.4 Hz, maximum detection range 250 m, and minimum detection range 1.5 m.
Figure 4
Figure 4
Exemplary visualization of a rain field generated by sprinklers resembling a real-world rain simulator.
Figure 5
Figure 5
The geometry of a LiDAR ray from near-field to range r1 considering beam divergence.
Figure 6
Figure 6
(a) Real setup to validate the time domain and point cloud data. (b) Static simulation scene to validate the time domain and point cloud data. The 3%-reflective target with an area of 1.3 m × 1.3 m was placed in front of the sensor at different distances. The actual and the simulated sensor and target coordinates are the same. The ground truth distance dGT is calculated from the sensor’s origin to the target’s center.
Figure 7
Figure 7
(a) LiDAR FMU and real measured TDS comparison obtained from the surface of a 10%-reflective Lambertian plate at 20 m without rain. The target peaks and noise levels match well. (b) LiDAR FMU and real measured TDS comparison obtained from the surface of a 10%-reflective Lambertian plate placed at 20 m with 16 mm/h rain rate rrate. The target peaks and the amplitude level of the backscattered raindrops match well. It should be noted that the relative distance is calculated from the internal reflection to the target peaks.
Figure 8
Figure 8
Simulated and real LiDAR signals attenuation σext,rain due to different rain rates rrate. The simulation results with Marshall–Palmer, NIED rain distribution, and real measurements match very well at lower rain rates. However, as the rain rate increases, the simulation and real measurement signal attenuation mismatch also increases, especially for the simulation results with the Marshall–Palmer rain distribution.
Figure 9
Figure 9
The SNR of the simulated and real measured signals in different rain rates rrate. The simulation and real measurement results match very well at lower rain rates, but the mismatch between the simulated and real SNR increases as the rain rate increases, especially for the simulation results with the Marshall–Palmer rain distribution.
Figure 10
Figure 10
The exemplary visualization of simulated and real point clouds obtained in 32 mm/h rain rate rrate.
Figure 11
Figure 11
(a) The real setup for the fog measurement. (b) The static simulation scene for the validation of the fog effect. The 3%-reflective Lambertian plate was placed at a 15.3 m distance. The real and virtual LiDAR sensor and targets coordinates are the same.
Figure 12
Figure 12
(a) LiDAR FMU and real measured TDS obtained from the surface of a 3%-reflective plate placed at 15.3 m without fog. The target peaks and noise levels match well. (b) LiDAR FMU and real measured TDS obtained from the surface of a 3%-reflective plate at 15.3 m with a fog visibility V of 140 m. It should be noted that the relative distance is calculated from the internal reflection to the target peaks.
Figure 13
Figure 13
The real and virtual LiDAR signals attenuation σext,fog due to the different visibility distances V. The simulation and real measurement results match well at the higher visibility distances. However, as the visibility distance decreases due to fog, the simulated and real measured signal attenuation mismatch increases.
Figure 14
Figure 14
The SNR of the simulated and real measured signals with different visibility distances V. The simulation and real measurement results match well at the higher visibility distances, but the mismatch between the simulated and real measured SNR increases as the visibility distance decreases.
Figure 15
Figure 15
The DR of the LiDAR sensor for the real and virtual 3%-reflective Lambertian plate with different visibility distances V. The simulation and real measurements show good correlations.
Figure 16
Figure 16
The FDR of the LiDAR sensor for a real and virtual 3%-reflective Lambertian plate with different visibility distances V. The FDR increases with a decrease in the visibility distances. It should be noted that FDR 300% or 500% shows that the LiDAR reflections received from the fog droplets are 3 or 5 times more than those obtained from the OOI (see Equation (39)).
Figure 17
Figure 17
The distance error derror of the LiDAR sensor for the real and virtual 3%-reflective Lambertian plate with different visibility distances V. The distance error derror increases with the decrease in visibility distances. The simulation and real measurements show a good correlation.

References

    1. Bilik I. Comparative Analysis of Radar and Lidar Technologies for Automotive Applications. IEEE Intell. Transp. Sys. Mag. 2022;15:244–269. doi: 10.1109/MITS.2022.3162886. - DOI
    1. Yole Intelligence, with the Strong Push of Chinese Players Eager to Integrate Innovative LiDAR Technologies, the Automotive Industry will Reach $2.0B in 2027, August 2022. [(accessed on 10 February 2023)]. Available online: https://www.yolegroup.com/product/report/lidar—market–technology-trends-...
    1. Kalra N., Paddock S.M. Driving to safety: How many miles of driving would it take to demonstrate autonomous vehicle reliability? Transp. Res. Part A Policy Pract. 2016;94:182–193. doi: 10.1016/j.tra.2016.09.010. - DOI
    1. Haider A., Pigniczki M., Köhler M.H., Fink M., Schardt M., Cichy Y., Zeh T., Haas L., Poguntke T., Jakobi M., et al. Development of High-Fidelity Automotive LiDAR Sensor Model with Standardized Interfaces. Sensors. 2022;22:7556. doi: 10.3390/s22197556. - DOI - PMC - PubMed
    1. NIED Center for Advanced Research Facility: Evaluating the Latest Science and Technology for Disaster Resilience, to Make Society’S Standards for Performance. [(accessed on 15 February 2023)]. Available online: https://www.bosai.go.jp/e/research/center/shisetsu.html.

LinkOut - more resources