. 2023 Nov;43(11):1967-1982.
doi: 10.1177/0271678X231193661. Epub 2023 Aug 12.

Early brain metabolic disturbances associated with delayed cerebral ischemia in patients with severe subarachnoid hemorrhage

Affiliations

Early brain metabolic disturbances associated with delayed cerebral ischemia in patients with severe subarachnoid hemorrhage

Yannick Tholance et al. J Cereb Blood Flow Metab. 2023 Nov.

Abstract

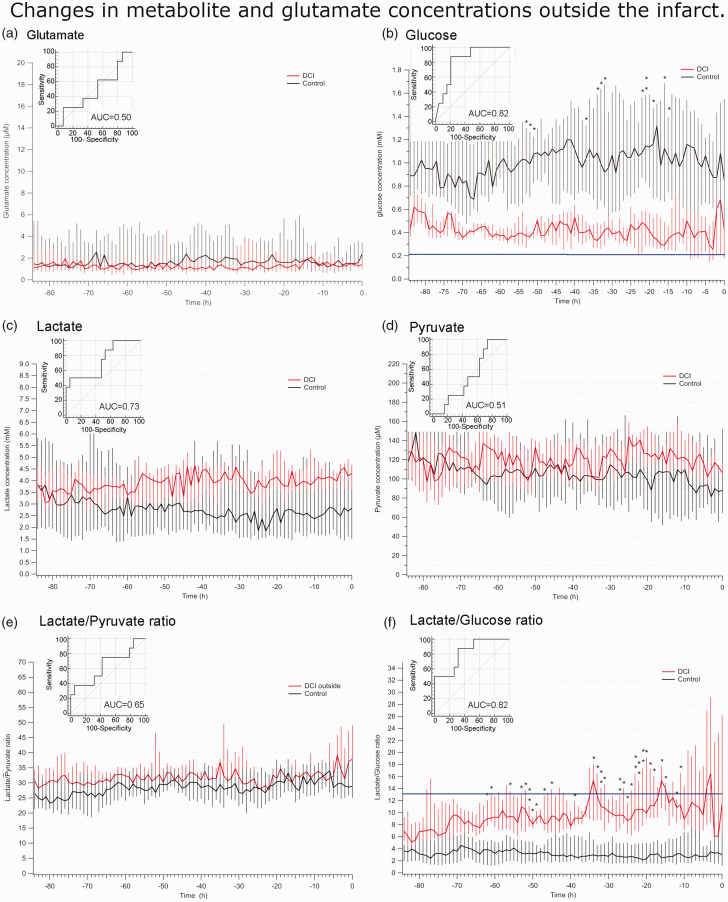
Delayed cerebral ischemia (DCI) is a devastating complication of aneurysmal subarachnoid hemorrhage (ASAH) causing brain infarction and disability. Cerebral microdialysis (CMD) monitoring is a focal technique that may detect DCI-related neurochemical changes as an advance warning. We conducted retrospective analyses from 44 poor-grade ASAH patients and analyzed glucose, lactate, pyruvate, and glutamate concentrations in control patients without DCI (n = 19), and in patients with DCI whose CMD probe was located within (n = 17) or outside (n = 8) a new infarct. When monitored from within a lesion, DCI was preceded by a decrease in glucose and a surge in glutamate, accompanied by increases in lactate/pyruvate and lactate/glucose ratios whereas these parameters remained stable in control patients. When CMD monitoring was performed outside the lesion, the glutamate surge was absent, but glucose and L/G ratio were still significantly altered. Overall, glucose and L/G ratio were significant biomarkers of DCI (se96.0, spe73.7-68.4). Glucose and L/G predicted DCI 67 h before CT detection of a new infarct. The pathogenesis of DCI therefore induces early metabolic disturbances that can be detected by CMD as an advance warning. Glucose and L/G could provide a trigger for initiating further examination or therapy, earlier than when guided by other monitoring techniques.

Keywords: Brain metabolism; cerebral microdialysis; glucose; lactate; multimodal monitoring.


Conflict of interest statement

Declaration of conflicting interestsThe author(s) declared no potential conflicts of interest with respect to the research, authorship, and/or publication of this article.

Figures

Figure 1.
Figure 1.
(a) Time period of interest for retrospective analysis. The period most likely to observe neurochemical and metabolic changes spanned from the last negative scan without evidence of infarction (left) to the first positive scan revealing a new infarcted brain area (right). Data were compared across patients whose CMD probes were within versus outside an infarcted area. ASAH, aneurismal subarachnoid hemorrhage and (b) Patient selection. Of the 72 patient files present in the source database, 21 did not display DCI and provided control monitoring values (2 excluded), and 51 showed DCI with cerebral infarction evidenced by CT (24 excluded). Among the 27 patients with infarction related to DCI, 17 and 10 had a CMD probe placed within and placed outside the infarct, respectively. CMD, cerebral microdialysis; DCI, delayed cerebral ischemia; ASAH, aneurismal subarachnoid hemorrhage; CMD, cerebral microdialysis; DCI, delayed cerebral ischemia.
Figure 2.
Figure 2.
Initial stabilization of CMD markers in control patients. Evolution of glutamate (a), glucose (b), lactate (c), pyruvate concentrations (d), as well as L/P (e) and L/G (f) ratios during the first 140 h (5.8 days) following probe implantation. Extracellular glutamate concentrations were elevated in the first 6 h of monitoring, then decreased gradually to a low micromolar range (a1). There was no difference in the initial pattern of CMD data in patients whose probes were placed <48 h (N = 8) versus >100 h (N = 7) after the initial bleed (a2), indicating that early elevation of glutamate was related to local implantation injury rather than to primary hemorrhagic injury. Data are represented as median (interquartile range).
Figure 3.
Figure 3.
Evolution of glutamate, glucose, lactate, and pyruvate concentrations, as well as lactate/pyruvate and lactate/glucose ratios before the first positive scan displaying brain infarction in patients whose CMD probe was placed within an infarct. (a–f). Median (interquartile range) concentrations/ratios measured during the 84-h period preceding the first scan showing evidence of DCI with a probe located within an infarct (red) and the control group (black): glutamate (a.), glucose (b.), lactate (c.), and pyruvate (d.) concentrations; lactate/pyruvate (L/P) (e.) and lactate/glucose (L/G) (f.) ratios. The optimal cutoff values obtained were >16.7 µmol/L glutamate, <0.1 mM glucose, >6.3 mM lactate, <19 µM pyruvate, L/P ratio > 73.1, and L/G ratio > 35.2 (blue line). Insets: ROC curve analysis with maximum values of each patient. *p < 0.05, **p < 0.01, ***p < 0.001, linear regression mixed effect model with Man-Whitney post-hoc tests.
Figure 4.
Figure 4.
Evolution of glutamate, glucose, lactate and pyruvate concentrations, as well as lactate/pyruvate and lactate/glucose ratios before the first positive scan displaying brain infarction in patients whose CMD probe was placed outside the infarct. (a–f) Median (interquartile range) glutamate concentrations/ratios measured during the 84-h period preceding the first brain scan showing evidence of DCI with a probe located outside the infarct (red) and the control group (black): glutamate (a.), glucose (b.), lactate (c.), and pyruvate (d.) concentrations; lactate/pyruvate (L/P) (e.) and lactate/glucose (L/G) (f.) ratios. Inset: ROC curve analysis with maximum glutamate values of each patient. *p < 0.05, **p < 0.01, ***p < 0.001, linear regression mixed effect model with Man-Whitney post-hoc tests.
Figure 5.
Figure 5.
Comparison of most efficient biomarkers of DCI. a. ROC analysis of minimal glucose (a1), maximal lactate/glucose ratio ICP (a2), minimal PbtO2 (a3) and maximal ICP (a4) in all patients with or without DCI (irrespective of probe placement). b and c. Evolution of PbtO2 values in patients with a probe located within (b.) or outside (c.) an infarct area (inset: ROC analysis of maximal PbtO2 within or outside infarct zone). d and e. Evolution of intracranial pressure (ICP) in patients with a probe located within (d.) or outside (e.) an infarct area (inset: ROC analysis of maximal ICP within or outside infarct zones). f and g. Box and whisker plot of time intervals between L/G, glucose, PbtO2, and ICP crossing their respective cutoff values and the first evidence of cerebral infarction from DCI on a positive brain scan. Boxes show medians and interquartile values, while whiskers show 10–90%tiles (individual dots are extreme values). Cutoff values were defined as the optimal threshold according to the Youden index (f.) or as the threshold providing maximal sensitivity (g.). All biomarkers crossed their cutoffs with significantly advanced timing compared to imaging, and L/G was significantly earlier than PbtO2 with both threshold definitions (ANOVA followed by Tukey’s multiple comparisons, p = 0.04).

References

    1. Macdonald RL. Delayed neurological deterioration after subarachnoid haemorrhage. Nat Rev Neurol 2014; 10: 44–58. - PubMed
    1. Charpentier C, Audibert G, Guillemin F, et al.. Multivariate analysis of predictors of cerebral vasospasm occurrence after aneurysmal subarachnoid hemorrhage. Stroke 1999; 30: 1402–1408. - PubMed
    1. Suarez JI. Diagnosis and management of subarachnoid hemorrhage. Continuum (Minneap Minn) 2015; 21: 1263–1287. - PubMed
    1. Vergouwen MD, Vermeulen M, van Gijn J, et al.. Definition of delayed cerebral ischemia after aneurysmal subarachnoid hemorrhage as an outcome event in clinical trials and observational studies: proposal of a multidisciplinary research group. Stroke 2010; 41: 2391–2395. - PubMed
    1. Francoeur CL, Mayer SA. Management of delayed cerebral ischemia after subarachnoid hemorrhage. Crit Care 2016; 20: 277. - PMC - PubMed

Publication types

LinkOut - more resources