. 2023 Oct;32(10):e4754.
doi: 10.1002/pro.4754.

The nuclear receptor LRH-1 discriminates between ligands using distinct allosteric signaling circuits

Affiliations

The nuclear receptor LRH-1 discriminates between ligands using distinct allosteric signaling circuits

Suzanne G Mays et al. Protein Sci. 2023 Oct.

Abstract

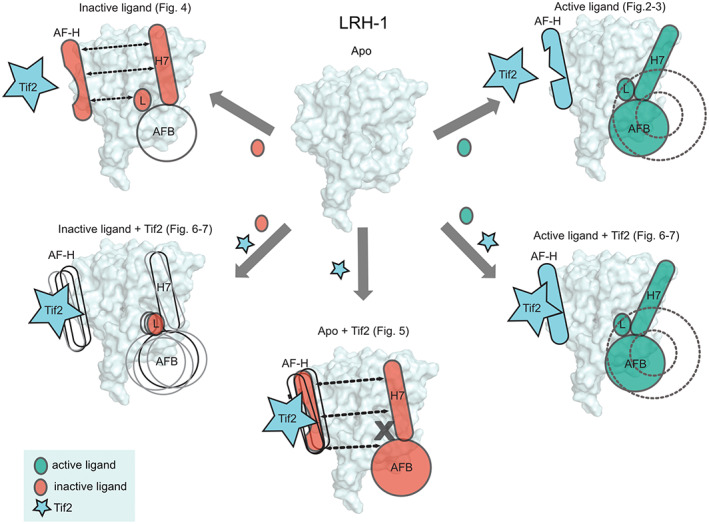
Nuclear receptors (NRs) are transcription factors that regulate essential biological processes in response to cognate ligands. An important part of NR function involves ligand-induced conformational changes that recruit coregulator proteins to the activation function surface (AFS), ~15 Å away from the ligand-binding pocket. Ligands must communicate with the AFS to recruit appropriate coregulators and elicit different transcriptional outcomes, but this communication is poorly understood. These studies illuminate allosteric communication networks underlying activation of liver receptor homolog-1 (LRH-1), a NR that regulates development, metabolism, cancer progression, and intestinal inflammation. Using >100 μs of all-atom molecular dynamics simulations involving 74 LRH-1 complexes, we identify distinct signaling circuits used by active and inactive ligands for AFS communication. Inactive ligands communicate via strong, coordinated motions along paths through the receptor to the AFS. Activating ligands disrupt the "inactive" circuit and induce connectivity with a second allosteric site. Ligand-contacting residues in helix 7 help mediate the switch between circuits, suggesting new avenues for developing LRH-1-targeted therapeutics. We also elucidate aspects of coregulator signaling, showing that localized, destabilizing fluctuations are induced by inappropriate ligand-coregulator pairings. These studies have uncovered novel features of LRH-1 allostery, and the quantitative approach used to analyze many simulations provides a framework to study allosteric signaling in other receptors.

Keywords: LRH-1; allosteric regulation; ligand regulation; molecular dynamics; nuclear receptor; structure-function.


Figures

FIGURE 1
FIGURE 1
LRH‐1 ligand‐binding domain and interactions with synthetic ligands. (a) Model of the LRH‐1 ligand‐binding domain (from PDB 6OQY), highlighting regions of interest. A ligand is bound in the ligand‐binding pocket (represented by teal spheres). The two allosteric surfaces discussed in this paper are also highlighted: the AFS is colored dark blue, and AFB is salmon. The Tif2 peptide containing the NR Box 3 interaction motif is shown bound at the AFS (dark green helix). (b) 6HP chemical scaffold of the ligands used in the MD simulations. The modified R1 site is highlighted in teal (modifications are shown in Table 1). Features common to all ligands are labeled in black, and the regions of LRH‐1 contacting the ligands are labeled in salmon. (c) Close view of the LRH‐1 ligand‐binding pocket, showing a superposition of the ligands used in the simulations. Residues previously shown to be important for activation for some of the ligands are shown as sticks (labeled in bold type). Helices are shown as cylinders, abbreviated “H”. AFB is colored pale salmon. (d) Heatmap depicting the effect of the indicated point mutations on LRH‐1 activation by ligands in this study.
FIGURE 2
FIGURE 2
Activating ligands move with LRH‐1 helix 7. (a) Heatmap quantifying correlated motion between each ligand and the LRH‐1 residues that they contact, measured by the value “shortest distance.” Each column represents a ligand, and each row is an amino acid (numbered on the far left of the heatmap). Lower values for shortest distance (darker color) indicate stronger coupled motion with the ligand. Data are clustered by columns, using Euclidean distance and Ward's agglomeration. Top annotation describes physical and biological characteristics of the ligands, including (1) relative Emax (maximum transcriptional activity in luciferase reporter assays relative to the parent compound, RJW100); (2) logEC50 from luciferase reporter assays, colored white if values could not be calculated due to poor activity); (3) ΔTm (change in melting temperature for the protein‐ligand complex upon ligand binding); (4) size of the R1 group, and (5) ligand classification used for this study. The color bar to the left of the heatmap describes the location of the LRH‐1 residues (H, helix; β, beta‐sheet). Inset, R1 groups of the ligands in cluster 2, as well as ligands with large R1 groups that are excluded from the cluster). This highlights the fact that the shortest distance analysis discriminates between active and inactive ligands with large R1 groups. (b) Scatter plots describing the relationship between shortest distance value for residues in each helix (mean) and biological data for all ligands. For logEC50 graphs, ligands for which EC50s could not be calculated are omitted. The best‐fit line (blue) and 95% CI (gray shading) are shown for linear relationships that were significant by Pearson's correlation analysis. Insets, p‐values and Pearson's correlation coefficients (r) for correlations with p < 0.05; ns indicates not significant. (c) Comparisons of shortest distance values (mean) for residues in helix 7 for wild‐type LRH‐1 (WT) or LRH‐1 with the indicated point mutations. *, p < 0.05 relative to WT for each ligand (one‐way ANOVA, Dunnett's multiple comparisons test).
FIGURE 3
FIGURE 3
Coupled motion induced by active ligands extends to AFB. (a) Representative results from community analysis for one active ligand (left) and one inactive ligand (right), mapped onto the LRH‐1 ligand‐binding domain (PDB 4DOS). Each color represents a community, which is a group of residues that moves together. Ligands are shown as spheres and colored according to the community they participate in. Complexes with active ligands tend to have larger communities containing the ligand, helix 7 and AFB (yellow, highlighted with a circle). Communities for individual complexes are shown in the supplemental material (Figure S2). (b) Active ligands are more likely to belong to the community containing helix 7 than inactive ligands. Plot shows the number of complexes in which the ligand is grouped in the same community with helix 7. *, p < 0.05, Fisher's exact test. (c) The helix 7 community is larger in the presence of active versus inactive ligands. Each point represents the number of residues in the helix 7 community for an LRH‐1 complex (n = 12). Lines in the boxes indicate the mean and whiskers the range. **, p < 0.01 by two‐sided, unpaired Mann–Whitney test. (d) A hydrogen bond between Y413 and N425 (shown in teal sticks) connects AFB and helix 7 (red dotted lines). The location of G421 is also shown. H, helix. (e) Mutations to residues N425 or G421 reduce the size of the helix 7 community. Each point represents the number of residues in the helix 7 community for wild type (WT) or mutant (mut) LRH‐1 bound to a specific ligand. Lines connecting points follow changes for WT versus mutant LRH‐1 bound to the same ligand (e.g., WT LRH‐1 bound to ligand 5N is connected to G421A LRH‐1 bound to 5N). *, p < 0.05 by two‐sided, paired Mann–Whitney test. Square symbols indicate mutation‐ligand combinations that decouple ligand‐helix 7 motions to a level of statistical significance in shortest‐distance analysis (calculated as in Figure 2C). (f) Mutations in the ligand‐binding pocket that decouple helix 7‐ligand motions reduce the size of the helix 7 community. Each point represents the number of residues in the helix 7 community for WT or mutant LRH‐1 bound to a specific ligand, as in panel (d). *, p < 0.05 by two‐sided, paired Mann–Whitney test; ns, not significant.
FIGURE 4
FIGURE 4
Inactive ligands induce communication with the AF‐H. (a) Quantification of the number of strong suboptimal paths between each ligand and the AF‐H (left), or between helix 7 and the AF‐H (right). Each point is a protein‐ligand complex, the middle line in the boxes indicates the mean, and the whiskers indicate the range. *, p < 0.05 by negative binomial regression analysis. (b) Quantification of the numbers of complexes (out of 12) in which the strong paths traverse different parts of the receptor (as indicated in the figure panel). *, p < 0.05 by Fisher's exact test. (c) Summary of the routes and strengths of communication to the AF‐H originating from helix 7 (black lines) or the ligand (blue lines) in complexes containing inactive (left) or active (right) ligands. Oblong shapes represent LRH‐1 helices (labeled with number or name), and triangles represent ligands. Lines were drawn between components if greater than 50% of complexes had strong suboptimal paths between them. Thickness of the lines are proportional to the mean number of strong suboptimal paths, where thicker lines indicate stronger communication. (d) Top, mutations that decouple motions between ligands and helix 7 exhibit stronger communication between helix 7 and the AFS in suboptimal paths analysis. **, p < 0.01 by negative binomial regression analysis. Bottom, decoupling mutations do not significantly change communication between the ligand and the AFS. (e) Heatmap summarizing the effect of LRH‐1 mutations on three features identified in our analysis as being different between active and inactive ligands, shown in columns 1–3: (1) decoupled motion between helix 7 and the ligand (yellow indicates more decoupled vs. WT) (2) size of the helix 7 community in community analysis (blue indicates smaller vs. WT) and (3) strength of communication between helix 7 and the AFS by suboptimal paths analysis (yellow indicates stronger communication vs. WT). The color of the cells are normalized to the range of each column to put values on the same scale. The two clusters highlight the fact that the set of mutations that decouple ligand‐helix7 motion (top cluster) tend to decrease the helix 7 community size and increase helix 7‐AFS communication.
FIGURE 5
FIGURE 5
Tif2 coregulator binding apo‐LRH‐1 strengthens allosteric signaling to the AFS. (a) Number of strong suboptimal paths between the AF‐H and helix 6 or β2 (parts of AFB) and between the AF‐H and helix 7 in the presence and absence of Tif2. **, p < 0.01 by a two‐tailed, paired t‐test. (b,c) Tif2 destabilizes the AFS when LRH‐1 is unliganded. (b) RMSF differences (ΔRMSF) for apo‐LRH‐1 with no coregulator bound minus apo‐LRH‐1 + Tif2 mapped onto the AFS (comprised of residues in helix 3, helix 4, and the AF‐H). Negative values indicate destabilization upon Tif2 binding. (c) RMSF of residues located in the AFS, either in the AF‐H (left), helix 3 (middle) or helix 4 (right), in the presence or absence of Tif2. Each point is the RMSF of a residue in the AFS, lines in the boxes represent the mean, and whiskers represent the range. *, p < 0.05; ***, p < 0.001 by two‐tailed, unpaired t‐tests.
FIGURE 6
FIGURE 6
AFB motions dominate when Tif2 binds in the presence of inactive ligands. (a,b) The top four PCs for each protein‐ligand complex were determined, and the extent of overlap between these PCs is shown for each complex in the absence (a) or presence (b) of Tif2. (c,d). PCA fluctuation plots. Each line represents the median value; error bars are the 95% CI. *, p < 0.05 by two‐way ANOVA followed by Sidak's multiple comparisons test. Shaded areas AF‐B. (e) Difference in PCA fluctuations for active minus inactive ligands in the presence of Tif2 mapped onto the LRH‐1 structure.
FIGURE 7
FIGURE 7
Co‐binding of a coactivator and an inactive ligand is destabilizing. (a) RMSF for each LRH‐1 residue when apo or bound to active or inactive ligands when no coregulator bound. Median RMSF values ±95% CI are shown for ligand‐bound complexes (n = 12). (b) The difference in RMSF (ΔRMSF) of ligand‐bound LRH‐1 (n = 24) minus RMSF of apo‐LRH‐1 is mapped onto the LRH‐1 structure to show the regions affected the most by ligand binding. Teal shaded area indicates the ligand‐binding pocket (LBP). The color of helix 2 (H2) in the right panel appears lighter than in the left because it is in the background after rotation of the complex. (c) RMSF plot comparing active versus inactive ligands (n = 12) in the presence of Tif2. Each line is the median RMSF, and the error bars represent the 95% CI. *, p < 0.05 by two‐way ANOVA followed by Sidak's multiple comparisons test. The RMSF plot of apo‐LRH‐1 bound to Tif2 is shown for comparison. (d) ΔRMSF of active minus inactive ligands in the presence of Tif2 (shown in green), mapped onto the LRH‐1 structure. Gray shaded areas in (c) and (d) indicate AFB. (e) Plots of RMSF values of the indicated residues, showing destabilization with the combination of inactive ligands and Tif2. Midpoints represent the median; error bars are the range. *, p < 0.05 versus the other groups by one‐way ANOVA followed by Dunnett's multiple comparisons test. (f) Ligand RMSF values showing that the combination of inactive ligands with Tif2 destabilizes the ligand. Plots and statistics are done the same way as panel (e). (g) The effect of Tif2 on ligand fluctuations for individual LRH‐1‐ligand complexes was determined by calculating ΔRMSF (RMSF with no coregulator minus RMSF+Tif2). A value of zero would mean no change upon Tif2 binding, negative values indicate stabilization, and positive values indicate destabilization. *, p < 0.05 by two‐tailed, paired t‐tests.
FIGURE 8
FIGURE 8
Proposed model: LRH‐1 tunes allosteric signaling in response to ligands and ligand‐coregulator pairings. Inactive ligands induce strong signaling between ligand, helix 7 (H7), and the AF‐H, perhaps acting as a “stop” signal to disfavor coactivator binding (top left). Active ligands disrupt the “inactive” circuit by inducing connectivity between the ligand, H7 and AFB (top right). Tif2 binding apo‐LRH‐1 destabilizes the AF‐H and strengthens inactive‐like communication to the AF‐H (bottom). In the presence of an inactive ligand, Tif2 destabilizes the ligand and AFB and disrupts communication to the AF‐H (bottom left). Tif2 binding together with an active ligand stabilizes the ligand and does not induce AFB fluctuations, affirming the “active” signaling state (bottom right).

Update of

Similar articles

Cited by

References

    1. Bayrer JR, Wang H, Nattiv R, Suzawa M, Escusa HS, Fletterick RJ, et al. LRH‐1 mitigates intestinal inflammatory disease by maintaining epithelial homeostasis and cell survival. Nat Commun. 2018;9(1):4055. - PMC - PubMed
    1. Bolado‐Carrancio A, Riancho JA, Sainz J, Rodriguez‐Rey JC. Activation of nuclear receptor NR5A2 increases Glut4 expression and glucose metabolism in muscle cells. Biochem Biophys Res Commun. 2014;446(2):614–619. - PubMed
    1. Case D, Ben‐Shalom IY, Brozell SR, Cerutti DS, Cheatham TE III, Cruzeiro VWD, et al. Amber 2018. San Franscisco: University of California; 2018.
    1. Cave MC, Clair HB, Hardesty JE, Falkner KC, Feng W, Clark BJ, et al. Nuclear receptors and nonalcoholic fatty liver disease. Biochim Biophys Acta. 2016;1859(9):1083–1099. - PMC - PubMed
    1. Cornelison JL, Cato ML, Johnson AM, D'Agostino EH, Melchers D, Patel AB, et al. Development of a new class of liver receptor homolog‐1 (LRH‐1) agonists by photoredox conjugate addition. Bioorg Med Chem Lett. 2020;30(16):1–18. - PMC - PubMed

Publication types

LinkOut - more resources