. 2023 Oct;35(41):e2300305.
doi: 10.1002/adma.202300305. Epub 2023 Sep 8.

Microfibrous Scaffolds Guide Stem Cell Lumenogenesis and Brain Organoid Engineering

Affiliations

Microfibrous Scaffolds Guide Stem Cell Lumenogenesis and Brain Organoid Engineering

Kaja I Ritzau-Reid et al. Adv Mater. 2023 Oct.

Abstract

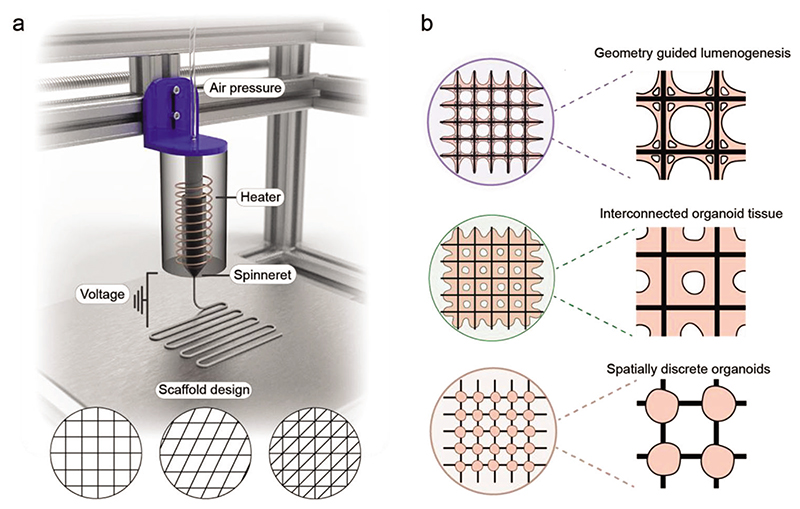
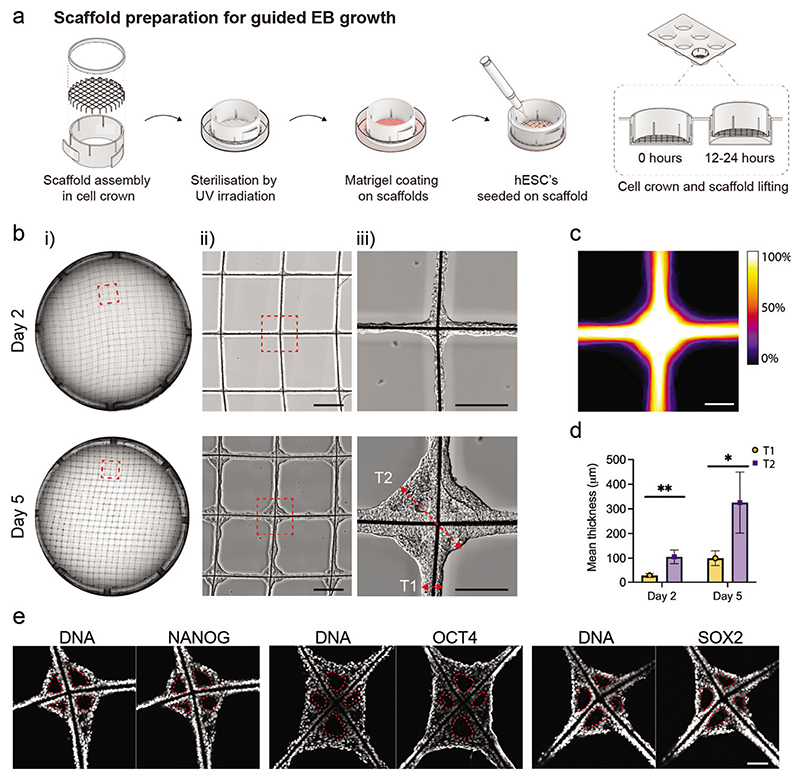
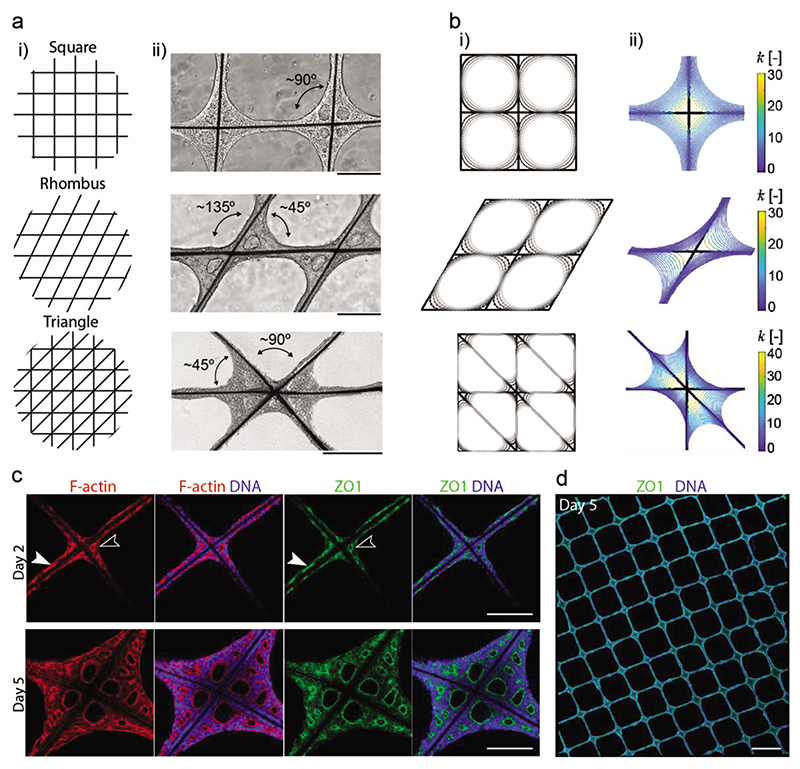
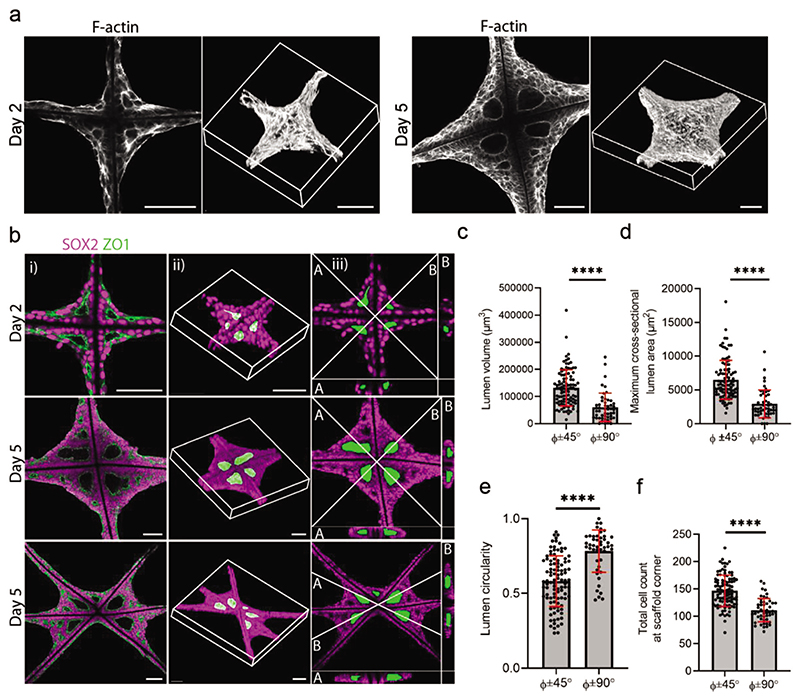
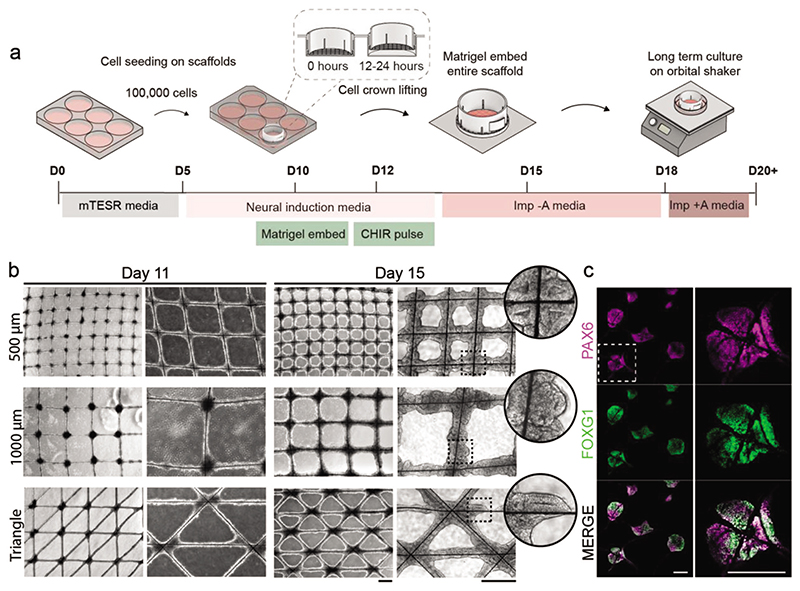
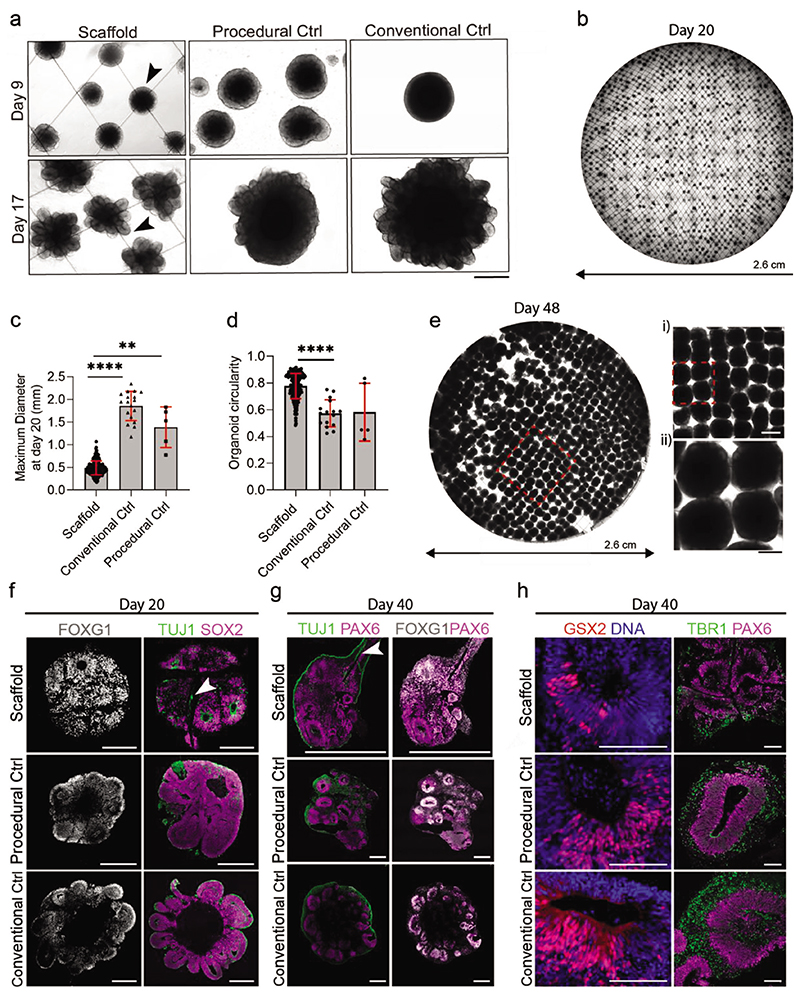
3D organoids are widely used as tractable in vitro models capable of elucidating aspects of human development and disease. However, the manual and low-throughput culture methods, coupled with a low reproducibility and geometric heterogeneity, restrict the scope and application of organoid research. Combining expertise from stem cell biology and bioengineering offers a promising approach to address some of these limitations. Here, melt electrospinning writing is used to generate tuneable grid scaffolds that can guide the self-organization of pluripotent stem cells into patterned arrays of embryoid bodies. Grid geometry is shown to be a key determinant of stem cell self-organization, guiding the position and size of emerging lumens via curvature-controlled tissue growth. Two distinct methods for culturing scaffold-grown embryoid bodies into either interconnected or spatially discrete cerebral organoids are reported. These scaffolds provide a high-throughput method to generate, culture, and analyze large numbers of organoids, substantially reducing the time investment and manual labor involved in conventional methods of organoid culture. It is anticipated that this methodological development will open up new opportunities for guiding pluripotent stem cell culture, studying lumenogenesis, and generating large numbers of uniform organoids for high-throughput screening.

Keywords: bioengineering; lumenogenesis; melt electrospinning writing; organoids; scaffolds; stem cells.


Conflict of interest statement

Conflict of Interest

K.I.R.R., R. W., R.X., J.P.K.A., C.L.G., D.R., J.A.K. and M.M.S. are coinventors on a patent describing methods for preparing organoids on lattice scaffolds. The rest of the authors declare no conflicts of interest.

Figures

Figure 1
Figure 1. Scaffold-guided EB and organoid platform.
a) Microfibrous scaffold fabrication using MEW. b) Schematic of MEW-fabricated scaffolds used to guide lumenogenesis and cerebral organoid growth. The cell–material interface of the scaffold is tuned to generate both interconnected and spatially discrete organoids.
Figure 2
Figure 2. Scaffolds facilitate robust and reproducible control over EB self-organization.
a) Schematic illustration of scaffold preparation for hESC seeding and EB tissue formation. b) Representative tiled overview images of the entire scaffold (i) and magnified views (ii,iii) on day 2 and day 5 after hESC seeding. A representative example of lumen emergence is shown on day 2 (black arrowhead) and an established lumen on day 5 (white arrowhead). The red dotted lines with arrow bars denote the region of tissue thickness measurement for the fiber walls (T1) and intersection (T2) on the scaffolds. Scale bars: (ii) 500 μm, and (iii) 200 μm. (N = minimum of 2 independent scaffolds). c) Heatmap showing superimposed bright-field images of individual intersections across the scaffold at day 5 after hESC seeding (n = 89 EB tissue nodes from 2 independent scaffolds). The color bar indicates the percentage of images in which tissue was present in these locations. Scale bar: 200 μm. d) Comparison of tissue thickness at the walls and intersections on day 2 and day 5. (n = 5 EB tissue nodes analyzed from 1 scaffold). Data represent mean ±standard deviation (s.d.) ** p < 0.01 and * p < 0.05, determined by Welch’s t-test. e) Characterization of EB tissue at day 5 by immunostaining with pluripotent markers SOX2, NANOG, and OCT4, and DAPI counterstaining of the nuclei (n = minimum of 3 EB tissue nodes on 1 or 2 independent scaffolds). The white dotted lines mark the lumen. Scale bar: 100 μm.
Figure 3
Figure 3. Scaffold geometry guides EB tissue formation.
a) Graphical illustrations showing the different scaffold geometry designs investigated (i), bright-field images on day 5 showing EB tissue morphology on the different scaffold geometries (ii) on square grids that create four 90° angles as labeled in the bright-field image, rhombus grids that create two major angles of ≈135°and ≈45°, and triangle grids that create two major angles of ≈90°and ≈45°. b) Curve shortening flow models of EB tissue growth on scaffolds. Tissue growth evolution is modeled on: (i) square, rhombus, and triangle grid scaffolds, with lighter gray representing later time points, and (ii) evolution of normalized line curvature k˜ of the tissue interface. The key represents curvature. c) Characterization of lumen formation on square grid scaffolds at day 2 and day 5 by staining for F-actin (phalloidin), and immunostaining with apical protein marker ZO1 and nuclei (DAPI). A representative example of lumen emergence at the scaffold intersections is shown on day 2 (white line arrowheads) and at the scaffold walls (solid white arrowheads). The bottom row shows the matured tissue comprising the lumen at day 5 (n = minimum of 3 tissue nodes from 1 or 2 independent scaffolds). Scale bar: 200 μm. d) Tiled confocal fluorescence microscopy image of an immunostained scaffold sample with the apical protein marker ZO1, and counterstained with DAPI. Scale bar: 1 mm.
Figure 4
Figure 4. Scaffold geometry guides lumen formation.
a) A single slice representation generated from confocal light microscopy (left) and 3D reconstructions (right) of F-actin stained samples on day 2 and day 5. Scale bar: 100 μm. b) Image gallery of a square grid scaffold on day 2 and day 5, and a triangle grid scaffold on day 5 showing a single slice of scaffold and EB tissue immunostained with SOX2 (magenta) and ZO1 (green) (i), 3D reconstruction from a confocal z-stack, with the lumens segmented and pseudo-colored in green (ii), cross-section of the confocal z-stack showing a bisector slice through the lumens indicated by the white lines (iii). Scale bar: 100 μm. c) Comparison between ≈45°angles (45°±9°) and ≈90°angles (90°±5°) on triangle grid scaffolds for lumen volume, d) lumen cross-sectional maximum area, e) lumen circularity, and f) total cell count per scaffold corner (n = 26 tissue nodes analyzed from N = 3 independent scaffolds). Φ represents the scaffold angle. Data represent mean ±s.d. **** p < 0.0001 as determined by Welch’s t-test.
Figure 5
Figure 5. EB tissue forms cerebral organoids on scaffolds.
a) Schematic illustration of adapted scaffold method for cerebral organoid generation. b) Representative bright-field images showing the development of cerebral organoids on scaffolds at days 11 and 15 on square grid scaffolds of 500 μM spacing, square grid scaffolds of 1000 μM spacing, and on triangle grid scaffolds. High reproducibility of the forming organoid tissue is apparent across all scaffolds. Scale bars: 500 μm. Magnified views of areas outlined by the black dotted lines are shown in circular insets. c) Representative images of histological sections of organoids on scaffolds at day 20 immunostained with the dorsal forebrain marker PAX6 (magenta) and the forebrain marker FOXG1 (green). The top row shows an overview of multiple organoids, and the bottom row shows a magnified view of the respective region marked with a white dashed line (representative images from 1 or 2 independent scaffolds). Scale bars: 200 μm.
Figure 6
Figure 6. Spatially discrete cerebral organoids grow on uncoated scaffolds.
a) Bright-field images show cerebral organoids grown on scaffolds, with procedural control organoids and conventional control organoids shown for reference. On day 9, before Matrigel’s addition, the smooth and optically translucent organoid edges are denoted by the black arrowhead. At day 17, after Matrigel addition and CHIR pulse, neuroepithelial buds are denoted by the black arrowhead. Scale bar: 500 μm. b) Representative tiled overview image of the entire scaffold with organoids at day 20 (N = 3 independent scaffolds). c) Maximum diameter of organoids at day 20. Analysis was performed on organoids using a custom Fiji macro (n = minimum of 5 organoids from 3 independent scaffolds). Data represent mean ±s.d. **** p < 0.0001 and ** p < 0.001, determined by Kruskal–Wallis with Dunn’s post-test. d) Comparison of organoid circularity at day 20 obtained through image analysis using the inbuilt measure function in Fiji (n = minimum of 5 organoids from 3 independent scaffolds). Data represent mean ±s.d. **** p < 0.0001, determined by Kruskal–Wallis with Dunn’s post-test. e) Representative tiled overview image of fixed organoids on 1000 μM spaced scaffolds at day 48. Magnified regions are marked by a red dashed line. Scale bars: 1000 μM (top) and 500 μM (bottom). f) Immunostaining characterization of day 20 cerebral organoids on scaffolds, compared to procedural and conventional control organoids. On the left, histological sections show organoids immunostained with forebrain marker FOXG1 (grey). On the right, histological sections show organoids immunostained with neuronal marker TUJ1 (green), and neural progenitor marker SOX2 (magenta) (n = minimum of 4 organoids). Scale bars: 200 μm. g) Histological sections of day 40 organoids immunostained with dorsal forebrain markers PAX6 (magenta), neuronal marker TUJ1 (green), and FOXG1 (white), Neurons are seen to grow inside the organoid along the scaffold fibers (white arrow). Scale bar: 500 μm. h) Histological sections of day 40 organoids immunostained with ventral marker GSX2 (red) and counterstained with DAPI (blue), and dorsal markers PAX6 (magenta) and TBR1 (green). Scale bar: 100 μm.

References

    1. Bryant DM, Datta A, Rodríguez-Fraticelli AE, Peränen J, Martín-Belmonte F, Mostov KE. Nat Cell Biol. 2010;12:1035. doi: 10.1038/ncb2106. - DOI - PMC - PubMed
    1. Bagnat M, Navis A. Cell Polarity 2: Role in Development and Disease. Springer International Publishing; New York: 2015. pp. 67–93.
    1. Sigurbjörnsdóttir S, Mathew R, Leptin M. Nat Rev Mol Cell Biol. 2014;15:665. - PubMed
    1. Shao Y, Taniguchi K, Gurdziel K, Townshend RF, Xue X, Yong KMA, Sang J, Spence JR, Gumucio DL, Fu J. Nat Mater. 2017;16:419. - PMC - PubMed
    1. Taniguchi K, Shao Y, Townshend RF, Cortez CL, Harris CE, Meshinchi S, Kalantry S, Fu J, O’Shea KS, Gumucio DL. J Cell Biol. 2017;216:3981. - PMC - PubMed

LinkOut - more resources