. 2023 Dec 21;109(1):57-67.
doi: 10.1210/clinem/dgad472.

OGTT Metrics Surpass Continuous Glucose Monitoring Data for T1D Prediction in Multiple-Autoantibody-Positive Individuals

Affiliations

OGTT Metrics Surpass Continuous Glucose Monitoring Data for T1D Prediction in Multiple-Autoantibody-Positive Individuals

Alyssa Ylescupidez et al. J Clin Endocrinol Metab. .

Erratum in

Abstract

Context: The value of continuous glucose monitoring (CGM) for monitoring autoantibody (AAB)-positive individuals in clinical trials for progression of type 1 diabetes (T1D) is unknown.

Objective: Compare CGM with oral glucose tolerance test (OGTT)-based metrics in prediction of T1D.

Methods: At academic centers, OGTT and CGM data from multiple-AAB relatives were evaluated for associations with T1D diagnosis. Participants were multiple-AAB-positive individuals in a TrialNet Pathway to Prevention (TN01) CGM ancillary study (n = 93). The intervention was CGM for 1 week at baseline, 6 months, and 12 months. Receiver operating characteristic (ROC) curves of CGM and OGTT metrics for prediction of T1D were analyzed.

Results: Five of 7 OGTT metrics and 29/48 CGM metrics but not HbA1c differed between those who subsequently did or did not develop T1D. ROC area under the curve (AUC) of individual CGM values ranged from 50% to 69% and increased when adjusted for age and AABs. However, the highest-ranking metrics were derived from OGTT: 4/7 with AUC ∼80%. Compared with adjusted multivariable models using CGM data, OGTT-derived variables, Index60 and DPTRS (Diabetes Prevention Trial-Type 1 Risk Score), had higher discriminative ability (higher ROC AUC and positive predictive value with similar negative predictive value).

Conclusion: Every 6-month CGM measures in multiple-AAB-positive individuals are predictive of subsequent T1D, but less so than OGTT-derived variables. CGM may have feasibility advantages and be useful in some settings. However, our data suggest there is insufficient evidence to replace OGTT measures with CGM in the context of clinical trials.

Keywords: CGM; OGTT; prediction; type 1 diabetes.


Figures

Figure 1.
Figure 1.
CONSORT diagram. Ninety-four participants from TrialNet Pathway to Prevention study (TN01) enrolled in TrialNet ancillary CGM study with follow up through December 2022 in TN01.
Figure 2.
Figure 2.
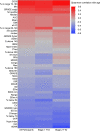
CGM metrics are associated with age. Heatmap shows Spearman correlations of daytime CGM metrics with age. Many CGM metrics are strongly associated in all participants (n = 93) and associations are consistent regardless of disease stage (n = 58 stage 1, n = 35 stage 2). Many metrics indicative of hypoglycemia are inversely correlated with age.
Figure 3.
Figure 3.
Distribution of percent of time with hypoglycemia at baseline, and 6- and 12-month visits. Metrics summarizing hypoglycemia are shown as percent of time (A) below 54 mg/dL and (B) below 70 mg/dL. Hypoglycemia was rare, especially for percent of time below 54 mg/dL (note different y-axis scales). Violin plots are overlaid with boxplots to show distributions. Pink indicates participants diagnosed with subsequent T1D (n = 34).
Figure 4.
Figure 4.
Discrimination ability of baseline metrics for (A) subsequent development of T1D and (B) T1D within 1.2 years of final CGM. ROC AUC values are plotted, where blue markers indicate OGTT-derived metrics or HbA1c, black indicates CGM daytime (06:00-00:00 hours) metrics. ROC curves were determined from logistic regression models; metrics were individually assessed for (A) prediction of subsequent T1D, and (B) T1D within 1.2 years of final CGM visit in unadjusted (circle), age-adjusted (triangle), and age and autoantibody-adjusted (cross) models. Metrics are ranked by mean AUC of the 3 models.
Figure 5.
Figure 5.
Baseline distributions for OGTT and CGM metrics with greatest discrimination ability for prediction of T1D outcomes. Violin plots overlaid with boxplots show distributions of top ranking OGTT and CGM metrics for prediction of subsequent T1D (A, B) and T1D within 1.2 years of final CGM (C, D). OGTT-derived Index60 and DPTRS had the highest AUC in unadjusted logistic regression models for prediction of subsequent T1D (A; AUC 80%) and T1D within 1.2 years (C; AUC 90%), respectively. Daytime CGM metrics SDb//dm and SDw, both measures of variability, had the highest AUC in unadjusted logistic regression models for prediction of subsequent T1D (B; AUC 69%) and T1D within 1.2 years (D; AUC 78%), respectively. All metrics tend to be higher in those diagnosed with T1D than those not diagnosed with greater differences seen closer to diagnosis (C, D).
Figure 6.
Figure 6.
Discrimination ability for prediction of subsequent T1D demonstrated by ROC curves. ROC curve of CGM model for prediction of T1D using most representative variables from clustering as predictors (CV, mean, hypo-index, hyper-index, IQR, SDwsh) is indicated by teal line. ROC curves of OGTT-derived variables DPTRS and Index60 for T1D prediction are indicated by the pink and purple lines, respectively. DPTRS and Index60 were consistently identified as top predictors of T1D outcomes. The dashed diagonal line is representative of a random classifier.

References

    1. Insel RA, Dunne JL, Atkinson MA, et al. . Staging presymptomatic type 1 diabetes: a scientific statement of JDRF, the Endocrine Society, and the American Diabetes Association. Diabetes Care. 2015;38(10):1964‐1974. - PMC - PubMed
    1. Sosenko JM, Skyler JS, Mahon J, et al. . Validation of the diabetes prevention trial-type 1 risk score in the TrialNet natural history study. Diabetes Care. 2011;34(8):1785‐1787. - PMC - PubMed
    1. Sosenko JM, Skyler JS, Beam CA, et al. . The development and utility of a novel scale that quantifies the glycemic progression toward type 1 diabetes over 6 months. Diabetes Care. 2015;38(5):940‐942. - PMC - PubMed
    1. Sosenko JM, Skyler JS, DiMeglio LA, et al. . A new approach for diagnosing type 1 diabetes in autoantibody-positive individuals based on prediction and natural history. Diabetes Care. 2015;38(2):271‐276. - PMC - PubMed
    1. Steck AK, Dong F, Geno Rasmussen C, et al. . CGM metrics predict imminent progression to type 1 diabetes: Autoimmunity Screening for Kids (ASK) study. Diabetes Care. 2022;45(2):365‐371. - PubMed

Publication types