. 2023 Sep:95:104752.
doi: 10.1016/j.ebiom.2023.104752. Epub 2023 Aug 10.

Combination drug screen targeting glioblastoma core vulnerabilities reveals pharmacological synergisms

Affiliations

Combination drug screen targeting glioblastoma core vulnerabilities reveals pharmacological synergisms

Jérémy Ariey-Bonnet et al. EBioMedicine. 2023 Sep.

Abstract

Background: Pharmacological synergisms are an attractive anticancer strategy. However, with more than 5000 approved-drugs and compounds in clinical development, identifying synergistic treatments represents a major challenge.

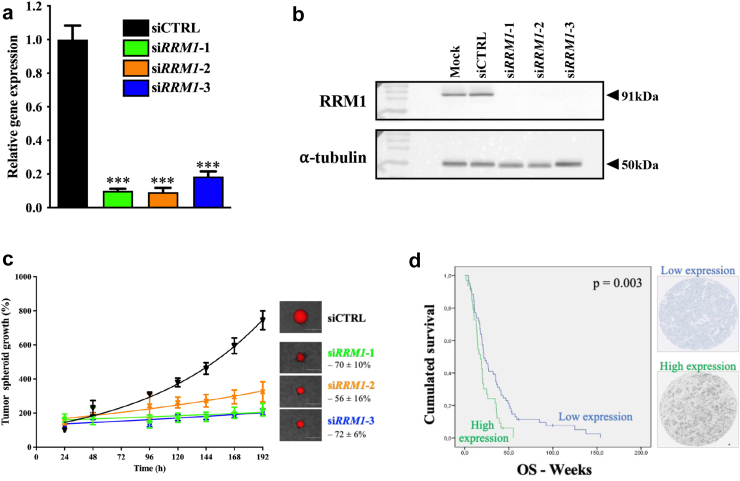
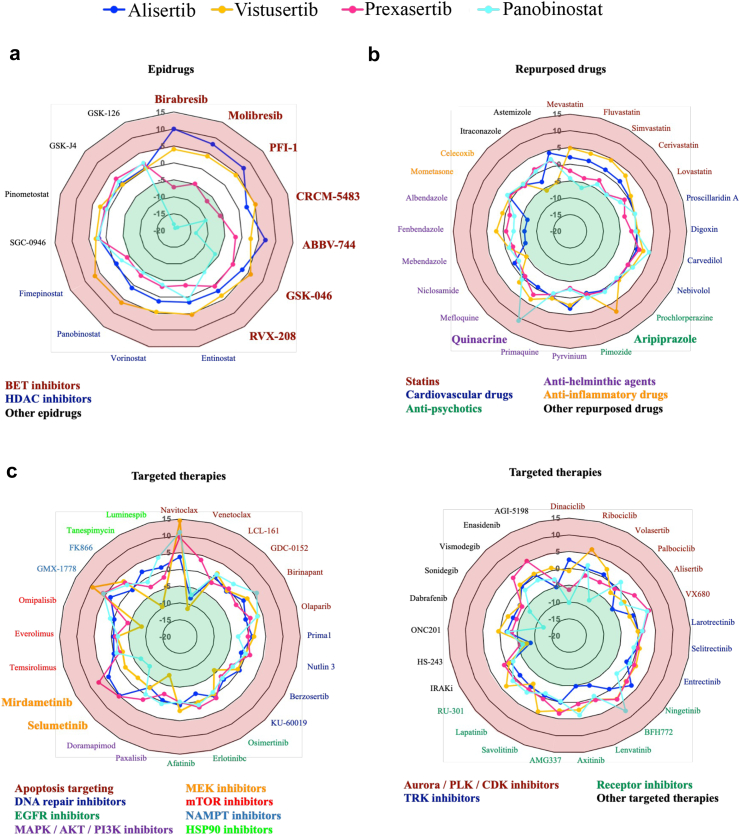
Methods: High-throughput screening was combined with target deconvolution and functional genomics to reveal targetable vulnerabilities in glioblastoma. The role of the top gene hit was investigated by RNA interference, transcriptomics and immunohistochemistry in glioblastoma patient samples. Drug combination screen using a custom-made library of 88 compounds in association with six inhibitors of the identified glioblastoma vulnerabilities was performed to unveil pharmacological synergisms. Glioblastoma 3D spheroid, organotypic ex vivo and syngeneic orthotopic mouse models were used to validate synergistic treatments.

Findings: Nine targetable vulnerabilities were identified in glioblastoma and the top gene hit RRM1 was validated as an independent prognostic factor. The associations of CHK1/MEK and AURKA/BET inhibitors were identified as the most potent amongst 528 tested pairwise drug combinations and their efficacy was validated in 3D spheroid models. The high synergism of AURKA/BET dual inhibition was confirmed in ex vivo and in vivo glioblastoma models, without detectable toxicity.

Interpretation: Our work provides strong pre-clinical evidence of the efficacy of AURKA/BET inhibitor combination in glioblastoma and opens new therapeutic avenues for this unmet medical need. Besides, we established the proof-of-concept of a stepwise approach aiming at exploiting drug poly-pharmacology to unveil druggable cancer vulnerabilities and to fast-track the identification of synergistic combinations against refractory cancers.

Funding: This study was funded by institutional grants and charities.

Keywords: Cancer vulnerabilities; Drug combination screening; Glioblastoma; Pharmacological synergisms; Target deconvolution.


Conflict of interest statement

Declaration of interests The authors have declared no conflict of interest.

Figures

Fig. 1
Fig. 1
Stepwise chemogenomic screen identifies nine actionable gene vulnerabilities in GBM. (a) Primary screen was performed in U87 GBM cell line with more than 2800 unique compounds tested alone (5 μM, n = 3 per condition from one experiment). After 72 h incubation, cell viability was assessed using Alamar Blue. The top 280 primary candidates were re-tested in a secondary validation screen in the T98G, U87 and its EGFR-mutated derivative U87vIII GBM cell lines using the same protocol. Eighty-three compounds were defined as GBM killers in at least 2 GBM cell lines and are represented in donut diagram and classified by pharmacological classes. (b) Heat map classification representing the cell viability in all tested GBM cell lines for the 83 hit compounds. (c) By target deconvolution using pharmacological online databases, 1100 known targets and interactors were revealed for the 83 hit compounds. Amongst them, 292 were targeted by at least 3 hit compounds and selected to build a focused siRNA library. The T98G, U87 and its derivative U87vIII GBM cell lines were individually transfected with 3 siRNA sequences (5 nM) for each of the 292 targets/interactors (n = 3 per condition from one experiment, followed by validation run). Cell viability was assessed by high-content imaging following Hoechst 33342 staining. Polar plot of 22 gene hits, which their gene expression downregulation decreased the cell viability in each tested cell line by at least 20%. Polar plot was made up of 10 data rings, each radial point representing a ten percent increment of the cell viability on a scale from 0 (inner radial point) to 100 (outer radial point). (d) Heat map representing the gene effect score of the 22 gene hits in 3 GBM cell lines, extracted from the CRISPR screen cohort data from the online Dependency Map portal. Right panel shows the protein–protein interaction network of the 9 hits identified as core vulnerabilities in all tested GBM cell lines (Gene effect score <−0.5; https://string-db.org/).
Fig. 2
Fig. 2
Functional validation of top gene hit RRM1 in glioblastoma cells and patient samples. (a) RRM1 relative gene expression following 48 h transfection of U87 cells with negative control siRNA and 3 different siRNA sequences targeting RRM1, as evaluated by qRT-PCR using YWHAZ as housekeeping gene. All the values are the average of four independent experiments ± standard error of mean (S.E.M), with a technical triplicate in each experiment; ∗∗∗, p < 0.001 (Student's t-test). (b) Representative Western blot showing RRM1 protein expression following 72 h siRNA transfection, using α-tubulin as loading control. (c) The mtDsRed-expressing U87 tumor spheroid growth following siRNA transfection assessed by daily fluorescence measurements. All the values are the average of four independent experiments ± standard error of mean (S.E.M), with a technical triplicate in each experiment; ∗, p < 0.05; ∗∗, p < 0.01; ∗∗∗, p < 0.001 (Student's t-test). Representative photographs of tumor spheroids at day 8 and mean decrease in spheroid growth ± S.D are included in insert (right). Scale bar, 1 mm. (d) Kaplan–Meier survival estimate of GBM patients (n = 97) according to RRM1 protein expression assessed by immunohistochemistry. Cox proportional hazards regression p value is shown and representative pictures of tumor samples displaying low (top) and high (bottom) RRM1 expression are included (right).
Fig. 3
Fig. 3
A biology-guided drug combination screen reveals potential synergistic treatments in GBM. A custom-made library containing 88 drugs was screened on the murine GL261 GBM cell line in a dose-effect manner alone or in association with Alisertib 1 μM, Vistusertib 250 nM, Prexasertib 10 nM or Panobinostat 10 nM (technical duplicate per condition in one experiment). After 72 h of drug incubation, cell viability was assessed using CellTiter Glo®. Radar plots show the difference in AUC between the combinatorial treatment and the monotherapy condition (combination with Alisertib: dark blue line, Vistusertib: yellow line, Prexasertib: pink line and Panobinostat: light blue line). Radar plots were made up of 7 data rings on a scale from −20%.mol.L−1 (inner ring) to +15%.mol.L−1 (outer ring) with an increment of 5%.mol.L−1. Green rings represent potentially antagonistic combinations (AUC differences <−5%.mol.L−1) and the red ones indicate potentially synergistic treatments (AUC differences >5%.mol.L−1). Radar plots representation of data obtained with (a) 15 epidrugs, (b) 24 repurposed drugs, and (c) 49 targeted therapies.
Fig. 4
Fig. 4
Validation of drug combinations in spheroid GBM models. A 6 × 5 matrix was used to test drug combinations in GL261 (panels a to f) and U87 (panels g to l) spheroid models. Heat maps representing the Bliss score for three tested combinations: Panobinostat/Birabresib (panels a and g), Prexasertib/Mirdametinib (panels b and h) and Alisertib/Birabresib (panels c and i). Representative photographs of GL261 (panels d to f) and U87 (panels j to l) tumor spheroids at day 14 and mean decrease in spheroid growth are indicated. Scale bar, 1 mm. All values are the average of at least three independent experiments ± standard error of mean (S.D), with a technical duplicate in each experiment.
Fig. 5
Fig. 5
Alisertib/Birabresib combination is highly effective in ex vivo GBM organotypic model. (a) For 5 consecutive days, mouse brain slices with mtDsRed-expressing GL261 were exposed to daily doses of Alisertib 2.5 μM alone (blue), Birabresib 1 μM alone (red) or their combination (purple). GL261 tumor growth was measured over 14 days by acquisition of the mtDsRed signal with the Pherastar® plate reader (well-scanning mode). Values are the average of n = 5 samples per condition, Error bars, S.D; ∗, p < 0.05; ∗∗, p < 0.01; ∗∗∗, p < 0.001, ANOVA test. Representative photographs, acquired with the JuLi™ Stage live imaging system, of mtDsRed-expressing GL261 tumor micro-masses grafted in slices of healthy mouse brain. Scale bar: 1 mm. (b) For 5 consecutive days, mouse brain slices grafted with GFP-expressing GBM6 cells were exposed to daily doses of Alisertib 100 nM alone, Birabresib 500 nM alone or their combination. Quantification of GFP-GBM6 tumor size measured over 11 days using ZEISS ZEN software. Results were expressed as percentage of spheroid growth in treated vs. control organotypic models (CTRL at day 0). Values are the average of n = 6 samples per condition, Error bars, S.D; ∗, p < 0.05; ∗∗, p < 0.01, ∗∗∗, p < 0.001, ANOVA test. Representative images of GFP-GBM6 tumor spheroids grafted in slices of healthy mouse brain. Scale bars: 1 mm. (c) Representative images of hematoxylin–eosin (H&E), Ki67 and cleaved caspase-3 staining of GBM6-GFP tumours from organotypic co-cultures treated with vehicle alone (CTRL), Alisertib 100 nM alone, Birabresib 500 nM alone or their combination at day 11. Scale bar: 100 μm.
Fig. 6
Fig. 6
Alisertib/Birabresib combination is highly effective in in vivo orthotopic mouse model. (a) Kaplan–Meier survival and (b) weight of murine GBM-bearing mice treated by oral gavage 5 time a week over 3 weeks, starting 1 week after orthotopic injection of GL261 cells, with vehicle only (1/10 DMSO in corn oil; vehicle; black), Alisertib (75 mg/kg; blue), Birabresib (25 mg/kg; red) or the combination of both drugs (purple). ∗∗∗, p < 0.001, log rank test (Mantel–Cox test). (n >9 mice per group) (c) Representative images of hematoxylin–eosin (H&E) and Ki67 staining of GL261 tumors from mice treated with vehicle (CTRL group at day 24; top panel) or combination of Alisertib and Birabresib (at day 120; bottom panel). Arrowheads show Ki67 positive cells. Full brain coronal section (top and bottom left panels) and magnification (top and bottom middle and right panels). Scale bar: 500 μm.

References

    1. Kumar-Sinha C., Chinnaiyan A.M. Precision oncology in the age of integrative genomics. Nat Biotechnol. 2018;36(1):46–60. - PMC - PubMed
    1. Xiang Y., Ye Y., Zhang Z., Han L. Maximizing the utility of cancer transcriptomic data. Trends Cancer. 2018;4(12):823–837. - PubMed
    1. Hopkins A.L. Network pharmacology: the next paradigm in drug discovery. Nat Chem Biol. 2008;4(11):682–690. - PubMed
    1. Al-Lazikani B., Banerji U., Workman P. Combinatorial drug therapy for cancer in the post-genomic era. Nat Biotechnol. 2012;30(7):679–692. - PubMed
    1. Peters J.U. Polypharmacology - foe or friend? J Med Chem. 2013;56(22):8955–8971. - PubMed