. 2023 Sep 12;56(9):2086-2104.e8.
doi: 10.1016/j.immuni.2023.07.015. Epub 2023 Aug 11.

CTLA-4 blockade induces a microglia-Th1 cell partnership that stimulates microglia phagocytosis and anti-tumor function in glioblastoma

Affiliations

CTLA-4 blockade induces a microglia-Th1 cell partnership that stimulates microglia phagocytosis and anti-tumor function in glioblastoma

Dan Chen et al. Immunity. .

Abstract

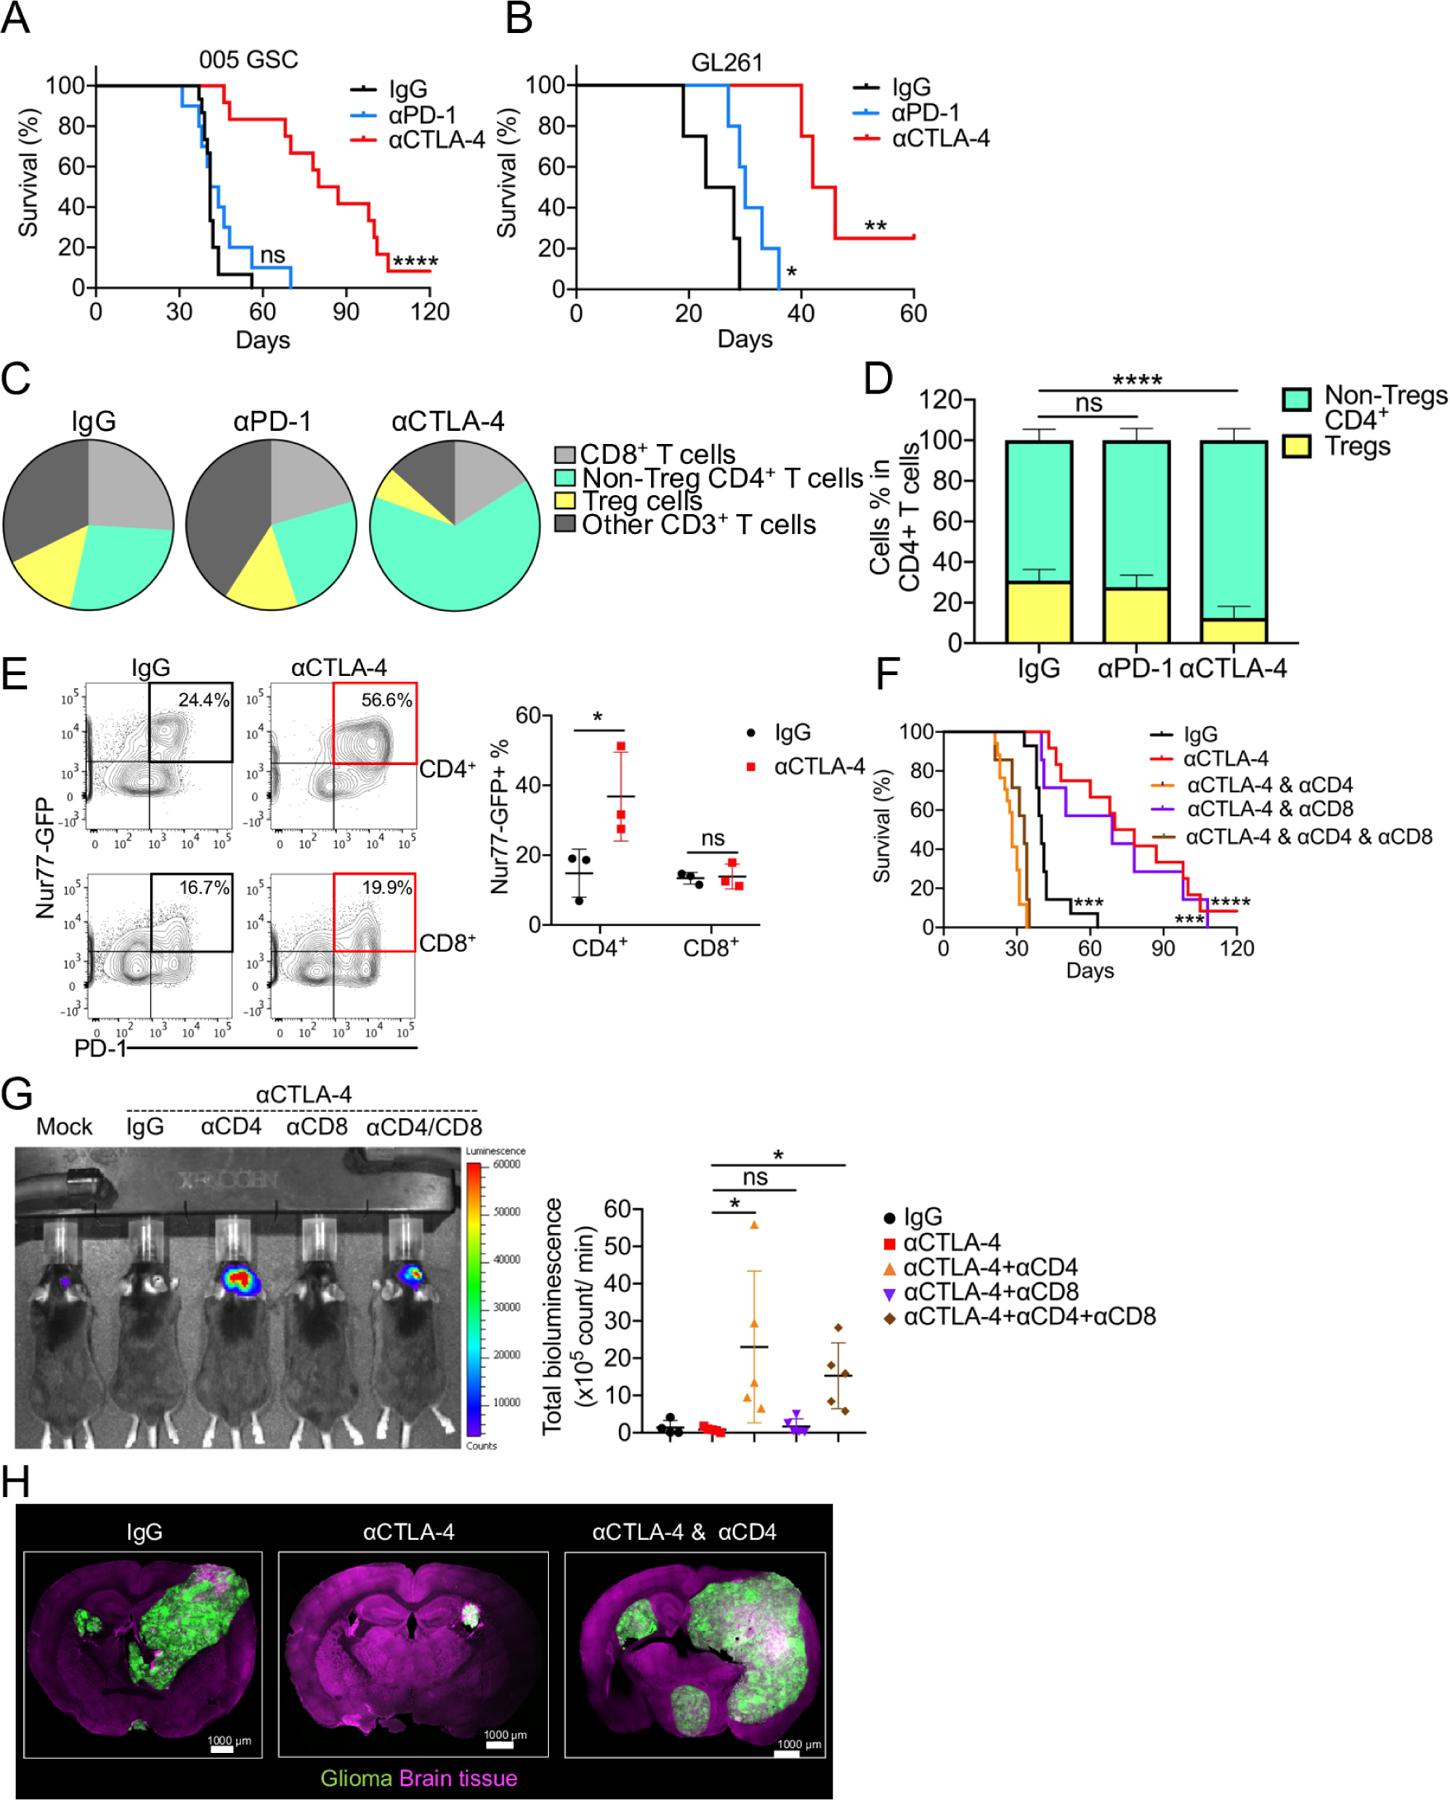
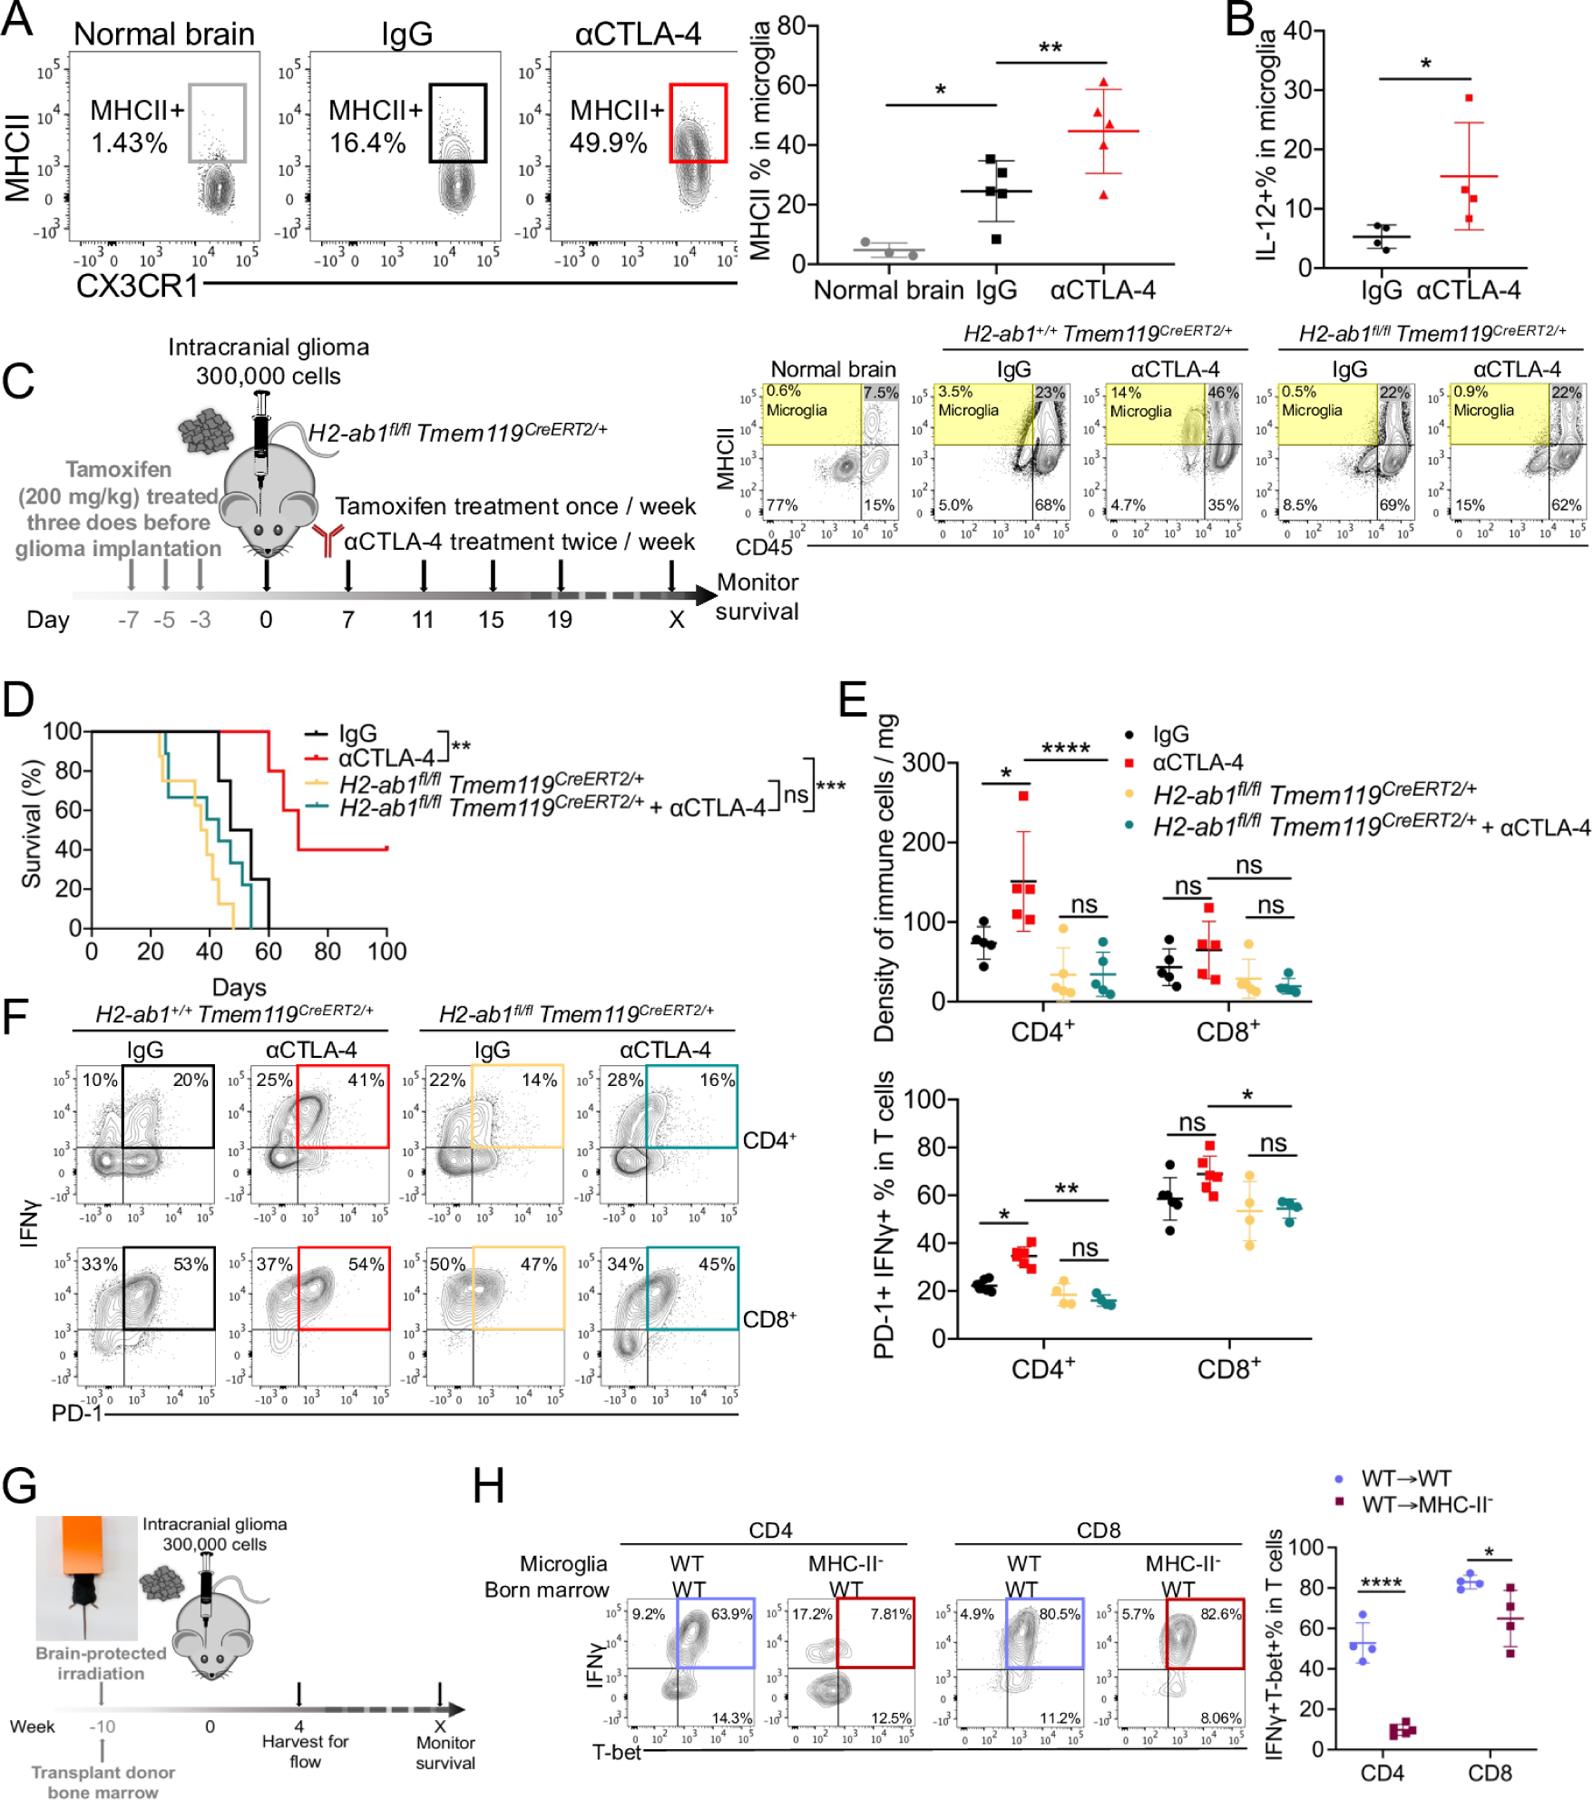
The limited efficacy of immunotherapies against glioblastoma underscores the urgency of better understanding immunity in the central nervous system. We found that treatment with αCTLA-4, but not αPD-1, prolonged survival in a mouse model of mesenchymal-like glioblastoma. This effect was lost upon the depletion of CD4+ T cells but not CD8+ T cells. αCTLA-4 treatment increased frequencies of intratumoral IFNγ-producing CD4+ T cells, and IFNγ blockade negated the therapeutic impact of αCTLA-4. The anti-tumor activity of CD4+ T cells did not require tumor-intrinsic MHC-II expression but rather required conventional dendritic cells as well as MHC-II expression on microglia. CD4+ T cells interacted directly with microglia, promoting IFNγ-dependent microglia activation and phagocytosis via the AXL/MER tyrosine kinase receptors, which were necessary for tumor suppression. Thus, αCTLA-4 blockade in mesenchymal-like glioblastoma promotes a CD4+ T cell-microglia circuit wherein IFNγ triggers microglia activation and phagocytosis and microglia in turn act as antigen-presenting cells fueling the CD4+ T cell response.

Keywords: AXL; CD4(+) T cell; CTLA-4; MER; MHC-II; glioblastoma; immunotherapy; microglia.


Conflict of interest statement

Declaration of interests S.M.K. is on the scientific advisory boards and has equity in EvolveImmune Therapeutics, Affini-T Therapeutics, Arvinas, and Pfizer.

Figures

Figure 1.
Figure 1.. αCTLA-4 therapy prolongs glioblastoma survival in a CD4+ T-cell dependent manner.
(A) Median survival of IgG (41 days; n = 15) was compared with αCTLA-4 (83.5 days; n = 12, p = 0.000002), αPD-1 (42.5 days; n = 10, p = 0.2632) by log-rank analysis. (B) Median survival of IgG (25.5 days; n = 5) was compared with αCTLA4 (44 days; n = 6, p = 0.0067), αPD-1 (30 days; n = 5, p = 0.044) by log-rank analysis. (C) Pie charts showing the relative proportion of T cell subpopulation changes. (D) Frequency of Treg and non-Treg CD4+ T cells in CD4+ T cells. (E) Representative flow plots and summarized frequencies of Nur77-GFP expression in CD4+ or CD8+ T cells. (F) Median survival of IgG (40 days; n = 14) was compared with αCTLA-4 (74 days; n = 11, p = 0.000008). Similarly, αCTLA-4 was compared with αCTLA-4 combined with αCD4 (30 days; n = 13, p < 0.000001), αCTLA-4 combined with αCD8 (69 days; n = 7, p = 0.6107), and αCTLA4 combined with αCD8 and αCD4 (33 days; n = 7, p=0.000002) by log-rank analysis. (G) 005-Luc GSCs-bearing mice were imaged on day 35. Bioluminescence was quantified. (H) The localization of 005 cells in the brain was analyzed by immunofluorescence confocal imaging. All scale bars indicate 1000 μm. All results were pooled from or representative of 2–4 experiments with n = 4 mice / group (C), n = 5–13 mice / group (D), n = 3 mice / group (E), n = 5 mice / group (G), n = 4 mice / group (H).
Figure 2.
Figure 2.. Th1 cells are essential for anti-tumor immunity and long-term survival in glioblastoma.
(A) Uniform manifold approximation and projection (UMAP) of single-cell RNA-seq from IgG and αCTLA-4 treated 005 tumors. (B) The highly expanded clonotypes was displayed overlaid with the UMAP in each subset from A. (C) Shared clonotype analysis in non-Treg CD4+ T cells between IgG vs. αCTLA-4 treatment by alluvial clonotypes. (D) Feature plot showed Ifng and Tbx21 in the different clusters between IgG vs. αCTLA-4 as defined in A. (E) Heatmap of expression dynamics of transcription factors, cytokines and others enriched in the different clusters between IgG vs. αCTLA-4. (F) The expression of IFNγ, TNF, IL-2 in CD4+ T cells from harvested brains. (G) Tbx21+/+ or Tbx21−/− mice were implanted 005 GSCs and with indicated treatment. Median survival of IgG (53 days; n = 5) was compared with αCTLA-4 (77.5 days; n = 6, p = 0.00369). Median survival of Tbx21−/− (37 days, n=5) was compared with Tbx21−/− treated with αCTLA-4 (33 days; n = 7, p = 0.85176). Similarly, comparison of αCTLA-4 treatment of wild-type B6 mice with that of Tbx21−/− (33 days; n = 7, p = 0.00036), as well as the corresponding comparison in αCTLA-4 combined with αIFNγ (43 days; n = 9, p = 0.00045), were done by log-rank analysis. All the results were pooled from or representative of 2–4 experiments with n = 3–5 mice / group (A-E), n = 4–11 mice / group (F).
Figure 3.
Figure 3.. Anti-glioblastoma immune response depends on CD11c+ cells, but not depends on monocytes/macrophages.
(A) tSNE plot of005 tumors. (B) Feature plots from (A) of H2-ab1 gene. (C) MFI of MHC-II in different subsets from normal brain or IgG vs. αCTLA-4 treated glioma. (D-I) CD11cDTR or CD169DTR mice or littermate control (DTR-negative) mice were transplanted 005 GSCs and with indicated treatment. On day 14, all mice were administered 5 μg/kg DT (i.p.) twice/week for 2 weeks. The efficacy of depletion of CD11c+ or CD169+ cells was assessed by flow cytometry (E). The density of CD4+ T cells (F, H), and the percentages of PD-1+IFNγ+ of CD4+ cells (G, I), in brain tumor tissues from different treatment groups were measured and quantified by flow cytometry. (J-K) The density of CD4+ T cells (J) and the frequency of PD-1+IFNγ+ CD4+ T cells (K) were measured by flow cytometry on day 35 in C57BL/6 or Ccr2−/− mice. (L) CD4+ T cells (CD45hiCD4+), microglia (CD45intCX3CR1+), and CD11b+ myeloid (CD45hiCD11b+) cells were isolated from glioma-bearing brains and co-cultured in-vitro in the presence of GolgiPlug for 6 hours as indicated. IFNγ production was measured by flow cytometry. (M) Mice from different groups received control chow or PLX3397 chow (290 mg/kg) for 14 days before tumor implantation (Pre-PLX3397), or 14 days post tumor implantation (Post-PLX3397). Kaplan-Meier curves showed median survival of the different groups: (1) IgG (33 days; n = 11), (2) αCTLA-4 (54.5 days; n = 8, p = 0.014669 compared to IgG), (3) Pre-treated PLX3397 (26 days; n = 11, p = 0.042352 compared to IgG), (4) Pre-PLX3397 with αCTLA-4 (23.5 days; n = 14, p = 0.000018 compared to αCTLA-4), (5) post-PLX3397 (28 days; n = 5, p = 0.1489 compared to IgG), (6) post-PLX3397 with αCTLA-4 (24 days; n = 4, p = 0.003591 compared to αCTLA-4) by log-rank analysis. (N) Representative flow plots and cumulative bar graphs of the frequency of IFNγ+TNFα+ in CD4+ T cells. All results were pooled from or representative of 2–4 experiments with n = 3–5 mice / group (A-B), n = 5 mice / group (C), n = 3–7 mice / group (E-G), n = 3–6 mice / group (H-I), n = 3 mice / group (J-K), n = 5–7 mice / group (L), n = 3–10 mice / group (N).
Figure 4.
Figure 4.. The correlation of microglia with IFNG from T cells and survival of glioma patients.
(A-E) Correlation plots between TMEM119 vs. CD4 (A, r=0.7), TMEM119 vs. HLA-DMB (B, r=0.586), HLA-DMB vs. CD4 (C, r=0.733), TMEM119 vs. CD8 (D, r=0.223) (A-D) and heat map of indicated genes (E) within Glioblastoma Multiforme samples from The Cancer Genome Atlas (TCGA) datasets,. (F) Overall Survival (OS) analysis of glioma patients from TCGA datasets, whose tumors display low (red) or high (blue) ratios of P2RY12/CD163 mRNAs. (G) UMAP with 13 annotated clusters from scRNA-seq of human gliomas (GEO: GSE182109). (H) Nine myeloid clusters in the UMAP. (I) Feature plot showing P2RY12 in the microglia and CD163 in the macrophage clusters. (J) Dot plot showing expression of selected marker genes in microglia and macrophages. (K-N) Box plot displaying the ratio of Microglia/Macrophages (K), the ratio of P2RY12+ cells/CD163+ cells (L), the percent of CD4+ T cells/immune cells (M), and the expression level of IFNG from T cells (N) in every fragment stratified by four different glioma cellular states. Error bars indicate standard deviation (SD), and the pairwise difference between averages (red dots) is significant by Games-Howell test (significant adjusted P value <0.05, only significant one is shown). (O) Quantification of the expression level of IFNG in T cells and the ratio of P2RY12 level in microglia and CD163 in macrophages in each Fragment from ndGBM samples (new diagnosed GBM). Pearson correlation is indicated between the expression level of IFNG in T cells and the ratio of P2RY12 in microglia / CD163 in macrophages from ndGBM samples.
Figure 5.
Figure 5.. MHC-II on microglia is required for CD4+ T cells activation and tumor control.
(A) The expression of MHC-II was measured and quantified in microglia. (B) The percentage of IL-12 in microglia was quantified from IL-12YFP reporter mice. (C-F) H2-ab1fl/flTmem119CreERT2/+ mice were treated with 200 mg/kg tamoxifen for 1 week, and then implanted with 3 × 10⁵ 005 GSCs on day 0, and with indicated treatment. The efficacy of depletion of MHC-II on microglia was checked by flow cytometry (C). Median survival of IgG (50.5 days; n = 4) was compared with αCTLA-4 (70 days; n = 5, p = 0.00717). Median survival of H2-ab1fl/flTmem119CreERT2/+ (39 days, n=7) was compared with H2-ab1fl/flTmem119CreERT2/+ treated with αCTLA-4 (49 days; n = 6, p = 0.022187). Similarly, wild-type B6 mice treated with αCTLA-4 was compared with H2-ab1fl/flTmem119CreERT2/+ treated with αCTLA-4 (p = 0.00191) by log-rank analysis (D). The density CD4+ and CD8+ T cells (E), and PD-1+ IFNγ+ of CD4+ or CD8+ T cells (F) in brain tumor tissues from different treatment groups were measured by flow cytometry. (G-H) Bone marrow (BM) chimeras were generated by using C57BL/6 (Ly5.1) BM injected into Ly5.1 or MHC-II mice at 5 × 10⁶ cells per recipient 4 hours after lead shield brain-protected 1200 Rads irradiation (G). Brain tissues were harvested on day 35 after 005 implantation, and T-bet+ IFNγ+ of CD4+ or CD8+ T cells (H) in brain tumor tissues were measured by flow cytometry. All results were pooled from or representative of 2–4 experiments with n = 3–5 mice / group (A), n = 4 mice / group (B), n = 4–6 mice / group (E-F), n = 4 mice / group (G-H).
Figure 6.
Figure 6.. CD4+ T cells regulate MHC-II expression on microglia.
(A) Volcano plots of genes present the magnitude (log2 (fold change), x-axis) and significance (− log10 (adjusted P value), y-axis) for microglia from αCTLA-4 vs. αCTLA-4+αCD4 from sc-RNAseq. Each spot represents a transcript. Two vertical dashed lines represent the threshold of fold changes (log2 (fold change)>1 or< −1). (B) Bar chart of clustered enrichment ontology categories was performed by Metascape on all (differentially expressed genes) DEGs in microglia from αCTLA-4 versus αCTLA-4+αCD4. (C) Representative flow plots of the expression of MHC-II on microglia. (D) tSNE plots of antigen presentation associated markers (Cd74, H2-Ab1, Cd 86, Tap1) from all the clusters in each condition (Normal brain, IgG, αCTLA-4, and αCTLA-4+αCD4). (E) Heatmap showed the expression dynamics of selected genes enriched in the different myeloid clusters from each condition. (F-G) The MHC-II expression on microglia (F) or macrophages (G) were measured in indicated condition. (H) The localization of Iba1+, CD4+, MCHII+ cells in the brain were analyzed by immunofluorescence confocal imaging. Top scale bars indicate 150 μm, and bottom scale bars indicate 30 μm. All results were pooled from or representative of 2–4 experiments with n = 3–5 mice / group (A-B, D-E), n = 6–11 mice / group (C), n = 5–8 mice / group (F-G), n = 4 mice / group (H).
Figure 7.
Figure 7.. Tumoricidal activities of microglia are dependent on TAM receptor (AXL/MER).
(A) Median survival of IgG (29 days; n = 7) was compared with αCTLA-4 (45 days; n = 5, p = 0.009). Median survival of Ciita sgRNA (27.5 days, n=5) was compared with Ciita sgRNA treated with αCTLA-4 (39 days; n = 9, p = 0.0085). Similarly, comparison of αCTLA-4 treatment of WT 005 with that of Ciita sgRNA 005 (p = 0.876) were done by log-rank analysis. (B) Median survival of IgG (27 days; n = 4) was compared with αCTLA-4 (49.5 days; n = 4, p = 0.00673). Median survival of Ifngr1 sgRNA (21 days, n=9) was compared with Ifngr1 sgRNA treated with αCTLA-4 (21 days; n = 9, p = 0.4679). Similarly, comparison of αCTLA-4 treatment of WT 005 with that of Ifngr1 sgRNA 005 (p = 0.00213) were done by log-rank analysis. (C) tdTomato 005 GSCs cells were treated with IFNγ (10 ng/ml) or Rotenone (100 nM) overnight. Microglia isolated from Cx3cr1GFP/+ mice were co-cultured with tdTomato 005 GSCs from different conditions in-vitro for 4 hours. tdTomato signal from microglia was measured by flow cytometry. (D) Heatmap showing the level of apoptotic cell clearance associated genes in microglia from bulk RNA-seq in different treatment among IgG vs. αCTLA-4 vs. αCTLA-4+ αCD4. (E) The localization of Iba1+, AXL+ cells in the brain were analyzed by immunofluorescence confocal imaging. The colocalization of Iba1+ and AXL+ was indicated as white. The average MFI of AXL was quantified. (F) Rag1−/− recipient mice were transferred with or without CD4+ T cells (1×10⁶) cells on day 0. All Rag1−/− mice were implanted with 3 × 10⁵ 005 GSCs on day 1. AXL expression on microglia within tumor tissue were analyzed and quantified on day 35. (G) AxlF/FMertkF/FCx3cr1CreERT mice were treated with 150 mg/kg tamoxifen for two doses 48 hours apart. The efficiency of AXL and MER depletion was checked. (H) tdTomato 005 GSCs cells were treated with IFNγ (10 ng/ml) overnight and then incubated with microglia isolated from Axl−/−Mertk−/−Cx3cr1GFP/+or Cx3cr1GFP/+ mice for 4 hours and the tdTomato signal from microglia was measured. (I) AxlF/FMertkF/FCx3cr1CreERT mice were treated with 150 mg/kg tamoxifen for two doses 48 hours apart 1 week before, and then implanted with 3 × 10⁵ 005 GSCs on day 0 with indicated treatment. The efficacy of depletion of AXL and MER on microglia was checked by flow cytometry (left). Median survival of IgG (27 days; n = 5) was compared with αCTLA-4 (45 days; n = 5, p = 0.019). Median survival of AxlF/FMertkF/FCx3cr1CreERT (29 days, n=8) was compared with AxlF/FMertkF/FCx3cr1CreERT treated with αCTLA-4 (25.5 days; n = 9, p = 0.8502). Similarly, wild-type B6 mice treated with αCTLA-4 was compared with AxlF/FMertkF/FCx3cr1CreERT treated with αCTLA-4 (p = 0.016) by log-rank analysis (right). All results were pooled from or representative of 2–4 experiments with n = 3 mice / group (D), n = 3 mice / group (E), n = 4–6 mice / group (F). Data are expressed as mean ± SEM.

Similar articles

Cited by

References

    1. Taylor OG, Brzozowski JS, and Skelding KA (2019). Glioblastoma Multiforme: An Overview of Emerging Therapeutic Targets. Front Oncol 9, 963. 10.3389/fonc.2019.00963. - DOI - PMC - PubMed
    1. Tan AC, Ashley DM, Lopez GY, Malinzak M, Friedman HS, and Khasraw M (2020). Management of glioblastoma: State of the art and future directions. CA Cancer J Clin 70, 299–312. 10.3322/caac.21613. - DOI - PubMed
    1. Qazi MA, Vora P, Venugopal C, Sidhu SS, Moffat J, Swanton C, and Singh SK (2017). Intratumoral heterogeneity: pathways to treatment resistance and relapse in human glioblastoma. Ann Oncol 28, 1448–1456. 10.1093/annonc/mdx169. - DOI - PubMed
    1. Neftel C, Laffy J, Filbin MG, Hara T, Shore ME, Rahme GJ, Richman AR, Silverbush D, Shaw ML, Hebert CM, et al. (2019). An Integrative Model of Cellular States, Plasticity, and Genetics for Glioblastoma. Cell 178, 835–849 e821. 10.1016/j.cell.2019.06.024. - DOI - PMC - PubMed
    1. Hara T, Chanoch-Myers R, Mathewson ND, Myskiw C, Atta L, Bussema L, Eichhorn SW, Greenwald AC, Kinker GS, Rodman C, et al. (2021). Interactions between cancer cells and immune cells drive transitions to mesenchymal-like states in glioblastoma. Cancer Cell 39, 779–792 e711. 10.1016/j.ccell.2021.05.002. - DOI - PMC - PubMed

Publication types