. 2023 Sep 12;56(9):2036-2053.e12.
doi: 10.1016/j.immuni.2023.07.014. Epub 2023 Aug 11.

Loss of CD4+ T cell-intrinsic arginase 1 accelerates Th1 response kinetics and reduces lung pathology during influenza infection

Affiliations

Loss of CD4+ T cell-intrinsic arginase 1 accelerates Th1 response kinetics and reduces lung pathology during influenza infection

Erin E West et al. Immunity. .

Abstract

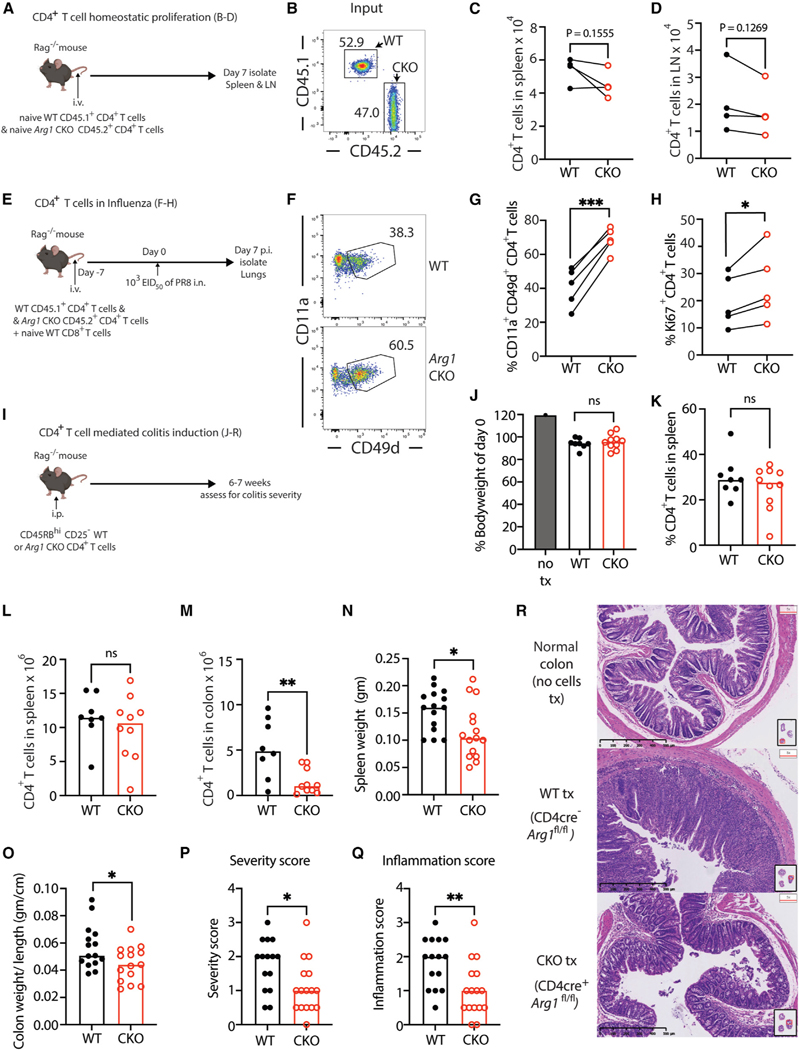
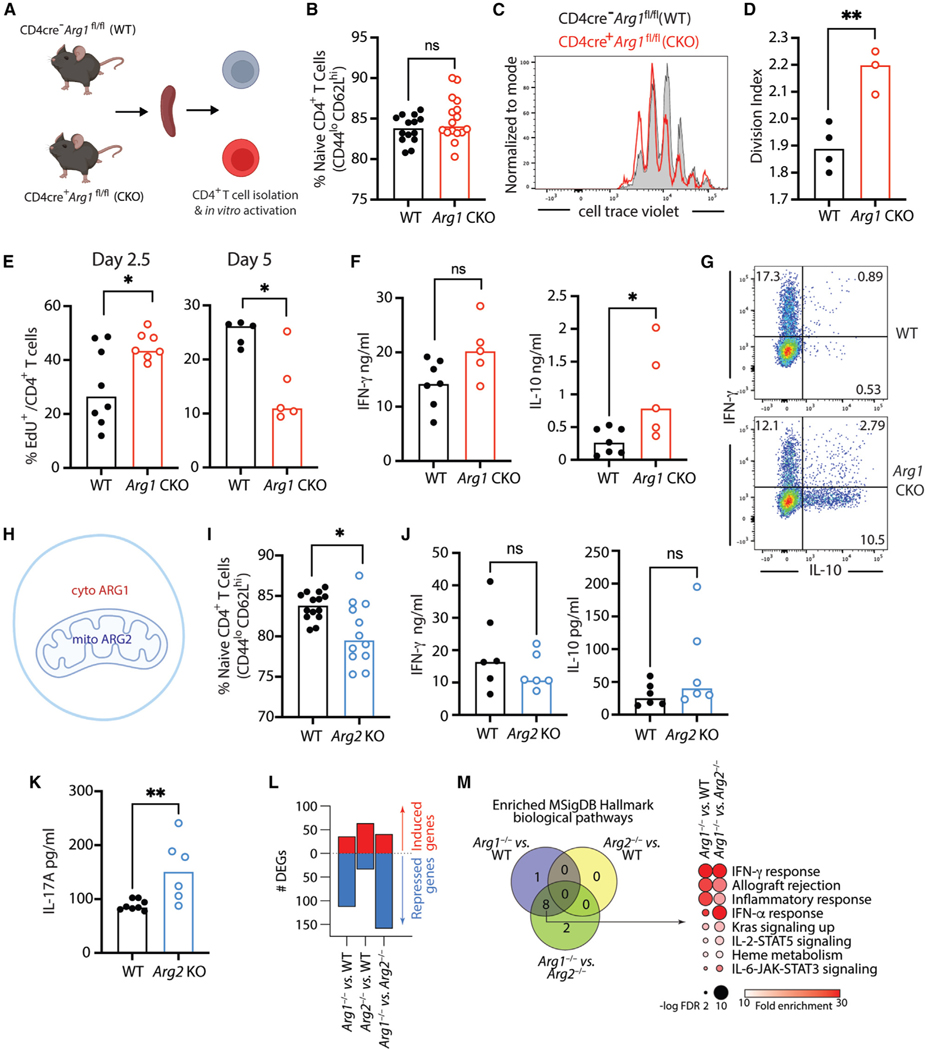
Arginase 1 (Arg1), the enzyme catalyzing the conversion of arginine to ornithine, is a hallmark of IL-10-producing immunoregulatory M2 macrophages. However, its expression in T cells is disputed. Here, we demonstrate that induction of Arg1 expression is a key feature of lung CD4+ T cells during mouse in vivo influenza infection. Conditional ablation of Arg1 in CD4+ T cells accelerated both virus-specific T helper 1 (Th1) effector responses and its resolution, resulting in efficient viral clearance and reduced lung pathology. Using unbiased transcriptomics and metabolomics, we found that Arg1-deficiency was distinct from Arg2-deficiency and caused altered glutamine metabolism. Rebalancing this perturbed glutamine flux normalized the cellular Th1 response. CD4+ T cells from rare ARG1-deficient patients or CRISPR-Cas9-mediated ARG1-deletion in healthy donor cells phenocopied the murine cellular phenotype. Collectively, CD4+ T cell-intrinsic Arg1 functions as an unexpected rheostat regulating the kinetics of the mammalian Th1 lifecycle with implications for Th1-associated tissue pathologies.

Keywords: IFN-γ; IL-10; Th1 immunity; arginase 1; arginase 1 deficiency; autoimmunity; cell metabolism; complement; glutamine; influenza infection.


Conflict of interest statement

Declaration of interests M.S. is an inventor on a patent describing the use of RBD ligands for cell-surface evaluation of CAT1/solute carrier family 7 member 1 (SLC7A1) and other solute carrier (SLC) expression (N.T. gave up her rights); he is a co-founder and head of the scientific board of METAFORA-Biosystems, a start-up company that focuses on metabolite transporters under physiological and pathological conditions.

Figures

Figure 1.
Figure 1.. T cell-intrinsic arginase 1 modulates tissue pathology during influenza infection
(A) Experimental setup for (A)–(F), n = 3 individual mice/group. (B) Volcano plot from RNA-seq identifying differentially expressed genes (DEGs), with at least log2 4-fold change at FDR < 0.05, between virus-induced lung and splenic CD4+ T cells. (C) Induced genes from (B) ranked by fold induction. (D) Heatmap of gene expression induction of all induced enzymes (orange) with Arg1 position indicated (red). (E and F) Representative (E) RNA-seq tracks of the Arg1 locus and (F) Arg1 expression (RNA-seq) in splenic and lung CD4+ T cells after influenza infection. (G) Experimental setup for (H)–(K). (H) Representative fluorescence-activated cell sorting (FACS) plots of ARG1 protein expression in WT and Arg1 CKO mice. (I) Viral titers in the lung at days 7 and 9 p.i. Representative experiment (of two independent experiments) shown with n = 4–5 mice per group per time point. (J) Representative hematoxylin and eosin (H&E) histology staining and (K) pathology score of the lungs at day 9 p.i. Combined data from two independent experiments, n = 11–13. *p < 0.05 (two-tailed Student’s t test). Each dot represents a sample from an individual mouse. See also Figure S1.
Figure 2.
Figure 2.. CD4+ T cell arginase 1 controls the kinetics of the Th1 influenza response
(A) Experimental setup for (B)–(L). (B and C) Numbers of (B) total lung mononuclear cells and (C) lung CD4+ T cells at days 7 and 9 p.i., n = 12–17. (D and E) Representative FACS plots showing (D) influenza-specific (NP311–325 tetramer+) lung CD4+ T cells and their CD11a and CD49d expression (in red) and (E) percentages of lung CD11a+ CD49d+ cells. (F–H) Numbers of lung (F) CD11a+ CD49d+ CD4+ T cells, (G) Ki67+ CD4+ T cells, and (H) NP311–235 tetramer+ CD4+ T cells at days 7 and 9 p.i. in WT and Arg1 CKO mice, n = 4–6. (I and J) Representative FACS plots of (I) lung NP311–235 tetramer+ CD4+ T cells and (J) T-bet expression by CD11alo CD49dlo, CD11a+CD49d+, and NP311–235 tetramer+ CD4+ T cells at day 9 p.i. (K and L) Numbers of (K) intracellular IFN-γ+, IL-2+, and IL-10+-producing lung CD4+ T cells (at day 7 p.i. and after in vitro restimulation with PR8-infected or non-infected dendritic cells), with (L) a representative FACS plot of data in (K), n = 14–15. *p < 0.05, **p < 0.01. (B and C) Kruskal-Wallis test; (F–I and L) Mann-Whitney test. ns, no statistically significant difference. (B, C, K, and L) Combined data from three individual experiments. (F–H) One representative of three independent experiments shown. Each dot represents a sample from an individual mouse. See also Figure S2.
Figure 3.
Figure 3.. Arg1 regulation of CD4+ T cell responses and pathology is CD4+ T cell-intrinsic
(A) Experimental setup for (B)–(D). (B) Representative FACS plot showing transferred WT and Arg1 CKO CD4+ T cells. (C and D) Numbers of CD4+ T cells recovered from (C) spleens and (D) lymph nodes 7 days post transfer, n = 4. (E) Experimental setup for (F)–(H). (F) Representative FACS plot of lung WT and Arg1 CKO CD11a+ CD49d+ cells at day 7 p.i. (G and H) Frequency of lung (G) CD11a+ CD49d+ CD4+ T cells and (H) Ki67+ CD4+ T cells at day 7 p.i., n = 5. (I) Experimental setup for (J)–(R). (J) Body weight of mice receiving no cells, n = 1, or WT or Arg1 CKO cells, n = 8–10. (K) Percentage of CD4+ T cells in the spleens, n = 8–10. (L and M) Numbers of CD4+ T cells in (L) spleens and (M) colons, n = 8–10. Representative of two individual experiments. (N and O) Weight of (N) spleens and (O) colons of mice injected with WT or Arg1 CKO CD4+ T cells, n = 15. (P–R) Colon pathology of mice injected with WT or Arg1 CKO based on (P) severity and (Q) inflammation, assessed via H&E histology staining. (R) Representative H&E staining of the colons. (N–Q) Combined data from two individual experiments, n = 15 individual mice/group. Each dot represents a sample from a single mouse. *p < 0.05, **p < 0.01, ***p < 0.001. (C, D, G, and H) paired Student’s t test; (J–Q) two-tailed Student’s t test.
Figure 4.
Figure 4.. Intrinsic arginase 1, but not arginase 2, deficiency alters the Th1 life cycle
(A) Experimental setup for (B)–(G). (B) Splenic naive CD4+ T cells in uninfected WT and Arg1 CKO animals, n = 14–16 (data from four combined experiments shown). (C and D) Representative (C) histogram of cell trace violet dilution at day 3 post activation and (D) division index (n = 3–4, one representative of two individual experiments shown). (E) 5-ethynyl-2′-deoxyuridine (EdU) incorporation at days 2.5 (n = 7–8) and 5 (n = 5) post activation (data from two combined individual experiments). (F) IFN-γ and IL-10 secretion at day 3 post activation (n = 5–7, data from two combined individual experiments shown). (G) Representative FACS plots showing intracellular IFN-γ and IL-10 staining at 5 days post activation. (H) Simplified schematic of ARG1 and ARG2 subcellular localization to cytoplasm (cyto) or mitochondria (mito). (I) Splenic naive CD4+ T cells in naive WT and Arg2 KO mice, n = 12–14 (data derived from four individual experiments). (J and K) CD4+ T cells from WT and Arg2 KO mice were activated in vitro for 3 days and (J) IFN-γ, IL-10, and (K) IL-17A measured (IFN-γ, n = 3; IL-10, n = 6, data from two combined individual experiments; IL-17A, n = 3–4). (L and M) RNA-seq analyses of CD4+ T cells from WT, Arg1 CKO, or global Arg2 KO mice at 22 h post in vitro activation (n = 3 individual mice/group) with (L) numbers of differentially expressed genes (DEGs) and (M) venn diagram and list of overlapping enriched biological pathways derived from DEGs. Each dot represents a sample from a single mouse. *p < 0.05, **p < 0.01. (D–F and I–K) Two-tailed Student’s t test. ns, no statistically significant difference. See also Figure S3.
Figure 5.
Figure 5.. Arginase-1-deficient CD4+ T cells generate polyamines but have metabolic perturbations
(A) Simplified diagram of the classical arginase pathway. (B–D) CD4+ T cells were isolated from the spleens of WT and Arg1 CKO mice and stimulated in vitro with anti-CD3 and anti-CD28 antibodies for 22–24 h. (B) Ornithine, n = 3 samples from individual mice, done in triplicate; (C) polyamine, n = 3 samples from individual mice; and (D) arginine abundancy in the CD4+ T cells, as determined by liquid chromatography-mass spectrometry, n = 3 samples from individual mice. (E–G) (E) Glycolysis (ECAR) and oxidative phosphorylation (OCR), as determined by Seahorse metabolomic profiling in response to oligomycin (oligo), carbonyl cyanide 4-(trifluoromethoxy) phenylhydrazone (fccp), and rotenone (rot) are shown with (F) accompanying statistical evaluation. ECAR, extracellular acidification rate; OCR, oxygen consumption rate. (E–G) n = 4, each dot represents individual mouse, one representative of three total experiments shown. *p < 0.05. (B, D, F, and G) Mann-Whitney test; (C) Kruskal-Wallis test. ns, no statistically significant difference. See also Figure S4.
Figure 6.
Figure 6.. Arginase 1-deficiency in CD4+ T cells triggers altered glutamine metabolism
(A and B) Volcano plot of (A) differential metabolite abundance in in vitro-activated (22–24 h) CD4+ T cells from WT and Arg1 CKO mice, n = 4–6. Positive and negative ionization mode features (gray), unannotated features that exceeded log2FC > 0.26 (~20% change) and adjusted p value < 0.05 (black), annotated features which exceeded log2FC > 0.26 and adjusted p value < 0.05 (red- and blue-highlighted and labeled for clarity), and (B) glutamine abundancy. (C) Simplified schematic of intersecting arginine and glutamine pathways. (D and E) Abundance of (D) glutamate and (E) α-ketoglutarate (αKG). For αKG, n = 3 individual mice shown with technical replicates. (F) Schematic of Gpt2 activity in glutamine metabolism. (G and H) Representative FACS plots showing glutamate pyruvate transaminase 2 (GPT2) protein expression in WT, (G) Arg1 KO, and (H) Arg2 KO CD4+ T cells on day 3 post in vitro activation. (I) Percentage of IFN-γ+, IL-10+, and IFN-γ-IL-10 double-positive T cells assessed via flow cytometry after in vitro stimulation with or without AOA treatment, n = 2–4 (representative of two independent experiments). *p < 0.05, **p < 0.01, ****p < 0.0001. (B, D, E, G, and I) Two-tailed Student’s t test; (L) one-way ANOVA. ns, no statistically significant difference, TCA cycle, tricarboxylic acid cycle. See also Figure S5.
Figure 7.
Figure 7.. T cell-intrinsic arginase 1 restrains human Th1 responses and Th1 contraction
(A and B) Representative FACS plots showing (A) arginase 1 (ARG1) expression and (B) CAT-1 expression at days 2 and 3 in healthy donor CD4+ T cells after in vitro stimulation, n = 4. (C) Amount of IFN-γ (left), IL-10 (middle), or ratio of IL-10 to IFN-γ (IL-10/IFN-γ) (right) secreted by CD4+ T cells after CD3+CD46 stimulation in vitro for 36 h in the presence of Nω-hydroxy-nor-L-arginine (nor-NOHA) or vehicle, n = 4. (D–K) CD4+ T cells were isolated from the blood of patients with arginase-1 deficiency (designated as P) and age-matched healthy controls (designated as HC). (D–F) IFN-γ and IL-10 secretion by CD3+CD46-activated CD4+ T cells (36 h, primary activation) with (D) individual values and (E) cumulative data for the IL-10/IFN-γ ratio during primary activation, n = 4 (four individual patients with multiple blood samples taken over a 2-year period), and (F) after CD3+CD46 restimulation for ~18–20 h post resting (5 days), n = 4 (individual patients, some with multiple blood samples taken over a 2-year period). (G and H) 5-ethynyl-2′-deoxyuridine (EdU) incorporation at day 5 post primary stimulation with (G) a representative FACS plot and (H) cumulative data, n = 2 healthy controls with technical duplicates, and n = 3 patients. (I) Percent of live CD4+ T cells after restimulation, as described under (F), n = 2 healthy controls done in duplicate and n = 3 patients, 1 with a technical duplicate. (J) Polyamine abundancy in resting CD4+ T cells. (K) Glycolysis (ECAR) and oxidative phosphorylation (OCR) as determined by Seahorse metabolomic profiling of CD4+ T cells after CD3+CD46 stimulation for 24 h. (L–O) ARG1 was over expressed in isolated CD4+ T cells from three healthy donors (n = 3) by electroporation of ARG1 into the cells with (L) a representative FACS plot showing ARG1 expression in control (CTRL) electroporated versus ARG1 electroporated CD4+ T cells prior to activation. ARG1 overexpressing or control CD4+ T cells were activated in vitro for 36 h. (M) Representative FACS plot, (N) cumulative data showing IFN-γ and IL-10 production, and (O) percent of cells that are Ki67+. (P) Pathway analysis of DEGs derived from microarray analyses of CD3+CD46-activated CD4+ T cells (6 h) from patients 1 and 2 and two age-matched healthy control cells, n = 2. *p < 0.05, **p < 0.01. (C, N, and O) Paired Student’s t test; (E, F, H, and I) Mann-Whitney test. fccp, carbonyl cyanide 4-(trifluoromethoxy) phenylhydrazone; ECAR, extracellular acidification rate; OCR, oxygen consumption rate; oligo, oligomycin; rot, rotenone. See also Figure S6 and Table S4.

References

    1. Jankovic D, Kugler DG, and Sher A. (2010). IL-10 production by CD4+ effector T cells: a mechanism for self-regulation. Mucosal Immunol. 3, 239–246. 10.1038/mi.2010.8. - DOI - PMC - PubMed
    1. Khan U, and Ghazanfar H. (2018). T lymphocytes and autoimmunity. Int. Rev. Cell Mol. Biol 341, 125–168. 10.1016/bs.ircmb.2018.05.008. - DOI - PubMed
    1. Chauss D, Freiwald T, McGregor R, Yan B, Wang L, Nova-Lamperti E, Kumar D, Zhang Z, Teague H, West EE, et al. (2022). Autocrine vitamin D signaling switches off pro-inflammatory programs of TH1 cells. Nat. Immunol 23, 62–74. 10.1038/s41590-021-01080-3. - DOI - PMC - PubMed
    1. Gazzinelli RT, Wysocka M, Hieny S, Scharton-Kersten T, Cheever A, Kühn R, Muüller W, Trinchieri G, and Sher A. (1996). In the absence of endogenous IL-10, mice acutely infected with Toxoplasma gondii succumb to a lethal immune response dependent on CD4+ T cells and accompanied by overproduction of IL-12, IFN-gamma and TNF-alpha. J. Immunol 157, 798–805. - PubMed
    1. Sun J, Madan R, Karp CL, and Braciale TJ (2009). Effector T cells control lung inflammation during acute influenza virus infection by producing IL-10. Nat. Med 15, 277–284. 10.1038/nm.1929. - DOI - PMC - PubMed

Publication types