. 2023 Aug 31;186(18):3862-3881.e28.
doi: 10.1016/j.cell.2023.07.021. Epub 2023 Aug 11.

A neural circuit for male sexual behavior and reward

Affiliations

A neural circuit for male sexual behavior and reward

Daniel W Bayless et al. Cell. .

Erratum in

  • A neural circuit for male sexual behavior and reward.
    Bayless DW, Davis CO, Yang R, Wei Y, Miessler de Andrade Carvalho V, Knoedler JR, Yang T, Livingston O, Lomvardas A, Martins GJ, Vicente AM, Ding JB, Luo L, Shah NM. Bayless DW, et al. Cell. 2024 Jul 11;187(14):3783. doi: 10.1016/j.cell.2024.05.047. Epub 2024 May 29. Cell. 2024. PMID: 38810643 Free PMC article. No abstract available.

Abstract

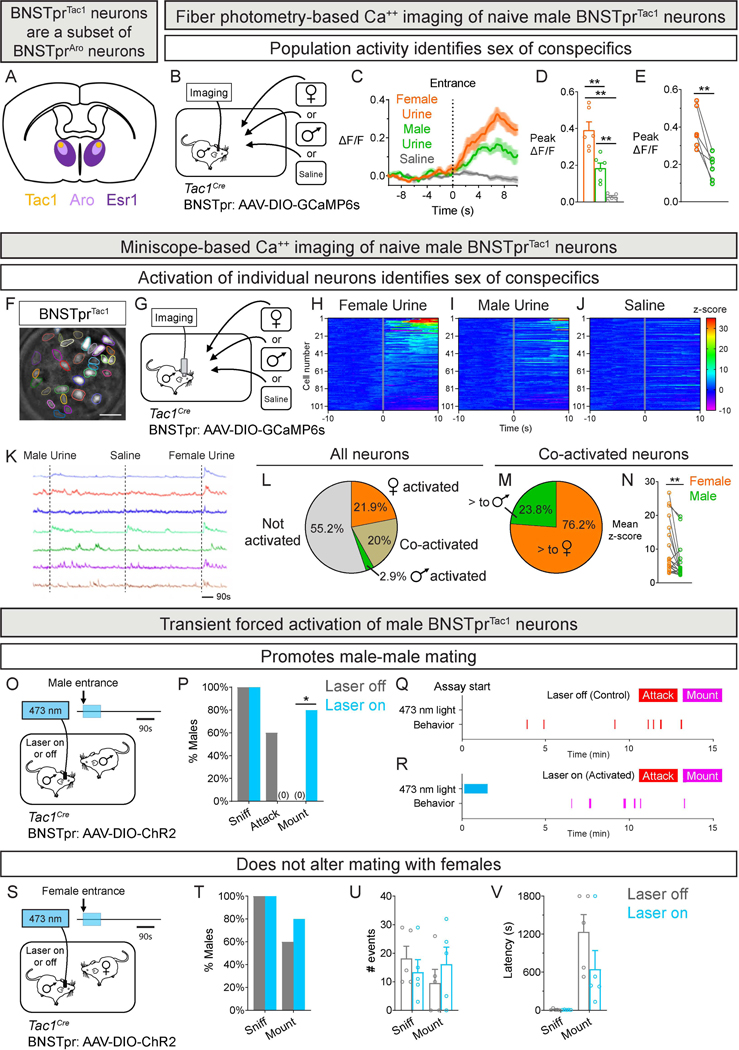
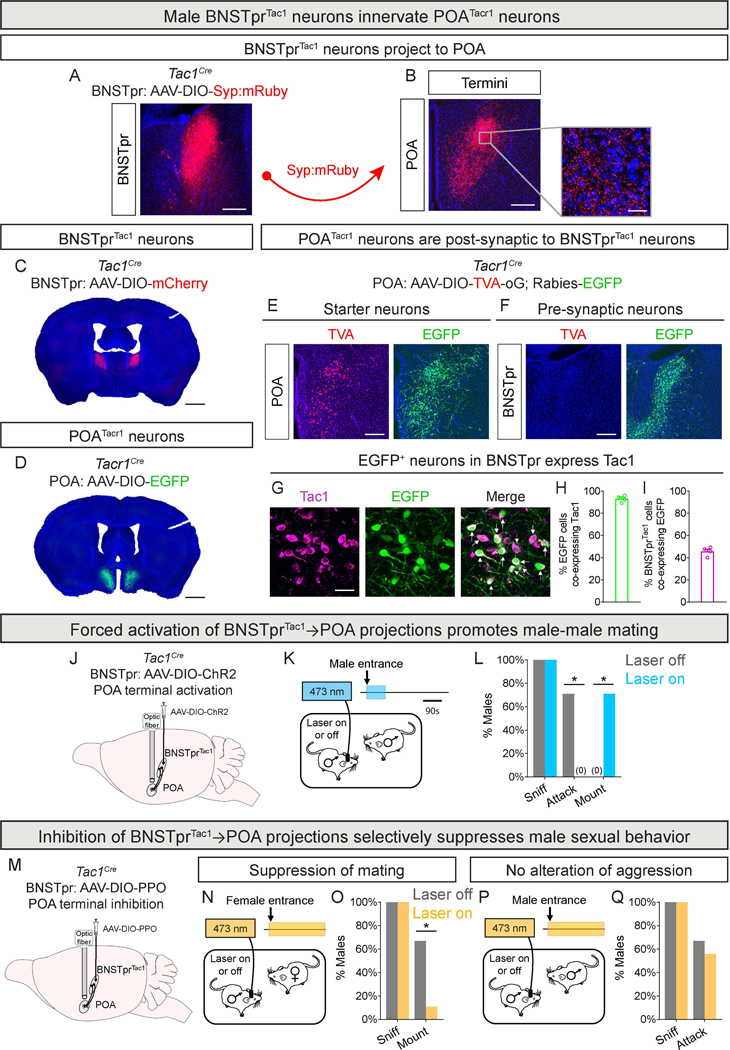
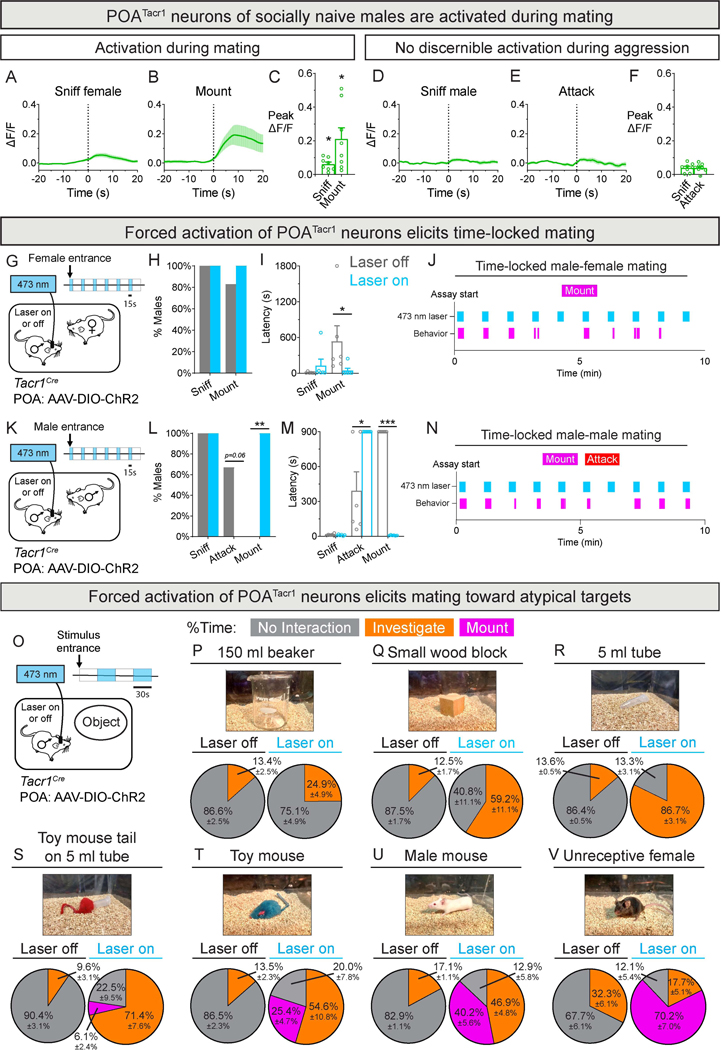
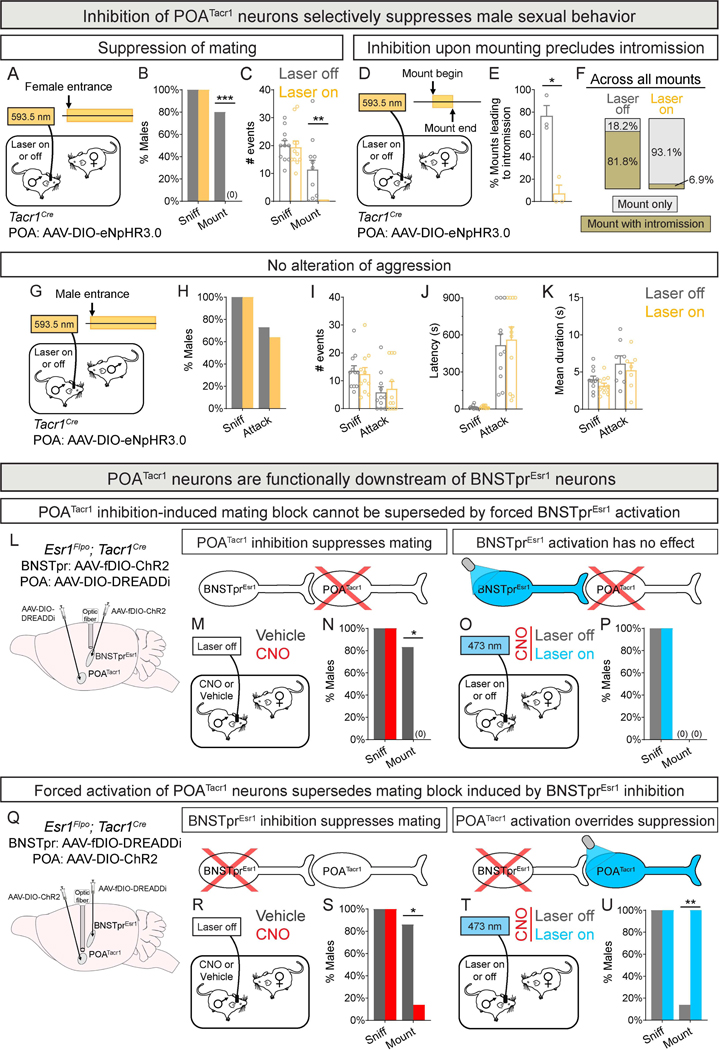
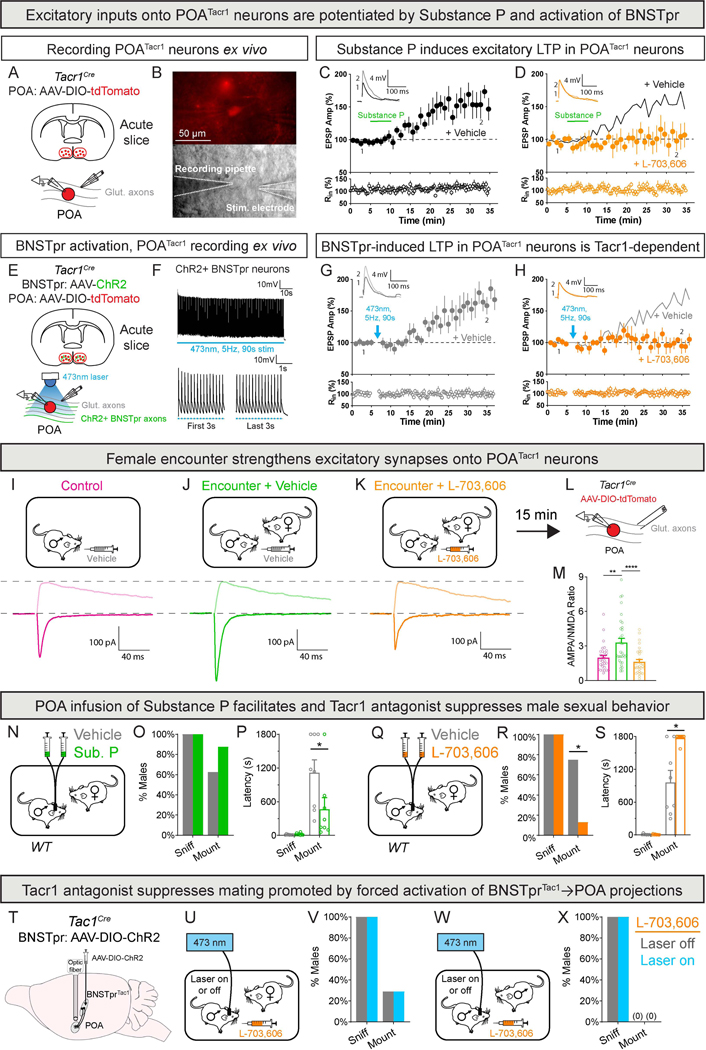
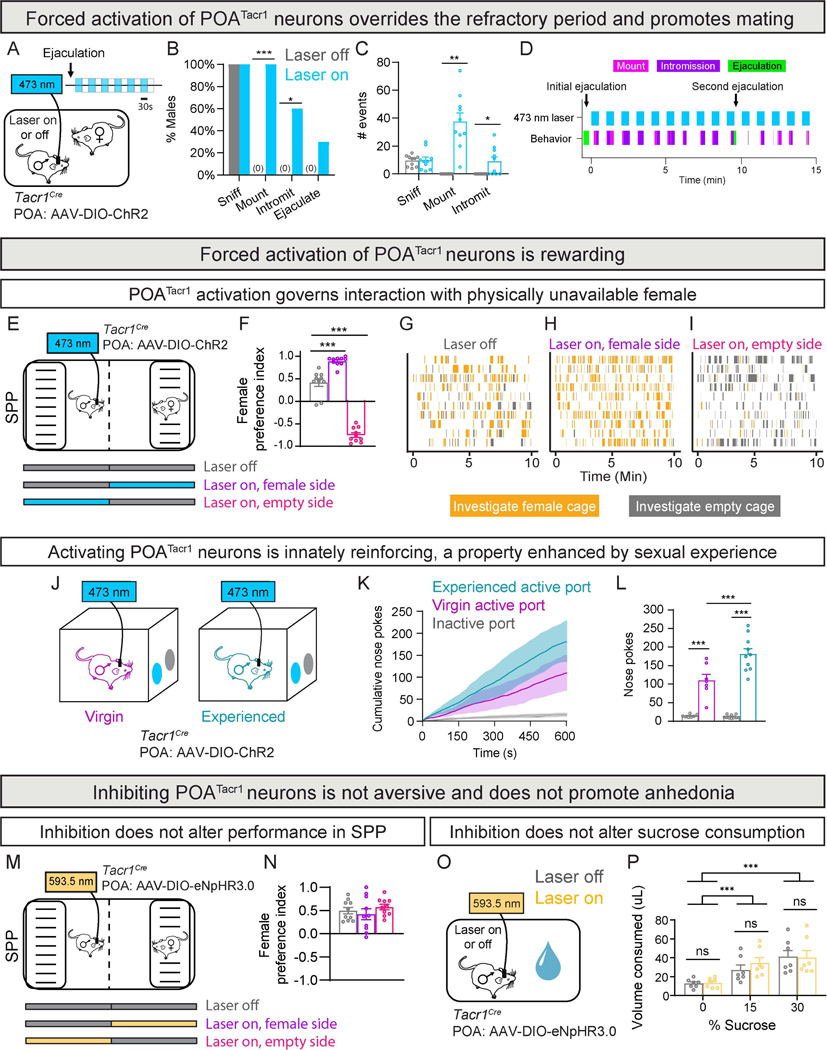
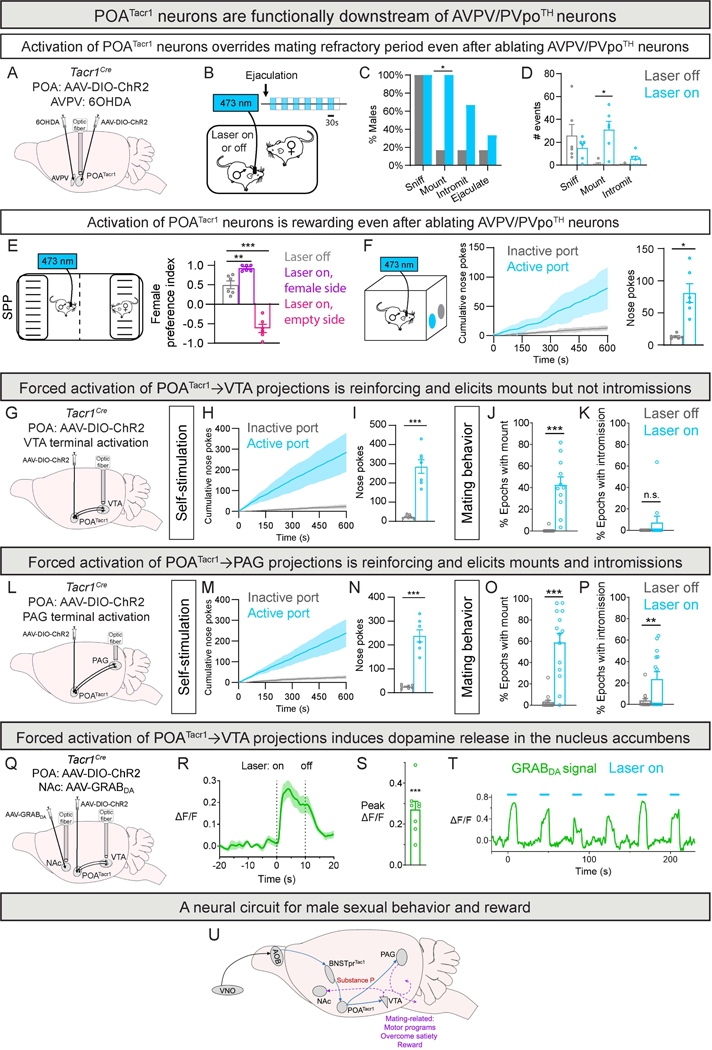
Male sexual behavior is innate and rewarding. Despite its centrality to reproduction, a molecularly specified neural circuit governing innate male sexual behavior and reward remains to be characterized. We have discovered a developmentally wired neural circuit necessary and sufficient for male mating. This circuit connects chemosensory input to BNSTprTac1 neurons, which innervate POATacr1 neurons that project to centers regulating motor output and reward. Epistasis studies demonstrate that BNSTprTac1 neurons are upstream of POATacr1 neurons, and BNSTprTac1-released substance P following mate recognition potentiates activation of POATacr1 neurons through Tacr1 to initiate mating. Experimental activation of POATacr1 neurons triggers mating, even in sexually satiated males, and it is rewarding, eliciting dopamine release and self-stimulation of these cells. Together, we have uncovered a neural circuit that governs the key aspects of innate male sexual behavior: motor displays, drive, and reward.

Keywords: BNST; LTP; POA; Tac1; Tacr1; aggression; bed nucleus of stria terminalis; brain stimulation reward; dopamine; drive; hypothalamic LTP; hypothalamus; libido; male sexual behavior; mating; motivation; preoptic hypothalamus; reinforcement; reward; social behavior network; substance P.


Conflict of interest statement

Declaration of interests L.L. is a member of the advisory board for Cell; D.W.B., C.-h.O.D., J.R.K., and N.M.S. are named inventors on a patent application that has been filed on the subject matter; A.L. is a son of, and N.M.S. is, a co-founder of Yemaya.

Figures

Figure 1:
Figure 1:. Activity of male BNSTprTac1 neurons identifies sex of conspecifics and promotes mating.
A. Schematic of section through the adult mouse brain showing that BNSTprTac1 neurons are a subset of BNSTprAro neurons, which are a subset of BNSTprEsr1 neurons. B-E. Schematic of fiber photometry of BNSTprTac1 neurons in males investigating swabs wetted with female urine, male urine, or saline (B). Peri-event time plot (PETP) of normalized GCaMP6s fluorescence (ΔF/F; dark line, mean, and shaded area, SEM for all Figure panels with fiber photometry; dashed vertical line marks insertion of swab into the cage) (C). BNSTprTac1 neurons are activated by urine (D), with larger response to female than male urine (E). F-J. GRIN lens imaging of BSNTprTac1 GCaMP6s fluorescence with segmented neurons (F). Schematic of miniscope imaging of BNSTprTac1 neurons in males investigating swabs as in panel B (G). Heatmaps of activation of individual neurons during presentation of urine or saline; row numbers correspond to the same neuron across panels, with rows sorted by activation to female urine (H-J). K-N. Traces of GCaMP6s fluorescence (ΔF/F) of individual neurons in response to stimulus presentation (dashed lines) (K). Percent neurons activated by female or male urine or both (L). Percent co-activated neurons with differential response to female or male urine (M). Among co-activated neurons, the response to female urine was greater than that to male urine (N). Neurons were classified as activated if the peak z-score during the 10s period following swab insertion was >2σ of the peak z-score during the 10s period preceding swab insertion. O-R. Schematic of optogenetic activation of BNSTprTac1 neurons of a resident male interacting with an intruder male (O). Activation during the first 90s eliminates attacks and promotes mating (P). Raster plot of a male showing aggression toward the intruder without optogenetic activation (Q). Raster plot of behavior of male showing mating with the intruder following optogenetic activation (R). S-V. Schematic of optogenetic activation of BNSTprTac1 neurons of a resident male interacting with intruder female (S). Optogenetic activation of these cells during the first 90s does not alter the probability (T), number (U), or latency (V) of sniffing or mounting. Mean ± SEM. n = 6 mice (B-E), 105 neurons from 3 mice (F-N), and 5 mice (O-V). * p < 0.05, ** p < 0.01. Scale bar = 100 μm (F). See also Fig. S1; Tables S1-3.
Figure 2:
Figure 2:. Innervation of POATacr1 neurons by BNSTprTac1 neurons is essential for male mating.
A-B. Syp:mRuby expression in BNSTprTac1 neurons (A). Syp:mRuby+ termini of BNSTprTac1 neurons in the POA; inset shows area boxed in gray (B). C-D. mCherry+ BNSTprTac1 neurons (C) and EGFP+ POATacr1 neurons (D) visualized in coronal sections. E-I. TVA (mCherry) and Rabies (EGFP) expression in POATacr1 starter neurons (E). EGFP+ and TVA–BNSTpr neurons innervating POATacr1 neurons (F). Co-labeling for Tac1 mRNA and EGFP in BNSTpr neurons innervating POATacr1 neurons; arrows show Tac1+, EGFP+ cells (G). Most BNSTpr neurons presynaptic to POATacr1 neurons are BNSTprTac1 neurons (H), and nearly half of BNSTprTac1 neurons innervate POATacr1 neurons (I). J-L. Strategy to activate BNSTprTac1→POA projections (J). Schematic of optogenetic activation of BNSTprTac1→POA projections of a resident male interacting with intruder male (K). Activation during the first 90s eliminates attacks and promotes mating (L). M-Q. Strategy to inhibit BNSTprTac1→POA projections (M). Schematic of optogenetic inhibition of BNSTprTac1→POA projections of a resident male interacting with intruder female (N) or male (P). Inhibition suppresses mating with females (O) but does not alter aggression toward males (Q). Mean ± SEM. n = 4 (A-I), 7 (J-L), and 9 (M-Q) mice. * p < 0.05. Scale bars = 1 mm (C,D), 200 μm (A,B,E,F), 20 μm (B inset, G). See also Fig. S2; Tables S1,3.
Figure 3:
Figure 3:. POATacr1 neurons are active during male mating and drive male sexual behavior.
A-C. Fiber photometry of POATacr1 neurons in males interacting with intruder female. PETP of GCaMP6s fluorescence (ΔF/F) during sniffing (A) and mounting (B). BNSTprTac1 neurons are activated during sniffs and mounts (C). D-F. Fiber photometry of POATacr1 neurons in males interacting with intruder male. PETP of GCaMP6s fluorescence (ΔF/F) during sniffing (D) and attacks (E). No discernible activation of BNSTprTac1 neurons during sniffs or attacks (F). G-J. Schematic of optogenetic activation of POATacr1 neurons of males interacting with females (G). Activation (15/45 s on/off) does not alter percent males mounting females (H) but reduces mating latency ~100-fold (I). Raster plot shows male mounting time-locked to light. K-N. Schematic of optogenetic activation of POATacr1 neurons of males interacting with intruder males (K). Activation (15/45 s on/off) abrogates aggression and elicits mating (L). Fight latency is prolonged whereas mating latency is reduced by ≥100-fold (M). Raster plot shows male mounting time-locked to light (N). O-V. Schematic of optogenetic activation (30/30 s on/off; 2 min encounter) of POATacr1 neurons of males interacting with inanimate objects (O). Activation progressively increased investigation of a beaker (P), wood block (Q), and tube (R) and elicited mounting toward the tube outfitted with a toy mouse tail (S), toy mouse (T), male (U), and an unreceptive female (V). Mean (dark trace) ± SEM (lighter shading) of GCaMP6s activity shown in PETPs of all Figures. Mean ± SEM. n = 8 (A-F), 6 (G-N), and 4 (O-V) mice. * p < 0.05, *** p < 0.001. See also Fig. S3; Tables S1,3,4; Movie S1.
Figure 4:
Figure 4:. POATacr1 neurons are functionally downstream of BNSTprEsr1 neurons for male mating.
A-C. Schematic of optogenetic inhibition of POATacr1 neurons in males interacting with intruder females (A). Silencing eliminates mounting without altering sniffing (B,C). D-F. Schematic of closed-loop optogenetic inhibition of POATacr1 neurons during mounting (D). Silencing reduced transitions from mount to intromission (E,F). n = 44 mounts (F, laser off), 29 mounts (F, laser on). G-K. Schematic of optogenetic inhibition of POATacr1 neurons in males interacting with intruder males (G). Silencing did not alter the probability (H), number (I), latency (J), or duration (K) of attacks. L-P. Strategy to activate BNSTprEsr1 neurons while inhibiting POATacr1 neurons (L). Schematic of chemogenetic inhibition of POATacr1 neurons in males (red cross over POATacr1 neurons in circuit models above M-P) interacting with females (M). Inhibition of POATacr1 neurons eliminates mating (N). Schematic of optogenetic activation of BNSTprEsr1 neurons (shaded blue in circuit model above O-P) in males given CNO and interacting with females (O). Inhibition of POATacr1 neurons eliminated mating even when BNSTprEsr1 neurons were activated (P). Q-U. Strategy to activate POATacr1 neurons while inhibiting BNSTprEsr1 neurons (Q). Schematic of chemogenetic inhibition of BNSTprEsr1 neurons (red cross over BNSTpr neurons in circuit models above R-U) in males interacting with females (R). Inhibition of BNSTprEsr1 neurons suppressed mating (S). Schematic of optogenetic activation of POATacr1 neurons (shaded blue in circuit model above TU) in males given CNO and interacting with females (T). Activation of POATacr1 neurons induced mating even when BNSTprEsr1 neurons were inhibited (U). Mean ± SEM. n = 11 (A-C), 3 (D-F), 11 (G-K), 6 (L-P) and 7 (Q-U) mice. * p < 0.05, ** p < 0.01. See also Fig. S3,4; Tables S1,3.
Figure 5:
Figure 5:. Substance P-Tacr1 signaling potentiates activation of POATacr1 neurons and promotes male mating
A-D. Substance P induces LTP in POATacr1 neurons. Strategy to record POATacr1 neurons with local stimulation of glutamatergic inputs in the presence of picrotoxin (100 μM) (A). tdTomato+ POATacr1 neurons (upper) and recording pipette and theta stimulation electrode (lower) (B). Summary plot of normalized EPSP amplitudes (Amp) and input resistance (Rin) before and after 5 min (green line) bath application of Substance P (50nM). Inset: Representative EPSP traces of baseline (1) and the last 5 min (2) (C-D). Substance P induces LTP in POATacr1 neurons (C) and the Tacr1 antagonist L-703,606 (10 μM for slice recordings) blocks it (D). Black line (D) represents average trace with vehicle. E-H. Activation of BNSTpr projections induces LTP onto POATacr1 neurons. Strategy to record POATacr1 neurons while optogenetically activating BNSTpr→POA projections in the presence of picrotoxin (E). Trace of light-evoked firing of BNSTpr neurons (F, upper). Light elicits reliable firing early as well as later (F, lower). Summary plot of normalized EPSP Amp and Rin before and after transient activation (90 s, blue arrow) of BNSTpr→POA projections (G-H). Inset: Representative EPSP traces of baseline (1) and the last 5 min (2) (G-H). Light induces LTP in POATacr1 neurons (G) and L-703,606 blocks it (H). Gray line (H) represents the average trace with vehicle. I-M. Female encounter strengthens excitatory synapses onto POATacr1 neurons in a Substance P-dependent manner. Schematic of assay in which singly-housed males were administered vehicle or L-703,606 (10 mg/kg for in vivo studies) 30 min prior to initiating testing (I-K, upper panels), and strategy to record POATacr1 neurons with local stimulation of glutamatergic inputs in the presence of picrotoxin (L). Darker and lighter traces show example excitatory postsynaptic currents recorded at −70 mV and +40 mV, respectively (I-K, lower panels). MPA/NMDA ratio is increased only in males given vehicle prior to encountering a female (M). N-P. Schematic of paradigm to infuse Substance P into the POA of WT males interacting with females. Substance P (10 ng in 200 nL) or vehicle was infused 15 min prior to female entry. Substance P did not alter probability of (O) but reduced latency to initiate (P) mating. Q-S. Schematic of infusion of L-703,606 (500 pmol in 200 nL) into the POA of WT males interacting with a receptive female (Q). L-703,606 reduced the probability of (R) and increased latency to initiate (S) mating. T-X. Strategy to activate BNSTprTac1→POA projections (T). Schematic of optogenetic activation of BNSTprTac1→POA projections in males given L-703,606 and interacting with females (U). L-703,606 suppresses mating even upon activation of BNSTprTac1→POA projections (V). Schematic of optogenetic activation of BNSTprTac1→POA projections in males given L-703,606 and interacting with males (W). L-703,606 eliminates the male-male mating promoted by activation of BNSTprTac1→POA projections (X). Mean ± SEM. n = 7 neurons from 4 mice (C), 5 neurons from 3 mice (D), 8 neurons from 4 mice (G), 7 neurons from 3 mice (H), 30 neurons from 4 mice (Control), 33 neurons from 5 mice (Encounter + Vehicle), 31 neurons from 4 mice (Encounter + L-703,606) (M), 8 mice (N-S), 7 mice (T-X). * p < 0.05, ** p < 0.01, **** p < 0.0001. See also Fig. S5,6; Tables S1,3.
Figure 6:
Figure 6:. Forced activation of POATacr1 neuron overrides the post-ejaculatory refractory period and is self-reinforcing.
A-D. Schematic of optogenetic activation of POATacr1 neurons in post-ejaculatory males interacting with females (A). Activation (30/30 s on/off) of these cells re-ignites mating drive, increasing the probability (B) and number (C) of mating routines. Raster plot of sexually satiated male subsequent to activating POATacr1 neurons (D). E-I. Schematic of optogenetic activation of POATacr1 neurons in the SPP test (E). Activation governs behavioral preference of males (F). Raster plots (each row is a male) showing that optogenetic activation governs investigation by males (H-I). J-L. Schematic of optogenetic self-stimulation (0.5 s, 40 Hz) of POATacr1 neurons in virgin and sexually experienced males (J). Both virgin and experienced males show more nose pokes to the active port (K,L), with sexual experience increasing self-stimulation (L). M-N. Schematic of optogenetic inhibition of POATacr1 neurons during the SPP test (M). Inhibition does not alter male preference for side containing the female (N). O-P. Schematic of optogenetic inhibition of POATacr1 neurons during sucrose consumption test (O). Inhibition does not alter sucrose consumption (P). Mean ± SEM. n = 10 mice (A-D), n = 10 mice (E-I), n = 7 virgin mice and 10 experienced mice (J-L), n = 10 mice (M-N), n = 6 mice (O-P). * p < 0.05, ** p < 0.01, *** p < 0.001. See also Fig. S7; Tables S1,3; Data S1; Movie S2.
Figure 7:
Figure 7:. The BNSTprTac1→POATacr1 pathway is embedded in a neural circuit linking pheromone sensing to motor output and reward.
A-D. Strategy to activate POATacr1 neurons following bilateral ablation of AVPV/PVpoTH neurons with 6OHDA (10 μg in 1 μL) (A). Schematic of optogenetic activation of POATacr1 neurons in post-ejaculatory males interacting with females (B). Activation (30/30 s on/off) re-ignites mating drive, increasing the probability (C) and number (D) of mating routines. E. Schematic of optogenetic activation of POATacr1 neurons in males lacking AVPV/PVpoTH neurons in the SPP test (left). Activation governs behavioral preference of males (right). F. Schematic of optogenetic self-stimulation (0.5 s, 40 Hz) of POATacr1 neurons in males lacking AVPV/PVpoTH neurons (left). Males show more nose pokes to the active port (right). G-K. Strategy for optogenetic activation of VTA termini of male POATacr1 neurons (G). Males show more nose pokes to the active port (H,I). More mounts (J) but not intromissions (K) in light epochs in encounters with females. L-P. Strategy for ptogenetic activation of PAG termini of POATacr1 neurons (L). Males show more nose pokes to the active port (M,N). More mounts (O) and intromissions (P) in light epochs in encounters with females. Q-T. Optogenetic activation of POATacr1→VTA projections induces DA release in NAc. Strategy for fiber photometry imaging of DA release in NAc during activation (Q). PETP (R) and change in fluorescence (S) of NAc neurons during activation. GRABDA signal trace (T) during light epochs (laser 10 s on, 30 s off) shows time-locked DA release. U. Schematic of the male mating circuit outlined in this study. BNSTprTac1 neurons receive input from the AOB and release Substance P to potentiate activation of POATacr1 neurons. Activation of POATacr1 neurons is necessary and sufficient to elicit mating, and it re-motivates sexually satiated mice to mate and is rewarding. Projections of these cells to the VTA or PAG also drive mating, mating in satiated males, and reinforcement, and activation of VTA projections elicits DA release in NAc. Arrows indicate pathways established by prior work (black) or from our study (blue). Dashed arrows (purple) indicate pathways emanating from VTA and PAG that remain to be identified and connect with centers that drive mating-related motor programs, establish a motivational state for sexual behavior, and make sexual behavior rewarding. Mean ± SEM. n = 6 mice (A-F), n = 7 mice (H-I), n = 11 mice (J-K), n = 7 mice (M-N), n = 14 mice (O-P), n = 8 mice (Q-T). * p < 0.05, ** p < 0.01, *** p < 0.001. See also Fig. S8,9; Tables S1,3; Data S1.

Similar articles

Cited by

References

    1. Triggs GS (1991). The population ecology of house mice (Mus domesticus) on the Isle of May, Scotland. Journal of Zoology 225, 449–468. 10.1111/j.1469-7998.1991.tb03828.x. - DOI
    1. Bronson FH (1979). The reproductive ecology of the house mouse. Q Rev Biol 54, 265–299. - PubMed
    1. King JA (1956). Sexual behavior of C57BL/10 mice and its relation to early social experience. The Journal of Genetic Psychology 88, 223–229. - PubMed
    1. Mandiyan VS, Coats JK, and Shah NM (2005). Deficits in sexual and aggressive behaviors in Cnga2 mutant mice. Nat. Neurosci. 8, 1660–1662. 10.1038/nn1589. - DOI - PubMed
    1. Leypold BG, Yu CR, Leinders-Zufall T, Kim MM, Zufall F, and Axel R. (2002). Altered sexual and social behaviors in trp2 mutant mice. Proc. Natl. Acad. Sci. U.S.A. 99, 6376–6381. 10.1073/pnas.082127599. - DOI - PMC - PubMed

Publication types

LinkOut - more resources