. 2023 Sep 25;33(18):3821-3834.e5.
doi: 10.1016/j.cub.2023.07.040. Epub 2023 Aug 11.

Dopamine signaling from ganglion cells directs layer-specific angiogenesis in the retina

Affiliations

Dopamine signaling from ganglion cells directs layer-specific angiogenesis in the retina

Justine H Liang et al. Curr Biol. .

Abstract

During central nervous system (CNS) development, a precisely patterned vasculature emerges to support CNS function. How neurons control angiogenesis is not well understood. Here, we show that the neuromodulator dopamine restricts vascular development in the retina via temporally limited production by an unexpected neuron subset. Our genetic and pharmacological experiments demonstrate that elevating dopamine levels inhibits tip-cell sprouting and vessel growth, whereas reducing dopamine production by all retina neurons increases growth. Dopamine production by canonical dopaminergic amacrine interneurons is dispensable for these events. Instead, we found that temporally restricted dopamine production by retinal ganglion cells (RGCs) modulates vascular development. RGCs produce dopamine precisely during angiogenic periods. Genetically limiting dopamine production by ganglion cells, but not amacrines, decreases angiogenesis. Conversely, elevating ganglion-cell-derived dopamine production inhibits early vessel growth. These vasculature outcomes occur downstream of vascular endothelial growth factor receptor (VEGFR) activation and Notch-Jagged1 signaling. Jagged1 is increased and subsequently inhibits Notch signaling when ganglion cell dopamine production is reduced. Our findings demonstrate that dopaminergic neural activity from a small neuron subset functions upstream of VEGFR to serve as developmental timing cue that regulates vessel growth.

Keywords: Notch; VEGF; dopamine; dopaminergic amacrine cells; retina; retinal ganglion cells; tyrosine hydroxylase; vasculature.


Conflict of interest statement

Declaration of interests The authors declare no competing interests.

Figures

Figure 1.
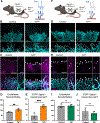
Figure 1.. Elevated dopamine impairs angiogenic sprouting and vasculature growth.
(A) Schematic of vasculature development from P3 to P15. The primary superficial plexus begins to emerge at P0, grows laterally to the periphery, and reaches its full radial growth by P8. From day 7, capillaries ascend into the OPL to form the deep plexus, which then interdigitates this layer and is completed by P12. The vasculature growth period is accompanied by spontaneous retinal activity in the form of cholinergic and dopaminergic waves. (B) Schematic of L-DOPA-ME administration. L-DOPA-ME or vehicle control were administered daily via intraperitoneal injection starting at P0, once a day, in the morning, at a dose of 100 mg drug per kilogram weight of animal. Eyes were harvested at P3 and P9 for analysis on vascular maturation. (C, E) The number of superficial endothelial sprouts was visualized (C) and quantified (E) using an antibodies to CD31 (C, E, cyan) at P3. L-DOPA-ME reduced sprout number as indicated by filled dots in the control and unfilled dots in the mutants, each of which marks individual sprouts. n =4 controls and 4 L-DOPA-ME treated mice. Scale bars, 200 μm (D, F) ESM1 area coverage was visualized (D) and quantified (F) using an antibody to ESM1 (top) and costained with vascular marker CD31 (bottom). Filled and empty arrowheads indicate the location of increased and decreased ESM1 signal, respectively. The ESM1 signal (ESM1+ area percentage) was normalized using the total vessel coverage area. L-DOPA-ME reduced the level of ESM1 at P3. n =4 controls and 5 L-DOPA-ME treated mice. Scale bars, 50 μm. (G-I) The vessel coverage of the deep vascular layer was visualized (G) and quantified (H) using an antibodies to CD31 (G, green) at P9. L-DOPA-ME reduced total vessel area coverage (H) but did not significantly impact vessel density (I). n =3 controls and 4 L-DOPA-ME treated mice. Scale bars, 300 μm. *p<0.05, **p<0.005, ****p<0.0005. All data are presented as the mean ± SEM. See also Figure S1.
Figure 2.
Figure 2.. Loss of TH from all retinal neurons but not canonical dopaminergic neurons enhances endothelial cell sprouting.
(A) Schematic of mouse model in which tyrosine hydroxylase (Th) was removed from all retinal neurons (THRET). Cre targeted neurons are delineated in blue. (B, D) Representative vascular images (B) of control and THRET as visualized by antibody staining for CD31 in the superficial vascular at P3. Scale bars, 200 μm. The number of endothelial cell sprouts was quantified (D). Filled and empty dots indicate the location of increased and decreased endothelial cell sprouts, respectively. n= 4 control and THRET mice. (C, E) Representative images (C) and quantification (E) of ESM1 in control and THRET mice as visualized by antibody staining for ESM1 in the superficial vascular layer at P3 (top) and costained with vascular marker CD31 (bottom). Filled and empty arrowheads indicate the location of increased and decreased ESM1 signal, respectively. Scale bars, 200 μm (top) and 50 μm (right, magnified images). ESM1 signal is increased in THRET mutants. n= 4 control and THRET mice. (F) Schematic of mouse model in which tyrosine hydroxylase (Th) was removed from ll specifically from amacrine interneurons (THAC). Cre targeted neurons are delineated in blue. (G, I) Representative vascular images (G) of control and THAC as visualized by antibody staining for CD31 in the superficial vascular at P3. Scale bars, 200 μm. The number of endothelial cell sprouts was quantified (I). Filled dots indicate the location of the similar number of endothelial cell sprouts from control and mutants, respectively. n= 4 control and THAC mice. (H, J) Representative images (H) and quantification (J) of ESM1 in control and THRET mice as visualized by antibody staining for ESM1 in the superficial vascular at P3 (top) and costained with vascular marker CD31 (bottom). Filled arrowheads indicate the location of similar ESM1 signal from controls and mutants, respectively. Scale bars, 200 μm (top) and 50 μm (right, magnified images). ESM1 signal was not changed in THAC mutants. n= 4 control and THAC mice. ns, not significant. *p<0.05, **p<0.005. All data are presented as the mean ± SEM. See also Figure S1., Figure S2
Figure 3.
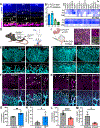
Figure 3.. Retinal ganglion cell TH is necessary and sufficient to modulate endothelial cell sprouting.
(A) Representative images of smFISH for TH mRNA (white) combined with IHC for the retinal ganglion cell marker RBPMS (magenta) in wildtype animals at P3, P5, and P9. Scale bars, 50 μm. (B) Quantification of the number RGCs that are positive for Th mRNA at P3, P5, P9, and P15 (representative images of for P15 timepoint in Figure S3). (C) Expression of dopamine biosynthesis pathway genes in RGC subtypes derived from a wildtype RGC atlas at P0, P5, and P56. Color depth of heat maps represents the average expression of the gene marker combination in ~20 discrete RGC types. A large number of RGG subsets have high expression of dopamine biosynthesis (Th) and transporter (Slc18a2) genes during superficial and deep vascular emergence (P0, P5), whereas expression of these genes decreases in adulthood (P56). (D) Schematic of mouse model in which tyrosine hydroxylase (Th) was removed specifically from retinal ganglion cells (THRGC). Cre targeted neurons are delineated in blue. (E, G) Representative vascular images (E) of control and THRGC as visualized by antibody staining for CD31 in the superficial vascular at P3. Scale bars, 200 μm. The number of endothelial cell sprouts and branching was quantified (G). Filled and empty dots indicate the location of increased and decreased endothelial cell sprouts, respectively. n= 5 control and 4 THRGC mice. (F, H) Representative images (F) and quantification (H) of ESM1 in control and THRGC mice as visualized by antibody staining for ESM1 in the superficial vascular at P3 (top) and costained with vascular marker CD31 (bottom). Filled and empty arrowheads indicate the location of increased and decreased ESM1 signal, respectively. Scale bars, 200 μm (top) and 50 μm (right, magnified image). ESM1 signal was significantly increased in THRGC mutants. n= 4 control and 5 THRGC mice. * (I) Schematic illustration of intravitreal viral infection with AAV-DIO-TH-Myc, an AAV of the DJ serotype that overexpresses Myc-tagged TH specifically in Cre-expressing cells. Eyes of control and Chrnb3cre mice were transduced at P0 and harvested at P3 to analyze superficial vasculature development. Staining for antibodies to Myc (white) and TH (magenta) confirmed increased expression in transduced regions of Chrnb3cre animals (arrowheads). (J, L) Representative vascular images (J) of AAV-THOE transduced regions in Chrnb3cre mice and Cre negative littermate controls as visualized by antibody staining for CD31 in the superficial vascular at P3. Scale bars, 200 μm. Filled and empty dots indicate the location of increased and decreased endothelial cell sprouts, respectively. The number of endothelial cell sprouts was quantified (L). n= 6 control and 5 Chrnb3cre mice. (K, M) Representative images (K) and quantification (M) of ESM1 in AV-THOE transduced regions in Chrnb3cre mice and Cre negative littermate controls as visualized by antibody staining for ESM1 in the superficial vascular at P3 (top) and costained with vascular marker CD31 (bottom). Filled and empty arrowheads indicate the location of increased and decreased ESM1 signal, respectively. Scale bars, 200 μm (top) and 50 μm (right, magnified image). ESM1 signal was significantly reduced in Chrnb3cre mice. n= 4 wildtype and 4 Chrnb3cre mice. *p<0.05, **p<0.005, ***p<0.0005, ****p<0.0001. All data are presented as the mean ± SEM. See also Figure S1, Figure S2, Figure S3, and Figure S4.
Figure 4.
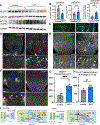
Figure 4.. Dopamine inhibits endothelial sprouting by inducing the Jagged-DLL4 -Notch signaling pathway.
(A-B) Immunoblot (A) and quantification (B) for total VEGFR2 and phosphorylated VEGFR2 (P-VEGFR2) in the retina of control and THRGC mice at P3 shows that activated VEGF2R levels are significantly increased in THRGC mice when P-VEGFR2 levels are normalized to total VEGFR2. n=5 control and 6 THRGC mice. (C) DRD2 expression was assayed using DRD2-GFP reporter mice in the retina superficial plexus at P8 confirm following staining with anti-GFP antibody. DRD2 appears to be enriched in developing vessels as indicated by co-labeling for CD31. Scale bar, 100 μm. (D, G) Representative images (D) and quantification (G) of Jagged1 in control and THRGC mice as visualized by antibody staining for Jagged in the superficial vascular plexus at P3. Scale bars, 200 μm. Jagged1 fluorescence signal was significantly increased in THRGC mutants. n= 7 control and 5 THRGC mice. *p<0.05, **p<0.005. All data are presented as the mean ± SEM. (E, H) Representative images (E) and quantification (H) of DIl4 in control and THRGC mice as visualized by antibody staining for Dll4 in the superficial vascular at P3. Scale bars, 200 μm. Dll4 fluorescent signal was significantly increased in tip cells of THRGC mutants compared to littermate controls. n= 4 control and 3 THRGC mice. (F) Representative images of Hey1 in control and THRGC mice as visualized by antibody staining for Hey in the superficial vascular plexus at P3. Scale bar, 200 μm. (I) Schematic of dopamine-mediated alterations to tip and stalk cell growth via the Jagged-DLL4-Notch pathway. Normal dopamine levels are associated with reduced VEGF2R activation and normal levels of tip cell-specific Dll4. This would reduce Jagged1-mediated Notch activation and promote tip to stalk cell maturation. In contrast, reduced dopamine levels would enhance VEGF2R activity and increase Jagged 1 signaling to promote the expression of genes that drive tip cell function. This may be associated with a compensatory increase in DLL4. Pathway schematic created with BioRender.

References

    1. Paredes I, Himmels P, and Ruiz de Almodovar C (2018). Neurovascular Communication during CNS Development. Dev Cell 45, 10–32. 10.1016/j.devcel.2018.01.023. - DOI - PubMed
    1. Lee HS, Han J, Bai HJ, and Kim KW (2009). Brain angiogenesis in developmental and pathological processes: regulation, molecular and cellular communication at the neurovascular interface. FEBS J 276, 4622–4635. 10.1111/j.1742-4658.2009.07174.x. - DOI - PubMed
    1. Biswas S, Cottarelli A, and Agalliu D (2020). Neuronal and glial regulation of CNS angiogenesis and barriergenesis. Development 147. 10.1242/dev.182279. - DOI - PMC - PubMed
    1. Daneman R, and Prat A (2015). The blood-brain barrier. Cold Spring Harb Perspect Biol 7, a020412. 10.1101/cshperspect.a020412. - DOI - PMC - PubMed
    1. Arnold T, and Betsholtz C (2013). Correction: The importance of microglia in the development of the vasculature in the central nervous system. Vasc Cell 5, 12. 10.1186/2045-824X-5-12. - DOI - PMC - PubMed

Publication types

MeSH terms

Substances

LinkOut - more resources