

Obesity-associated microglial inflammatory activation paradoxically improves glucose tolerance
- PMID: 37572666
- PMCID: PMC10528677
- DOI: 10.1016/j.cmet.2023.07.008
Obesity-associated microglial inflammatory activation paradoxically improves glucose tolerance
Abstract
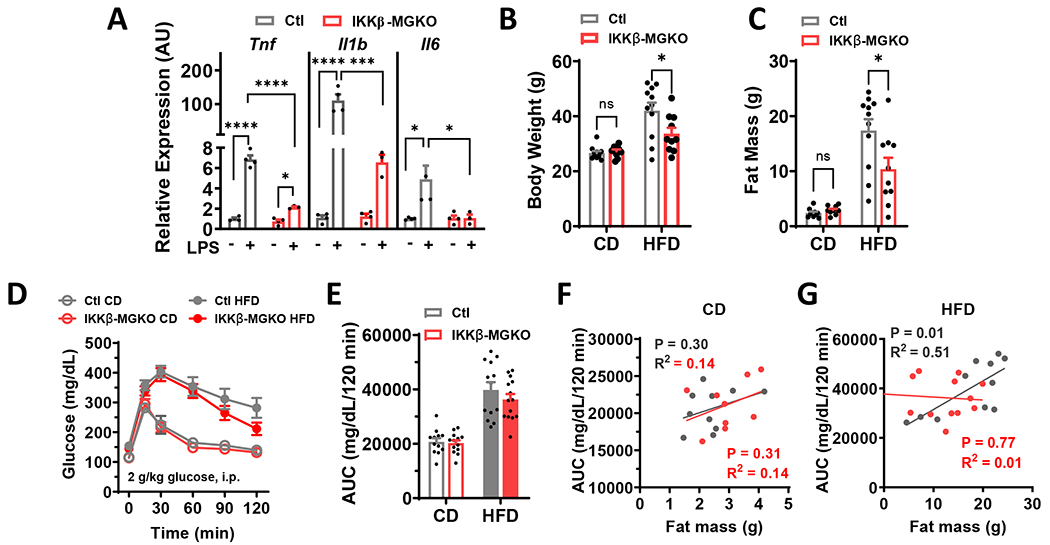
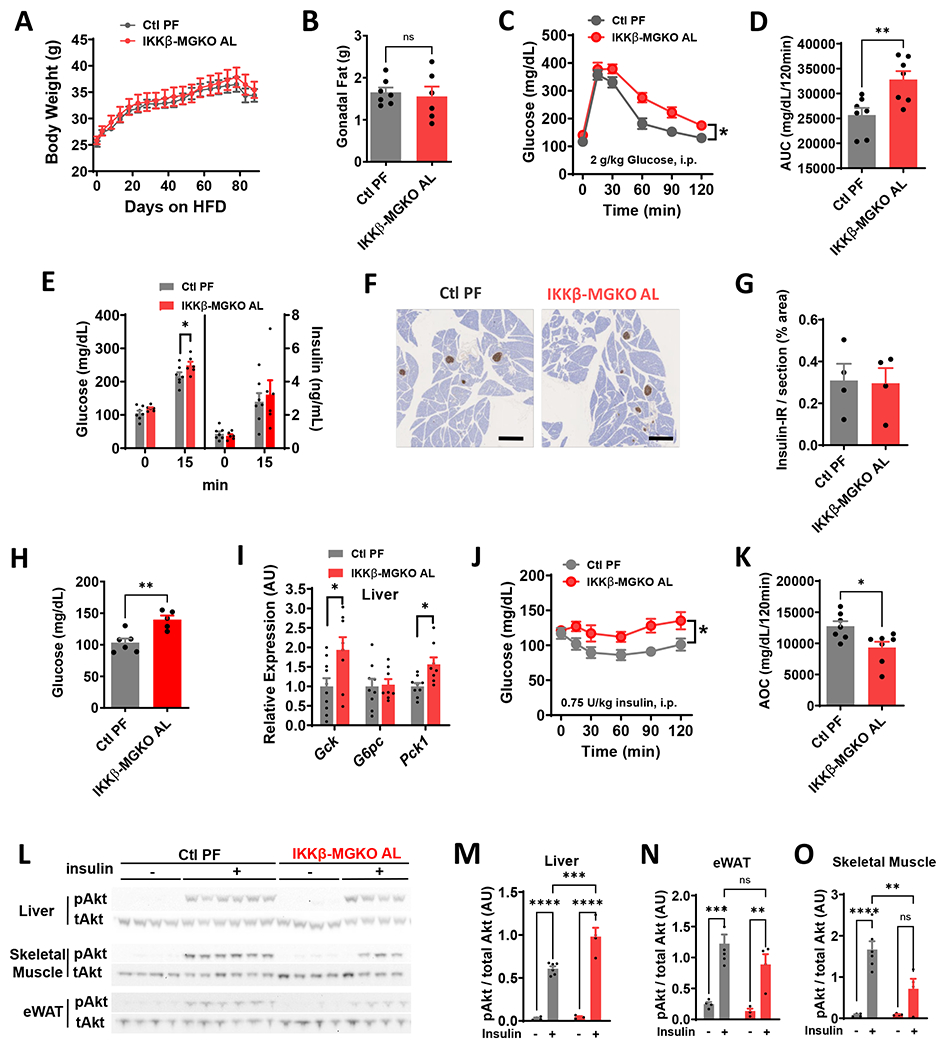
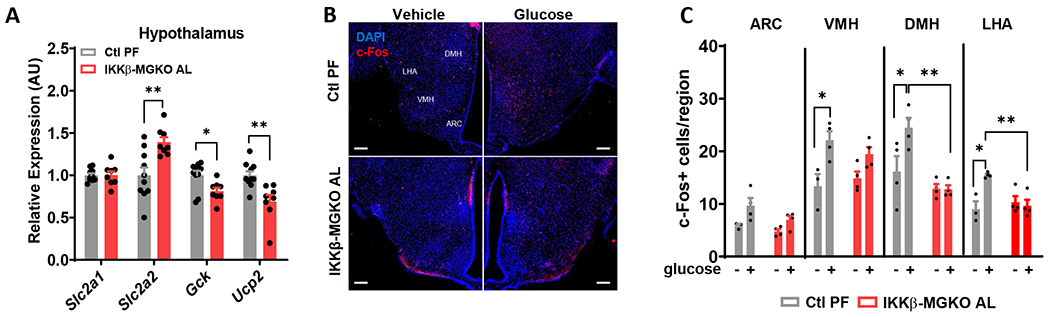
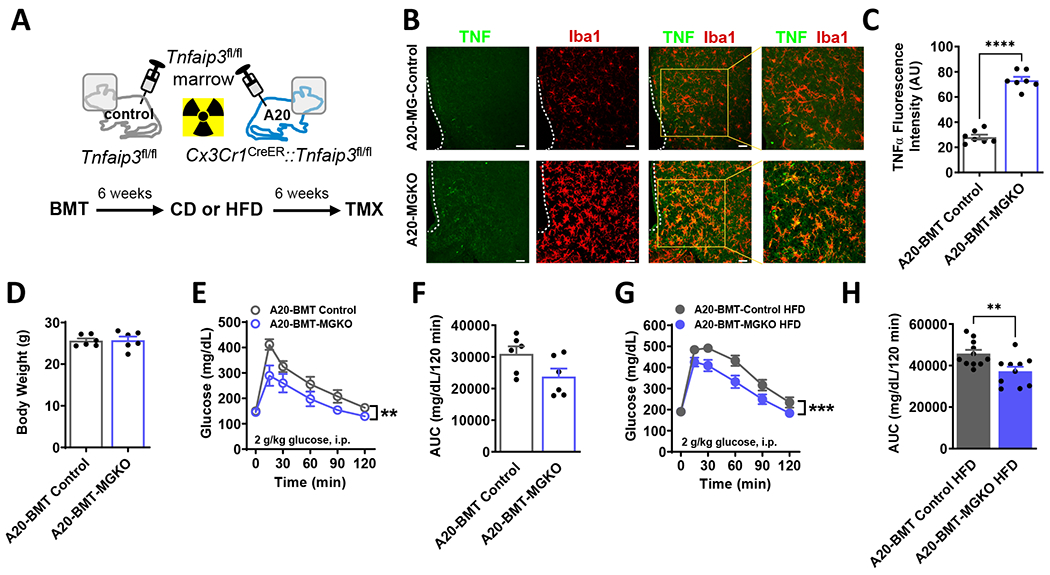
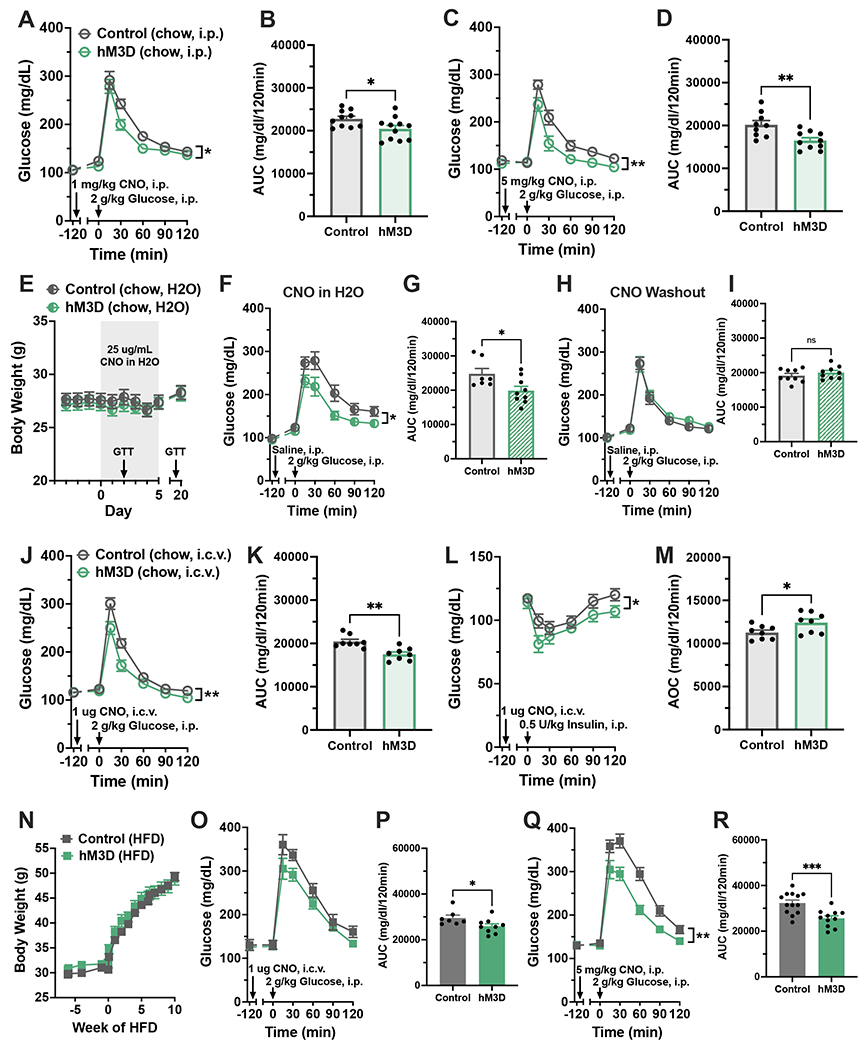
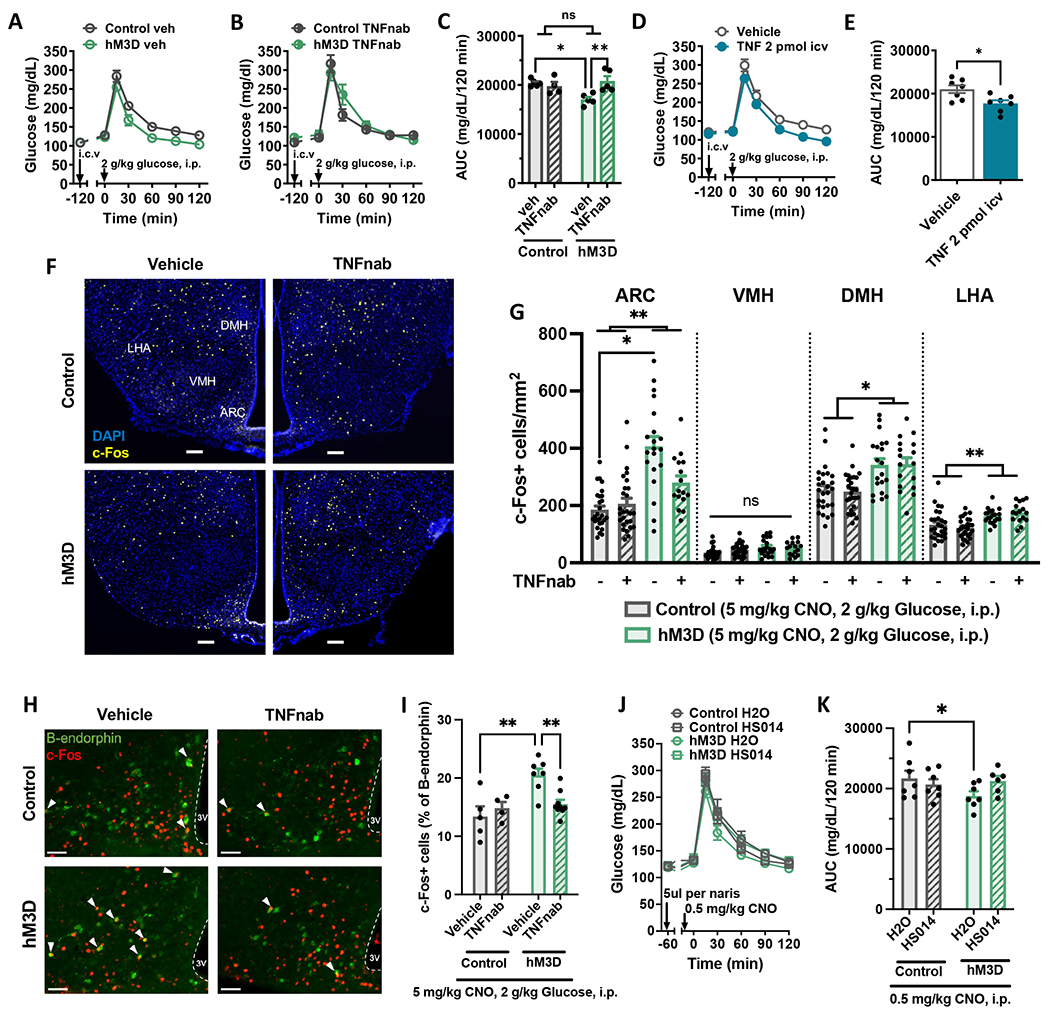
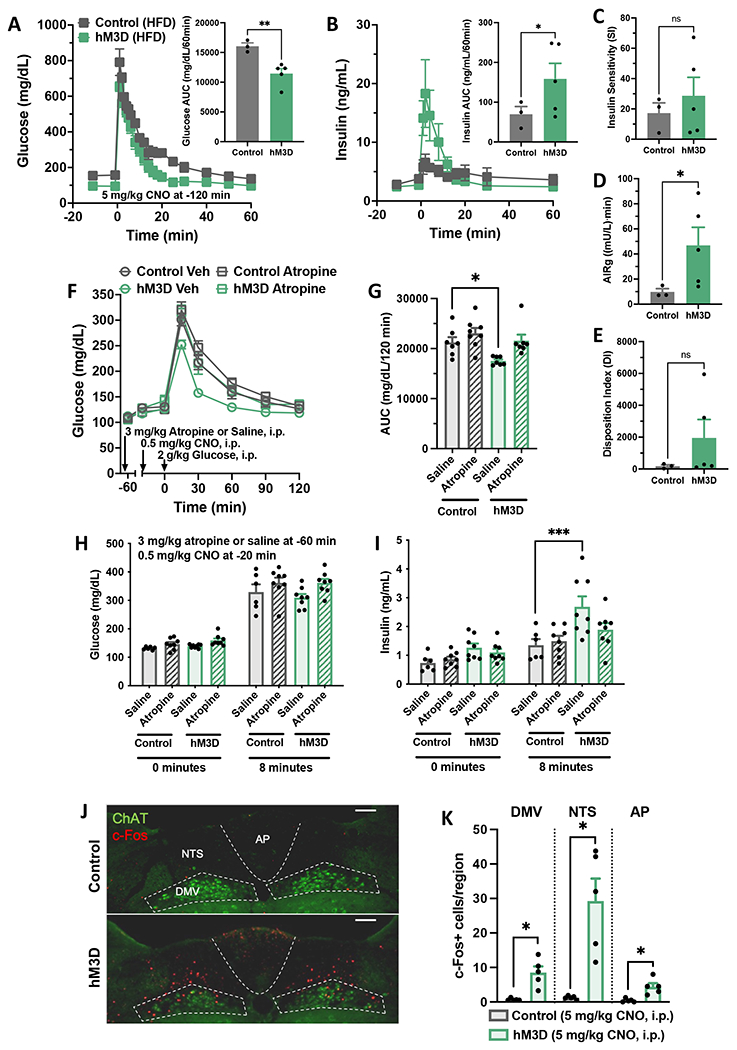
Hypothalamic gliosis associated with high-fat diet (HFD) feeding increases susceptibility to hyperphagia and weight gain. However, the body-weight-independent contribution of microglia to glucose regulation has not been determined. Here, we show that reducing microglial nuclear factor κB (NF-κB) signaling via cell-specific IKKβ deletion exacerbates HFD-induced glucose intolerance despite reducing body weight and adiposity. Conversely, two genetic approaches to increase microglial pro-inflammatory signaling (deletion of an NF-κB pathway inhibitor and chemogenetic activation through a modified Gq-coupled muscarinic receptor) improved glucose tolerance independently of diet in both lean and obese rodents. Microglial regulation of glucose homeostasis involves a tumor necrosis factor alpha (TNF-α)-dependent mechanism that increases activation of pro-opiomelanocortin (POMC) and other hypothalamic glucose-sensing neurons, ultimately leading to a marked amplification of first-phase insulin secretion via a parasympathetic pathway. Overall, these data indicate that microglia regulate glucose homeostasis in a body-weight-independent manner, an unexpected mechanism that limits the deterioration of glucose tolerance associated with obesity.
Keywords: POMC; TNF; chemogenetic; glucose sensing; glucose tolerance; hypothalamus; insulin; microglia; obesity; parasympathetic.
Copyright © 2023 Elsevier Inc. All rights reserved.
Conflict of interest statement
Declaration of interests The authors declare no competing interests.
Figures
Comment in
-
Microglial inflammatory signalling improves glucose tolerance.Nat Rev Endocrinol. 2023 Oct;19(10):555. doi: 10.1038/s41574-023-00892-7. Nat Rev Endocrinol. 2023. PMID: 37605048 No abstract available.
Similar articles
-
Astrocyte IKKβ/NF-κB signaling is required for diet-induced obesity and hypothalamic inflammation.Mol Metab. 2017 Jan 28;6(4):366-373. doi: 10.1016/j.molmet.2017.01.010. eCollection 2017 Apr. Mol Metab. 2017. PMID: 28377875 Free PMC article.
-
High-intensity interval training improves hypothalamic inflammation by suppressing HIF-1α signaling in microglia of male C57BL/6J mice.FASEB J. 2024 Jul 31;38(14):e23770. doi: 10.1096/fj.202400289R. FASEB J. 2024. PMID: 38995817
-
CX3CL1 Action on Microglia Protects from Diet-Induced Obesity by Restoring POMC Neuronal Excitability and Melanocortin System Activity Impaired by High-Fat Diet Feeding.Int J Mol Sci. 2022 Jun 7;23(12):6380. doi: 10.3390/ijms23126380. Int J Mol Sci. 2022. PMID: 35742824 Free PMC article.
-
Hypothalamic Microglial Heterogeneity and Signature under High Fat Diet-Induced Inflammation.Int J Mol Sci. 2021 Feb 24;22(5):2256. doi: 10.3390/ijms22052256. Int J Mol Sci. 2021. PMID: 33668314 Free PMC article. Review.
-
Is human obesity an inflammatory disease of the hypothalamus?Eur J Endocrinol. 2023 Mar 2;188(3):R37-R45. doi: 10.1093/ejendo/lvad030. Eur J Endocrinol. 2023. PMID: 36883605 Review.
Cited by
-
Interleukin-2 improves insulin sensitivity through hypothalamic sympathetic activation in obese mice.J Neuroinflammation. 2024 Oct 4;21(1):250. doi: 10.1186/s12974-024-03244-y. J Neuroinflammation. 2024. PMID: 39367382 Free PMC article.
-
The protective role of kakkalide in sepsis-induced intestinal barrier dysfunction via inhibition of NF-κB pathway activation.J Clin Biochem Nutr. 2025 Mar;76(2):139-147. doi: 10.3164/jcbn.24-182. Epub 2024 Dec 5. J Clin Biochem Nutr. 2025. PMID: 40151402 Free PMC article.
-
Internal-External Homologous Drug-Loaded Exosome-Like Nanovesicles Released from Semi-IPN Hydrogel Enhancing Wound Healing of Chemoradiotherapy-Induced Oral Mucositis.Int J Nanomedicine. 2025 Apr 4;20:4105-4121. doi: 10.2147/IJN.S508530. eCollection 2025. Int J Nanomedicine. 2025. PMID: 40201151 Free PMC article.
-
Microglia Mediate Metabolic Dysfunction From Common Air Pollutants Through NF-κB Signaling.Diabetes. 2024 Dec 1;73(12):2065-2077. doi: 10.2337/db24-0110. Diabetes. 2024. PMID: 39320947 Free PMC article.
-
Role of hypothalamus function in metabolic diseases and its potential mechanisms.PeerJ. 2025 May 29;13:e19532. doi: 10.7717/peerj.19532. eCollection 2025. PeerJ. 2025. PMID: 40452923 Free PMC article. Review.
References
-
- Berkseth KE, Guyenet SJ, Melhorn SJ, Lee D, Thaler JP, Schur EA, and Schwartz MW (2014). Hypothalamic gliosis associated with high-fat diet feeding is reversible in mice: a combined immunohistochemical and magnetic resonance imaging study. Endocrinology 155, 2858–2867. 10.1210/en.2014-1121. - DOI - PMC - PubMed
Publication types
MeSH terms
Substances
Grants and funding
- T32 DK007247/DK/NIDDK NIH HHS/United States
- R01 DK119754/DK/NIDDK NIH HHS/United States
- R03 DK125627/DK/NIDDK NIH HHS/United States
- R01 DK134782/DK/NIDDK NIH HHS/United States
- R21 DK127296/DK/NIDDK NIH HHS/United States
- P30 DK035816/DK/NIDDK NIH HHS/United States
- P30 DK017047/DK/NIDDK NIH HHS/United States
- K01 DK113064/DK/NIDDK NIH HHS/United States
- K08 DK088872/DK/NIDDK NIH HHS/United States
- R01 DK103175/DK/NIDDK NIH HHS/United States
- K01 HL153205/HL/NHLBI NIH HHS/United States
- F32 DK108473/DK/NIDDK NIH HHS/United States
- P30 DK098722/DK/NIDDK NIH HHS/United States
LinkOut - more resources
Full Text Sources
Other Literature Sources
Molecular Biology Databases
Miscellaneous
