. 2024 Jul:61:133-149.
doi: 10.1016/j.jare.2023.08.007. Epub 2023 Aug 11.

Lipidomic analysis identifies long-chain acylcarnitine as a target for ischemic stroke

Affiliations

Lipidomic analysis identifies long-chain acylcarnitine as a target for ischemic stroke

Xin-Xin Huang et al. J Adv Res. 2024 Jul.

Abstract

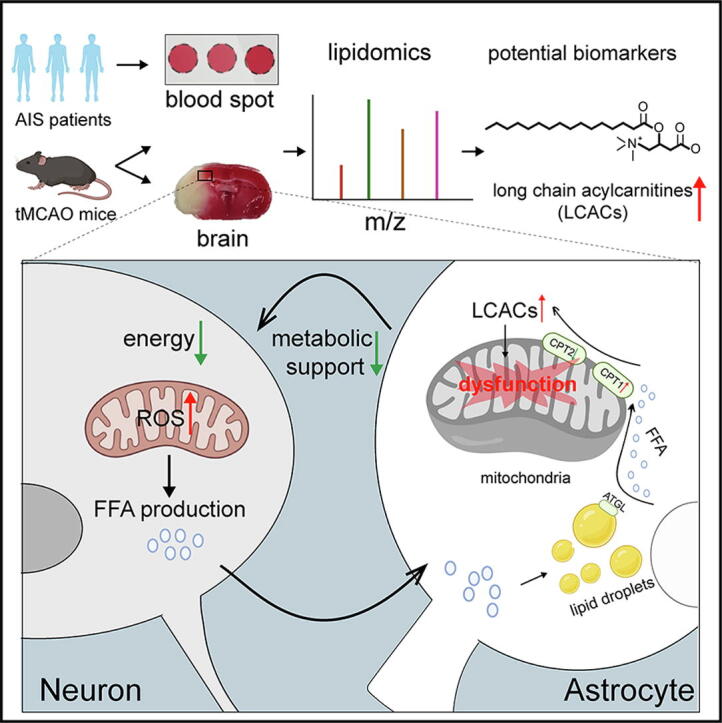
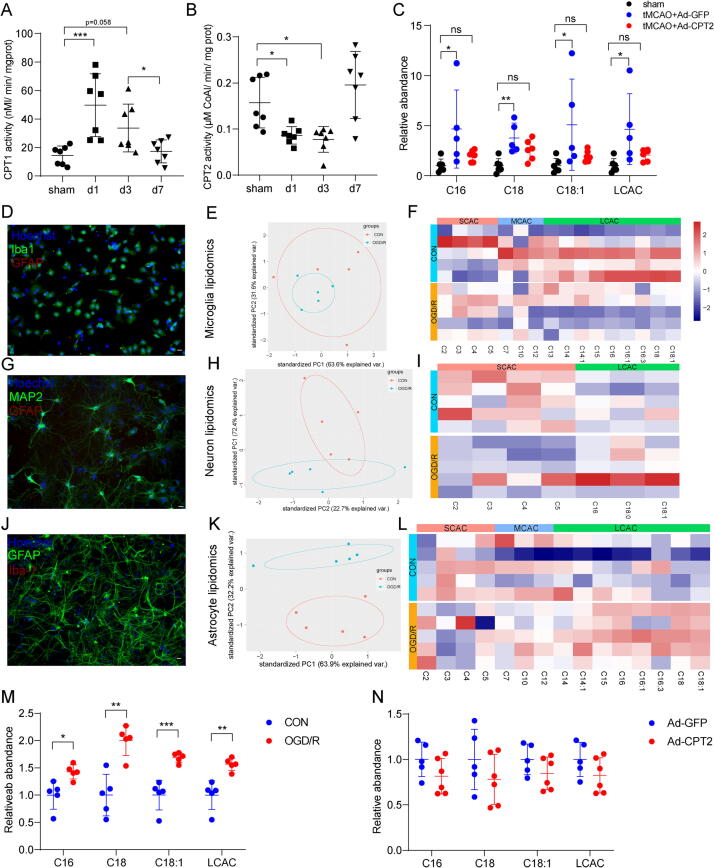
Introduction: Lipid metabolism dysfunction is widely involved in the pathological process of acute ischemic stroke (AIS). The coordination of lipid metabolism between neurons and astrocytes is of great significance. However, the full scope of lipid dynamic changes and the function of key lipids during AIS remain unknown. Hence, identifying lipid alterations and characterizing their key roles in AIS is of great importance.

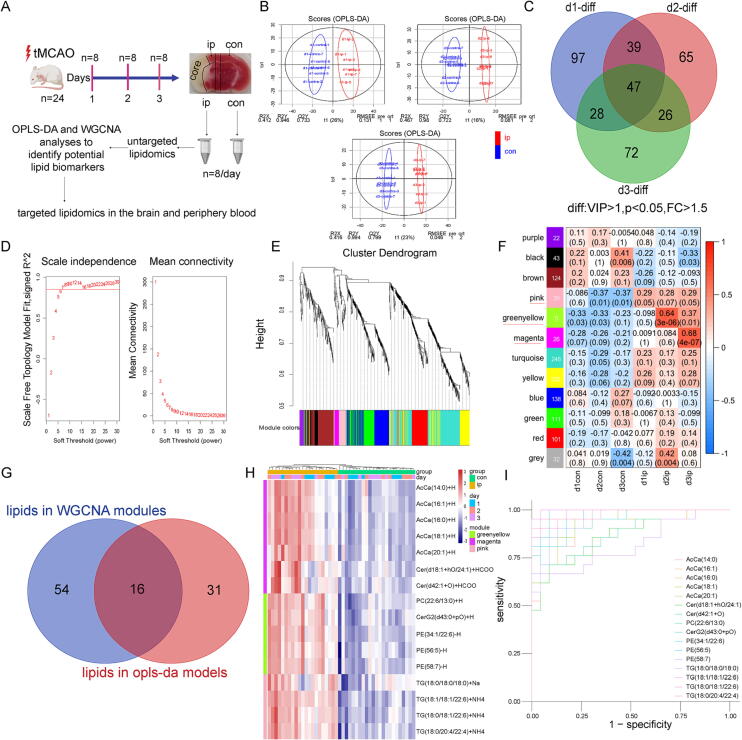
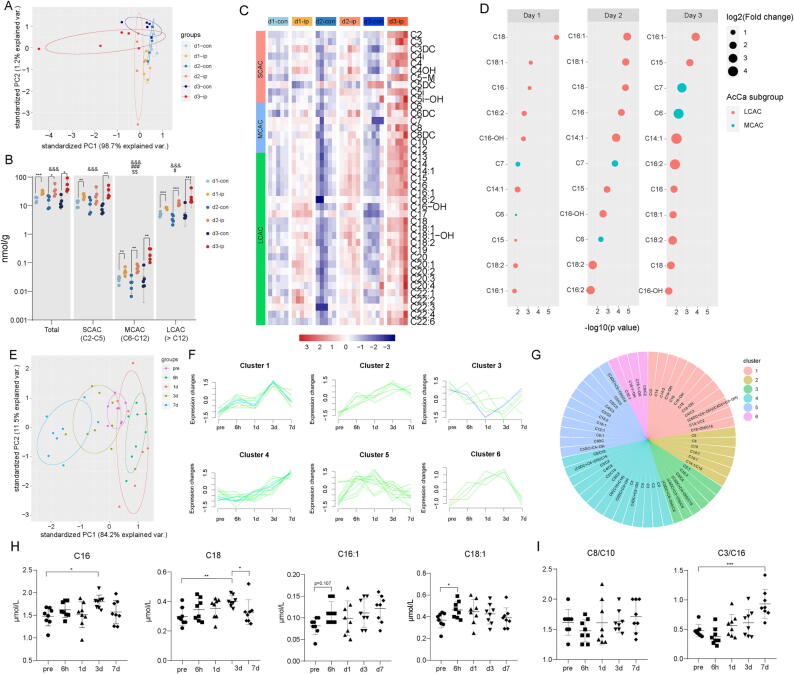
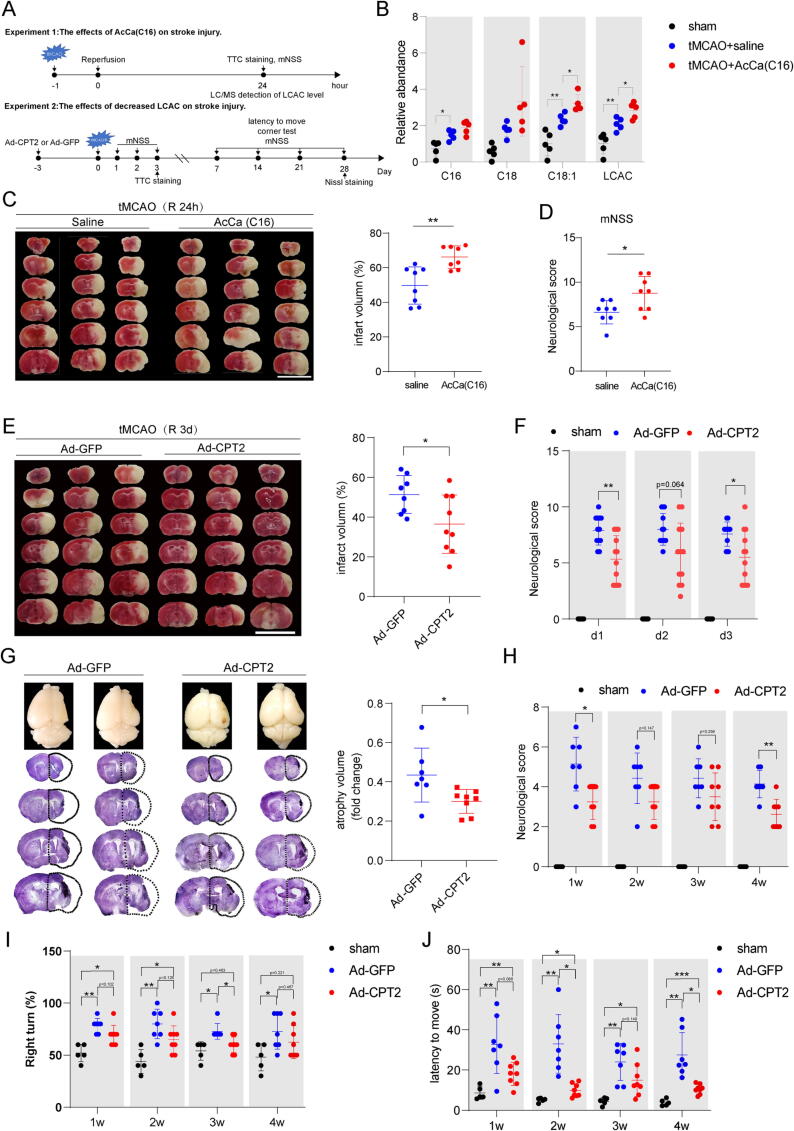
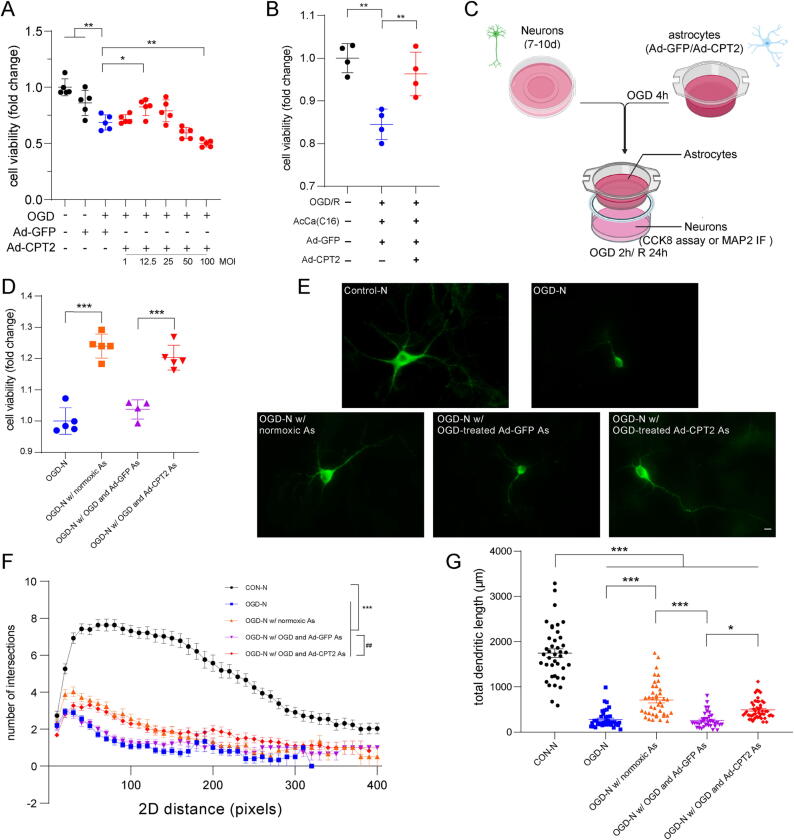
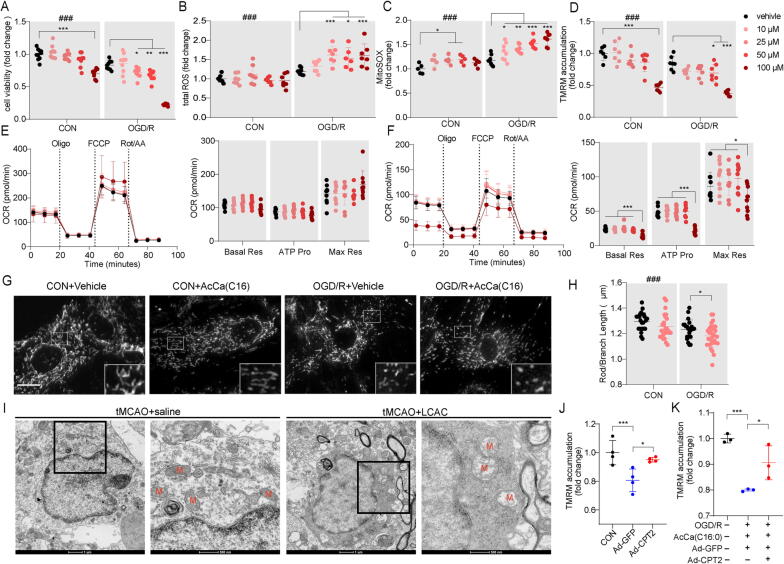
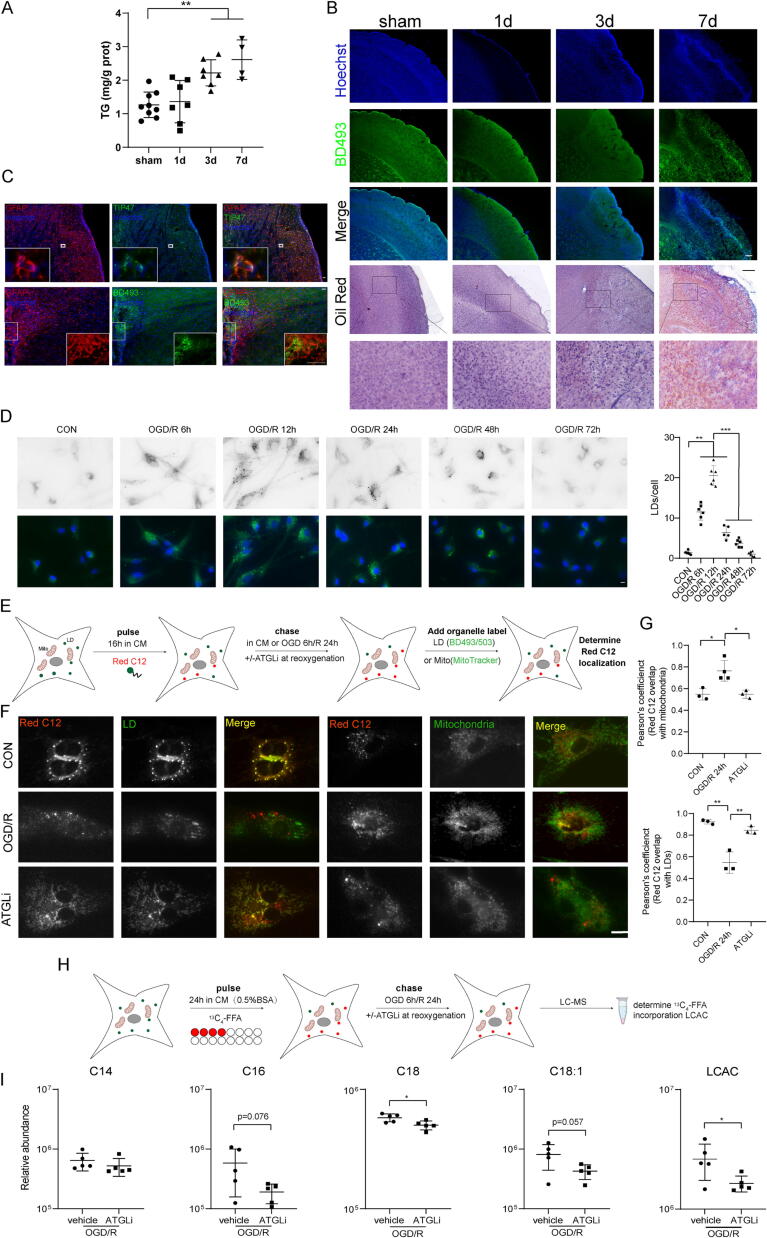
Methods: Untargeted and targeted lipidomic analyses were applied to profile lipid changes in the ischemic penumbra and peripheral blood of transient middle cerebral artery occlusion (tMCAO) mice as well as the peripheral blood of AIS patients. Infarct volume and neurological deficits were assessed after tMCAO. The cell viability and dendritic complexity of primary neurons were evaluated by CCK8 assay and Sholl analysis. Seahorse, MitoTracker Green, tetramethyl rhodamine methyl ester (TMRM), 2',7'-dichlorodihydrofluorescein diacetate (DCFH-DA) and MitoSOX were used as markers of mitochondrial health. Fluorescent and isotopic free fatty acid (FFA) pulse-chase assays were used to track FFA flux in astrocytes.

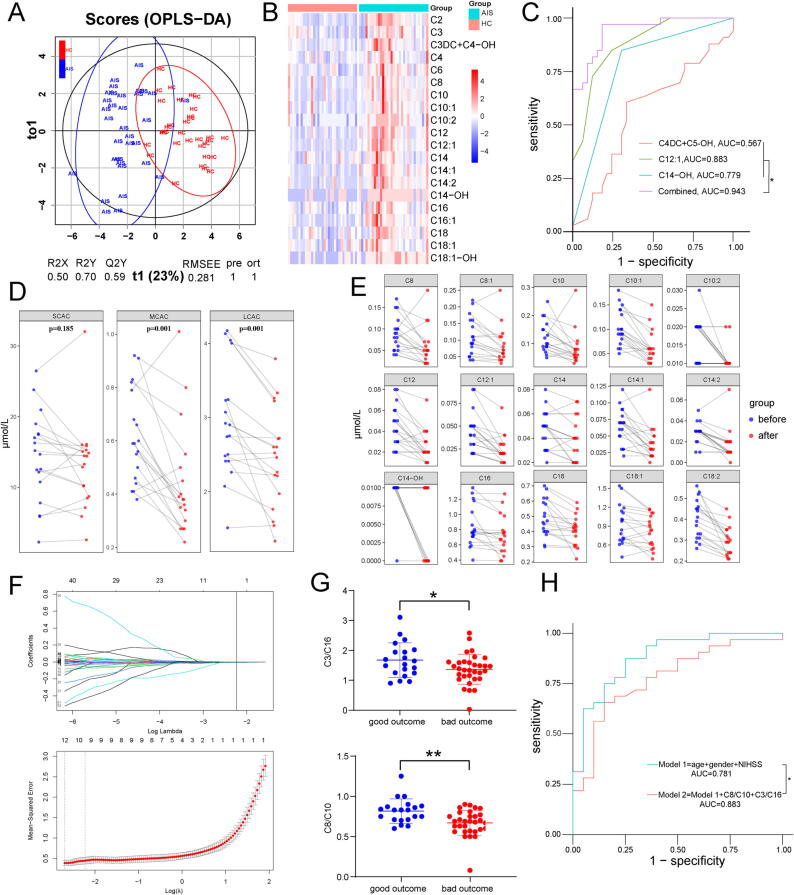
Results: Long-chain acylcarnitines (LCACs) were the lipids with the most dramatic changes in the ischemic penumbra and peripheral blood of tMCAO mice. LCACs were significantly elevated on admission in AIS patients and associated with poor outcomes in AIS patients. Increasing LCACs through a bolus administration of palmitoylcarnitine amplified stroke injury, while decreasing LCACs by overexpressing carnitine palmitoyltransferase 2 (CPT2) ameliorated stroke injury. Palmitoylcarnitine aggravated astrocytic mitochondrial damage after OGD/R, while CPT2 overexpression in astrocytes ameliorated cocultured neuron viability. Further study revealed that astrocytes stimulated by OGD/R liberated FFAs from lipid droplets into mitochondria to form LCACs, resulting in mitochondrial damage and lowered astrocytic metabolic support and thereby aggravated neuronal damage.

Conclusion: LCACs could accumulate and damage neurons by inducing astrocytic mitochondrial dysfunction in AIS. LCACs play a crucial role in the pathology of AIS and are novel promising diagnostic and prognostic biomarkers for AIS.

Keywords: Astrocytic mitochondrial; Biomarker; Ischemic stroke; Lipid droplet; Long-chain acylcarnitine.


Conflict of interest statement

Declaration of Competing Interest The authors declare that they have no known competing financial interests or personal relationships that could have appeared to influence the work reported in this paper.

Figures

None
Graphical abstract
Fig. 1
Fig. 1
OPLS-DA and WGCNA identified 16 significantly changed lipid species in the ischemic penumbra. (A) Diagram showing the experimental design. (B) The plot depicting separation of the d1-con (d2-con, d3-con) and d1-ip (d2-ip, d3-ip) utilizing the OPLS-DA model. (C) Venn diagram of significantly changed lipid species between ischemic penumbra and corresponding contralateral area among 3 days. Lipid species with VIP > 1.0 in the OPLS-DA model, fold change (FC) > 1.5 and statistical significance (p < 0.05, t-test) between ischemic penumbra and corresponding contralateral area are considered as significantly regulated lipid species. (D) The soft-thresholding powers selection of WGCNA analysis. The left panel shows the scale-free fit index (y-axis) as a function of soft-thresholding power (x-axis). The red line represents the y-axis value and here the adjacency matrix is defined using soft-thresholds with beta = 7. The right panel shows the mean connectivity (y-axis) as a function of soft-thresholding powers (x-axis). (E) Clustering dendrograms of lipid species, with dissimilarity based on topological overlap, together with assigned module colors. (F) The module-group relationship heatmap. Each column corresponds to a group. Each row corresponds to a module, labeled with a color as in Fig. 1E. The first line in every square is the corresponding correlation coefficient and the second line is the p-value. The left side of heatmap indicates the module name and the number of lipid species is indicated. The right side of heatmap indicates the colors of correlation (blue represents negatively correlated and red represents positively correlated). Modules with significantly changed lipid species are indicated with red underlines. (G) Venn diagram displaying the overlapping lipid species in WGCNA modules (magenta, greenyellow and pink modules, Fig. 1F) and OPLS-DA models (Fig. 1C). (H) Heatmap showing the abundance of 16 overlapping lipid species in ischemic penumbra and corresponding contralateral area among 3 days. (I) ROC curve for individual lipid specie in (Fig. 1H) to separate ischemic penumbra from corresponding contralateral area. (For interpretation of the references to color in this figure legend, the reader is referred to the web version of this article.)
Fig. 2
Fig. 2
Acylcarnitine species accumulate markedly in the ischemic penumbra and peripheral blood in tMCAO mice. (A) PCA plot depicting separation of the ischemic penumbra (d1-ip, d2-ip, d3-ip) and corresponding contralateral area (d1-con, d2-con, d3-con) utilizing the first two components of the PCA model. (B) Concentration of total AcCa, SCAC, MCAC and LCAC in the ischemic penumbra and corresponding contralateral area among 3 days as measured by UHPLC-MS/MS. Data are presented as median ± max/min (N = 5 each group). Significant tMCAO effects (two-way ANOVA): &&&p < 0.001. Significant time effects (two-way ANOVA): #p < 0.05, ##p < 0.01, ###p < 0.001. Significant tMCAO-time interaction effects: $p < 0.05, $$p < 0.01, $$$p < 0.001. Significant tMCAO effects within each day (unpaired, two-tailed t test): *p < 0.05, **p < 0.01, ***p < 0.001. (C) Heatmap displaying the abundance of the 42 AcCa species in ischemic penumbra and corresponding contralateral area among 3 days. N = 5 each group. (D) Significantly accumulated AcCa species in the ischemic penumbra compared with corresponding contralateral area (p < 0.05 and FC > 1.5 within each day). Size of the circles indicates fold changes and colour of the circles indicates subgroups of AcCa. (E) PCA plot depicting separation of time-course lipidomic data from DBS samples of tMCAO mice 1 h before tMCAO as well as 6 h, 1 d, 3 d and 7 d after tMCAO. (F-G) Fuzzy c-means clustering identified 6 distinct temporal patterns of AcCa expression and AcCa species in each cluster were displayed. (H) Concentration of AcCa(C16), AcCa(C16:1), AcCa(C18), and AcCa(C18:1). Data are presented as mean ± SD (N = 8 each group). *p < 0.05, **p < 0.01, repeated measures one-way ANOVA followed by Dunnett's multiple comparisons test for AcCa(C16) and AcCa(18:1) and Friedman’s test for AcCa(C16:1) and AcCa(C18). (I) Relative level of AcCa(C8/C10) and AcCa(C3/C16). ***p < 0.01, repeated measures one-way ANOVA followed by Dunnett's multiple comparisons test.
Fig. 3
Fig. 3
LCAC is upregulated in the peripheral blood ofAISpatients. (A) The plot depicting separation of HC group and AIS group utilizing the OPLS-DA model of the AcCa profiling. (B) Heatmap displaying the abundance of significantly regulated AcCa species in HC and AIS patients. (N = 33 in HC group and N = 33 in AIS group, all p < 0.05, unpaired, two-tailed t-test for AcCa(C2), AcCa(C3),AcCa(C16), AcCa(18), AcCa(C18:1) and unpaired, Mann Whitney test for other AcCas. (C) ROC curve for individual AcCa(C4DC + C5-OH), AcCa(C12:1), AcCa(C14-OH) and the combination of the three AcCas to separate AIS group from HC group. (D) The concentration of SCAC, MCAC, and LCAC of AIS patients before mechanical thrombectomy versus the day 1 after surgery. (two-tailed Student’s t-test for pairwise comparisons) (E) The concentration of significantly changed MCAC and LCAC of AIS patients before mechanical thrombectomy versus the day 1 after surgery. (N = 18 each group, all p < 0.05, paired, two-tailed t-test for AcCa(C16), AcCa(C18), AcCa(C18:1), AcCa(C18:2) or Wilcoxon matched-pairs signed rank test for pairwise comparisons for other AcCas) (F) LASSO logistic regression for AcCa features selection and signature construction. On the basis of one standard error of the minimum criteria for the least cross-validation binominal deviance, a tuning parameter (λ) was selected via 10-fold cross-validation. The vertical line indicates the optimal λ value (λ = 0.108, log (λ) =  − 2.230) resulting in three features (AcCa(C3DC) + AcCa(C4-OH), AcCa(C3)/AcCa(C16), AcCa(C8)/AcCa(C10)) with nonzero coefficients (LASSO coefficient profiles) according to 10-fold cross-validation. (G) The ratio of AcCa(C3)/AcCa(C16) and AcCa(C8)/AcCa(C10) on the 1st day in AIS patients with good (mRS 0 to 2) outcomes versus poor (mRS 3 to 6) outcomes 3 months later. (H) ROC curve for Model 1 (include age, sex and NIHSS) and Model 2 (include Model 1 and the ratio of AcCa(C3)/AcCa(C16) and AcCa(C8)/AcCa(C10)) to separate AIS patients with good outcomes from poor outcomes 3 months later.
Fig. 4
Fig. 4
CPT2 overexpression decreases LCAC levels in vitro and in vivo. (A-B) CPT1 and CPT2 activity were determined in isolated mitochondria extracted from ischemic penumbra in tMCAO mice and corresponding area in sham mice. Data are presented as mean ± SD (N = 7 each group). *p < 0.05, ***p < 0.001, one-way ANOVA followed by Dunnett's multiple comparisons test. (C) Relative abundance of the AcCa(C16), AcCa(C18), AcCa(C18:1) and LCAC (the sum of AcCa(C16), AcCa(C18), and AcCa(C18:1)) in ischemic penumbra after 3 days in tMCAO mice or corresponding area in sham mice. Data are presented as mean ± SD (N = 5–6 each group). *p < 0.05, **p < 0.01, one-way ANOVA followed by Tukey's multiple comparisons test. (D, G, J) Microglia (D), neuron (G), astrocyte (J) cultures were immunostained for Iba-1, MAP2, GFAP to label microglia, neuron, astrocyte, respectively. scale bar = 50 μm. (E, H, K) PCA plot depicting separation of the control and OGD/R microglia (E), neuron (H) and astrocytes (K) utilizing the first two components of the PCA model. (F, I, L) Heatmap of detected AcCa in microglia (F), neuron (I) and astrocytes (L). (M) Relative abundance of the AcCa(C16), AcCa(C18), AcCa(C18:1) and LCAC (the sum of AcCa(C16), AcCa(C18), and AcCa(C18:1)) in the control and OGD/R astrocytes. Data are presented as mean ± SD (N = 5 each group). *p < 0.05, **p < 0.01, ***p < 0.001, unpaired, two-tailed t test. (N) Relative abundance of the AcCa(C16), AcCa(C18), AcCa(C18:1) and LCAC (the sum of AcCa(C16), AcCa(C18), and AcCa(C18:1)) in the OGD/R astrocytes with Ad-GFP or Ad-CPT2 infection. Data are presented as mean ± SD (N = 5–6 each group).
Fig. 5
Fig. 5
Decreased LCAC by overexpressing CPT2 is neuroprotective after stroke in vivo. (A) Diagram showing the experimental design. (B) Relative abundance of the AcCa(C16), AcCa(C18), AcCa(C18:1) and LCAC (the sum of AcCa(C16), AcCa(C18), and AcCa(C18:1)) in ischemic penumbra in tMCAO mice or corresponding area in sham mice. Data are presented as mean ± SD (N = 5 each group). *p < 0.05, **p < 0.01, one-way ANOVA followed by Dunnett's multiple comparisons test. (C) Infarct volume was quantified in TTC-stained brain sections at 24 h after tMCAO. Data are presented as mean ± SD (N = 8 each group). **p < 0.01, unpaired, two-tailed t test. Scale bar = 1 cm. (D) Neurological deficits were measured at 24 h after tMCAO by mNSS. Data are presented as mean ± SD (N = 8 in each group). *p < 0.05, unpaired, two-tailed t test. (E) Infarct volume was quantified in TTC-stained brain sections at 3 d after tMCAO. Data are presented as mean ± SD (N = 8–9 each group). *p < 0.05, unpaired, two-tailed t test. Scale bar = 1 cm. (F) Neurological deficits were measured at 1–3 d after tMCAO by mNSS. Data are presented as mean ± SD (N = 12 in each group). *p < 0.05, **p < 0.01, two-way repeated-measures ANOVA followed by Tukey's multiple comparisons test. (G) Atrophy volume was quantified in Nissl-stained brain sections at 28 d after tMCAO. Data are presented as mean ± SD (N = 7–8 in each group). *p < 0.05, unpaired, two-tailed t test. (H) Neurological deficits were measured at 7 d, 14 d, 21 d, and 28 d after tMCAO by mNSS. Data are presented as mean ± SD (N = 7–8 in each group). *p < 0.05, **p < 0.01, two-way repeated-measures ANOVA followed by Tukey's multiple comparisons test. (I) Percentage of right turn of 10 times tests were analyzed at 7 d, 14 d, 21 d, and 28 d after tMCAO. Data are presented as mean ± SD (N = 7–8 in each group). *p < 0.05, **p < 0.01, two-way repeated-measures ANOVA followed by Tukey's multiple comparisons test. (J) Latency to move a body length were measured at 1w, 2w, 3w, 4w after tMCAO. Data are presented as mean ± SD (N = 7–8 in each group). *p < 0.05, **p < 0.01, **p < 0.01, two-way repeated-measures ANOVA followed by Tukey's multiple comparisons test.
Fig. 6
Fig. 6
Decreased LCAC by overexpressing CPT2is neuroprotective after stroke in vitro. (A) Astrocytes were subject to OGD/R after 2 days infection with Ad-GFP or Ad-CPT2 and then cell viability was measured using the CCK8 assay. Data are presented as mean ± SD (N = 5 each group). *p < 0.05, **p < 0.01, one-way ANOVA followed by Dunnett's multiple comparisons test. (B) Astrocytes were subject to OGD for 6 h and incubated with vehicle or AcCa(C16) for 24 h at the initiation of reoxygenation after 2 days infection with Ad-GFP or Ad-CPT2 and then cell viability was measured using the CCK8 assay. Data are presented as mean ± SD (N = 4 each group). **p < 0.01, one-way ANOVA followed by Dunnett's multiple comparisons test. (C) Schematic diagram of neuron-astrocyte co-culture system to determine the effect of astrocytes with Ad-CPT2 overexpression on neuron viability and morphology. (D) Cell viability of neurons in co-cultured system exposed to OGD/R. (E-G) Representative images of primary neurons (E), sholl analysis (F), and total dendritic length (G) from neurons in co-cultured system. Data are presented as mean ± SD (N = 35–50 cells from 5 coverslips per group.). *p < 0.05, ***p < 0.001, one-way ANOVA followed by Tukey's multiple comparisons test (F); ***p < 0.001: significant differences were observed at 20 –240 pixels from the soma, ##p < 0.01: significant differences were observed at 40 –110 pixels from the soma, two-way ANOVA followed by Tukey’s post hoc multiple-comparison tests (G). Scale bar = 20 μm.
Fig. 7
Fig. 7
Excess AcCa(C16:0) amplifiesastrocytic mitochondrial damage from OGD/R. (A) Cell viability astrocytes exposed to AcCa(C16) under control or OGD/R conditions. Data are presented as mean ± SD (N = 5 each group). Significant OGD/R treatment (two-way ANOVA): ###p < 0.001. Significant LCAC treatment in OGD/R group (two-way ANOVA followed by Dunnett's multiple comparisons test, *p < 0.05, **p < 0.01, ***p < 0.001) (B-D) Total ROS using DCFH-DA (B) (N = 5 each group), mitochondrial ROS levels using MitoSOX (C) (N = 5 each group), mitochondrial membrane potential using TMRM (D) (N = 5 each group) were determined 24 h after initiation of reoxygenation with vehicle or AcCa(C16) after OGD 6 h. Data are presented as mean ± SD. Significant OGD/R treatment (two-way ANOVA): ###p < 0.001. Significant LCAC treatment in OGD/R group (two-way ANOVA followed by Dunnett's multiple comparisons test, *p < 0.05, **p < 0.01, ***p < 0.001). (E-F) Oxygen consumption rate (OCR) in control (E) or OGD/R astrocytes (F) treated with vehicle or AcCa(C16). Oligo, oligomycin; FCCP, carbonyl cyanide 4-trifluoromethoxy-phenylhydrazone; Rot, rotenone. Data are presented as mean ± SD (N = 10 wells from 3 independent experiments). *p < 0.05, **p < 0.01, ***p < 0.001, one-way ANOVA followed by Tukey's multiple comparisons test. (G-H) Representative photomicrographs of astrocytes (G) and mitochondrial mean length of rods/branches (H) and at 24 h after initiation of reoxygenation with vehicle or AcCa(C16) after OGD 6 h. Data are presented as mean ± SD (N = 22–28 mitochondria from 3 independent experiments, each point indicates a single mitochondrion). **p < 0.01, unpaired, two-tailed t test. Significant OGD/R treatment (two-way ANOVA): ###p < 0.001. Scale bar = 10 μm. (I) Representative images of astrocytic mitochondria in the ischemic penumbra of tMCAO mice. (J) TMRM of control astrocytes and OGD/R astrocytes infected with Ad-GFP or Ad-CPT2 were determined 24 h after initiation of reoxygenation. Data are presented as mean ± SD (N = 3–4). *p < 0.05, ***p < 0.001, one-way ANOVA followed by Tukey's multiple comparisons test. (K) TMRM of control astrocytes and OGD/R astrocytes infected with Ad-GFP or Ad-CPT2 were determined 24 h after initiation of reoxygenation with AcCa(C16) after OGD 6 h. Data are presented as mean ± SD (N = 3 each group). *p < 0.05, ***p < 0.001, one-way ANOVA followed by Tukey's multiple comparisons test.
Fig. 8
Fig. 8
Astrocytes liberateFFAs from LDs into mitochondria to form LCAC during OGD/R. (A) Total TG levels in ischemic penumbra and corresponding areas in sham or tMCAO mice (1 d, 3 d and 7 d after reperfusion). **p < 0.01, one-way ANOVA followed by Dunnett's multiple comparisons test. (B) Representative imaging of LDs stained with BD493 or oil red in the ischemic penumbra or and corresponding areas from sham or tMCAO mice (1 d, 3 d and 7 d after reperfusion). Scale bar = 500 μm. (C) Ipsilateral hemisphere from tMCAO/R 7 d mice was immunostained with astrocytes and TIP47 or BD493. Scale bar = 100 μm. (D) Astrocytes were exposed to OGD/R for the indicated times and BD493 was used to visualize LDs, and LD number was determined. Data are presented as mean ± SD (N = 6 each group). *p < 0.05, **p < 0.01, ***p < 0.001, one-way ANOVA followed by Tukey's multiple comparisons test. scale bar = 10 μm. (E) Schematic representation of the Red C12 pulse-chase assay: astrocytes were pulsed with Red C12 for 16 h, washed, and exposed to OGD 6 h/R 24 h with or without ATGLi at reoxygenation. Astrocytes were then imaged with BD493 or Mitotracker to determine the subcellular localization of the Red C12. (F-G) Astrocytes were assayed as described in Fig. 3E (F) and quantification of the correlation between Red C12 signal and mitochondria (upper panel) or LDs (lower panel). Data are presented as mean ± SD (N = 3 each group). *p < 0.05, **p < 0.01, one-way ANOVA followed by Tukey's multiple comparisons test. scale bar = 10 μm. (H-I) Schematic representation of the 13C4-FFA FFA pulse-chase assay: Astrocytes were first incubated with 13C4-FFA complexed with 0.5 % BSA for 24 h and exposed to OGD 6 h/R 24 h with or without ATGLi at reoxygenation (H) and relative abundance of d4-incooperated AcCa(C14), AcCa(C16), AcCa(C18), AcCa(C18:1) and LCAC (the sum of AcCa(C14), AcCa(C16), AcCa(C18), AcCa(C18:1)) was detected (I). Data are presented as mean ± SD (N = 5 each group). *p < 0.05, unpaired, two-tailed t test. (For interpretation of the references to color in this figure legend, the reader is referred to the web version of this article.)

References

    1. Feigin V.L., et al. Global, regional, and national burden of stroke and its risk factors, 1990–2019: a systematic analysis for the Global Burden of Disease Study 2019. Lancet Neurol. 2021;20:795–820. - PMC - PubMed
    1. Ma H., et al. Thrombolysis Guided by Perfusion Imaging up to 9 Hours after Onset of Stroke. N Engl J Med. 2019;380:1795–1803. - PubMed
    1. Powers WJ et al., 2018 Guidelines for the Early Management of Patients With Acute Ischemic Stroke: A Guideline for Healthcare Professionals From the American Heart Association/American Stroke Association. (2018).
    1. M. D, et al., Heart Disease and Stroke Statistics-2016 Update: A Report From the American Heart Association. Circulation133 (2016). - PubMed
    1. Jové M., et al. Metabolomics predicts stroke recurrence after transient ischemic attack. Neurology. 2015;84:36–45. - PMC - PubMed

LinkOut - more resources