

Analysis of omega-3 and omega-6 polyunsaturated fatty acid metabolism by compound-specific isotope analysis in humans
- PMID: 37572791
- PMCID: PMC10507585
- DOI: 10.1016/j.jlr.2023.100424
Analysis of omega-3 and omega-6 polyunsaturated fatty acid metabolism by compound-specific isotope analysis in humans
Abstract
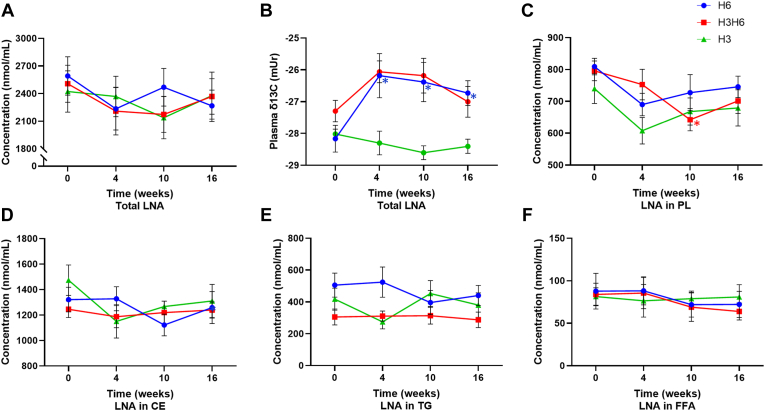
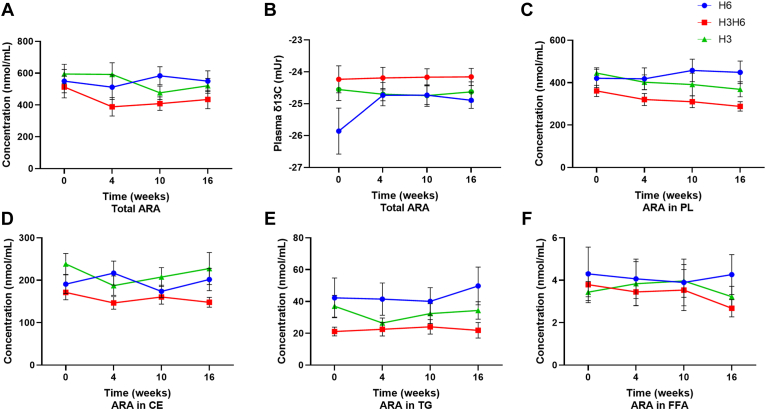
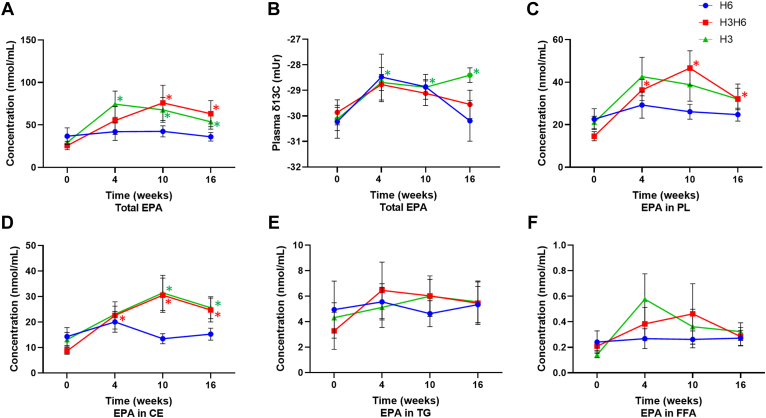
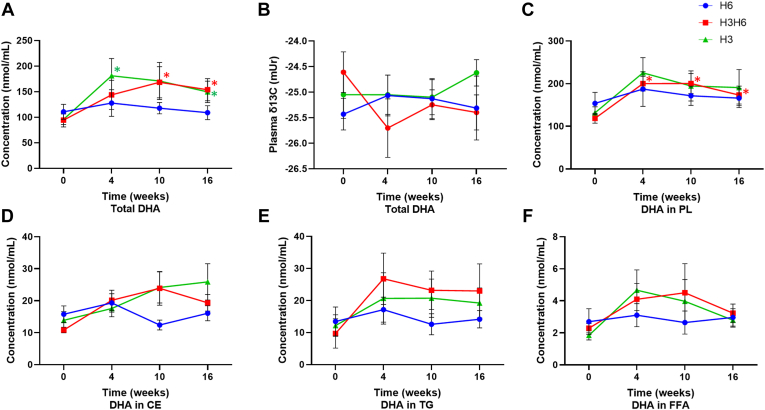
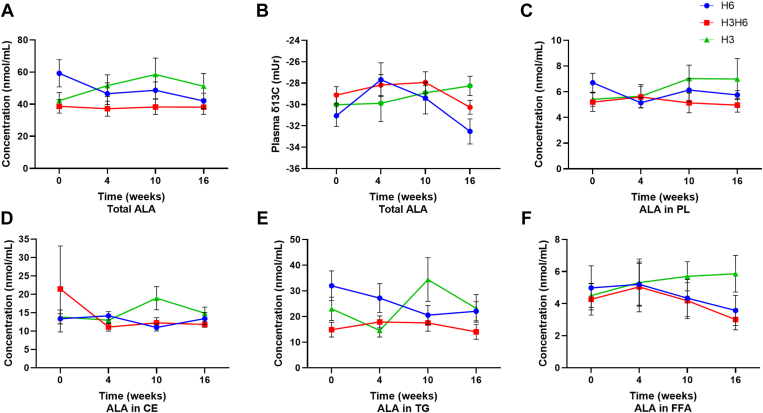
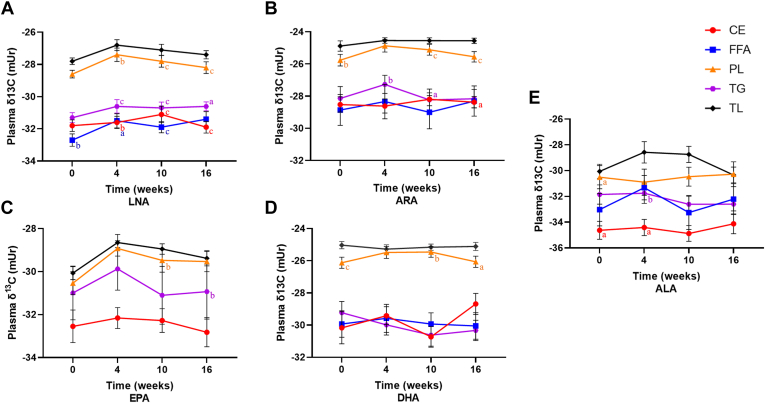
Natural variations in the 13C:12C ratio (carbon-13 isotopic abundance [δ13C]) of the food supply have been used to determine the dietary origin and metabolism of fatty acids, especially in the n-3 PUFA biosynthesis pathway. However, n-6 PUFA metabolism following linoleic acid (LNA) intake remains under investigation. Here, we sought to use natural variations in the δ13C signature of dietary oils and fatty fish to analyze n-3 and n-6 PUFA metabolism following dietary changes in LNA and eicosapentaenoic acid (EPA) + DHA in adult humans. Participants with migraine (aged 38.6 ± 2.3 years, 93% female, body mass index of 27.0 ± 1.1 kg/m2) were randomly assigned to one of three dietary groups for 16 weeks: 1) low omega-3, high omega-6 (H6), 2) high omega-3, high omega-6 (H3H6), or 3) high omega-3, low omega-6 (H3). Blood was collected at baseline, 4, 10, and 16 weeks. Plasma PUFA concentrations and δ13C were determined. The H6 intervention exhibited increases in plasma LNA δ13C signature over time; meanwhile, plasma LNA concentrations were unchanged. No changes in plasma arachidonic acid δ13C or concentration were observed. Participants on the H3H6 and H3 interventions demonstrated increases in plasma EPA and DHA concentration over time. Plasma δ13C-EPA increased in total lipids of the H3 group and phospholipids of the H3H6 group compared with baseline. Compound-specific isotope analysis supports a tracer-free technique that can track metabolism of dietary fatty acids in humans, provided that the isotopic signature of the dietary source is sufficiently different from plasma δ13C.
Keywords: EPA; arachidonic acid; fatty acid metabolism; human plasma; isotope ratio MS; linoleic acid; lipids; nutrition; omega-3 fatty acids; omega-6 fatty acids.
Copyright © 2023 The Authors. Published by Elsevier Inc. All rights reserved.
Conflict of interest statement
Conflict of interest R. P. B. has received industrial grants, including those matched by the Canadian government, and/or travel support related to work on brain fatty acid uptake from Arctic Nutrition, Bunge Ltd, DSM, Fonterra, Mead Johnson, and Nestle, Inc. Moreover, R. P. B. is on the executive of the International Society for the Study of Fatty Acids and Lipids and held a meeting on behalf of Fatty Acids and Cell Signaling, both of which rely on corporate sponsorship. R. P. B. has given expert testimony in relation to supplements and the brain and holds the Canada Research Chair in Brain Lipid Metabolism. None of the other authors report a conflict of interest related to research presented in this article.
Figures
References
-
- Brand W.A., Coplen T.B. Stable isotope deltas: tiny, yet robust signatures in nature. Isotopes Environ. Health Stud. 2012;48:393–409. - PubMed
-
- Brand W.A., Coplen T.B., Vogl J., Rosner M., Prohaska T. Assessment of international reference materials for isotope-ratio analysis (IUPAC Technical Report) Pure Appl. Chem. 2014;86:425–467.
-
- Nakamura K., Schoeller D.A., Winkler F.J., Schmidt H.L. Geographical variations in the carbon isotope composition of the diet and hair in contemporary man. Biomed. Mass Spectrom. 1982;9:390–394. - PubMed
Publication types
MeSH terms
Substances
Grants and funding
LinkOut - more resources
Full Text Sources
Research Materials
