. 2023 Oct 1;435(19):168236.
doi: 10.1016/j.jmb.2023.168236. Epub 2023 Aug 10.

CRISPR-dependent Base Editing Screens Identify Separation of Function Mutants of RADX with Altered RAD51 Regulatory Activity

Affiliations

CRISPR-dependent Base Editing Screens Identify Separation of Function Mutants of RADX with Altered RAD51 Regulatory Activity

Madison B Adolph et al. J Mol Biol. .

Abstract

RAD51 forms nucleoprotein filaments to promote homologous recombination, replication fork reversal, and fork protection. Numerous factors regulate the stability of these filaments and improper regulation leads to genomic instability and ultimately disease including cancer. RADX is a single stranded DNA binding protein that modulates RAD51 filament stability. Here, we utilize a CRISPR-dependent base editing screen to tile mutations across RADX to delineate motifs required for RADX function. We identified separation of function mutants of RADX that bind DNA and RAD51 but have a reduced ability to stimulate its ATP hydrolysis activity. Cells expressing these RADX mutants accumulate RAD51 on chromatin, exhibit replication defects, have reduced growth, accumulate DNA damage, and are hypersensitive to DNA damage and replication stress. These results indicate that RADX must promote RAD51 ATP turnover to regulate RAD51 and genome stability during DNA replication.

Keywords: DNA damage; DNA replication; Genome stability; Replication stress; single-stranded DNA binding protein.


Conflict of interest statement

Declaration of Competing Interest The authors declare that they have no known competing financial interests or personal relationships that could have appeared to influence the work reported in this paper.

Figures

Figure 1.
Figure 1.. RADX inactivation decreases RPE WT cell growth but suppresses RPE p53−/− cell sensitivity to RAD51 inhibition in the presence of replication stress.
A) Competitive growth assay in untreated RPE WT and RPE p53−/− cells stably expressing either GFP or mCherry. Data represent cells transfected with non-targeting or siRADX in mCherry or GFP cell lines, respectively, and normalized to the day 1 time point. Each condition was plated in triplicate wells. Mean +/− SD, n=2. B) Cells transfected with siRNAs were treated with HU and viability was measured 72 hours later (mean ± SEM, n = 3). p value was calculated using a one-way ANOVA C) Parental or RADXΔ cells were treated with 25 mM of B02 over a range of HU concentrations and viability was measured 72 hours later (mean ± SEM, n = 3). p value was calculated using a one-way ANOVA. D) Competitive growth assay in RPE p53−/− cells stably expressing either GFP or mCherry and treated with 2.5 mM HU and 25 mM B02. Data represent cells transfected with non-targeting or siRADX in mCherry or GFP cell lines, respectively, and normalized to the day 1 time point. Mean +/− SD for n=2.
Figure 2.
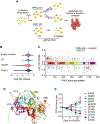
Figure 2.. CRISPR-dependent base editing screens identify mutants of interest in RADX.
A) Schematic of CRISPR-dependent base editing screen. RPE WT or RPE p53−/− cells were transduced with lentiviral sgRNA library and then cultured for 18 days after selection. sgRNA abundance between day 0 (T0) and day 18 (T18) was determined by next-generation sequencing (NGS). B) Density plots of LFC for control and RADX gRNAs in RPE WT cells. C) Lollipop plot of RADX sgRNAs and their LFC values in untreated RPE WT or RPE p53−/− in the presence of 2.5 mM HU and 10 μM B02. sgRNAs that did not meet LFC or p-value significance cutoffs are colored grey while sgRNAs with LFC >0.5 and p-values >0.01 are colored blue (RPE WT, untreated) or red (RPE p53−/−, HU and B02). D) AlphaFold predicted structure of RADX with the region containing the RADX 3,4-ID mutants colored teal. The side chains of residues tested are displayed as stick models revealing they are all predicted to be surface exposed in this model. E) Competitive growth assay in BE3-expressing RPE p53−/− cells treated with HU and B02 expressing the indicated sgRNAs. Data represent the GFP-sgRNA mCherry-AAVS1 control ratio normalized to the day 1 (T1) time point. Mean ± SD for n = 2.
Figure 3.
Figure 3.. RADX 3,4-ID mutants slow replication elongation and increase DNA damage in S-phase cells.
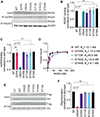
A) γH2AX intensity in EdU-positive S phase U2OS wild-type or RADXΔ cells complemented with empty vector (EV) control, wild-type RADX, or the indicated RADX mutants. P values were derived from a one-way ANOVA with a Dunnett’s multi-comparison test. B) Cells were labeled with CldU and IdU as indicated and then analyzed by DNA combing to measure fork speed. A representative experiment is shown with p values derived from a one-way ANOVA with Dunnett’s multiple-comparison test. C) Immunoblots of U2OS or RADXΔ cells infected with lentivirus expressing the wild-type (WT) RADX or RADX mutants. The bottom asterisk indicates the expression of endogenous RADX, while the top asterisk represents the overexpressed FlagRADX. A non-specific cross-reactive protein is visible in the U2OS and RADXΔ cells while the many RADX degradation products are visible after overexpression. D) Proximity ligation assay between FLAG-RADX and EdU to measure localization to replication forks. Cells were labeled for 10 min with EdU. P values were derived from a one-way ANOVA with a Dunnett’s multi-comparison test.
Figure 4.
Figure 4.. RADX 3,4-ID mutants decrease cell viability and cause hypersensitivity to replication stress and DNA damaging agents.
A) RADXΔ U2OS cells complemented with empty vector (EV) control, wild-type RADX or the indicated mutants of RADX were plated in the absence of drug and surviving colonies examined by methylene blue staining and quantified (mean ± SEM, n = 3). B-D) Parental or RADXΔ cells complemented with empty vector control, wild-type RADX or the indicated mutants of RADX were treated with the indicated drugs and viability was measured 72 hours later (mean ± SEM, n = 3). P values were generated with a one-way ANOVA with a Dunnett’s multi-comparison test.
Figure 5.
Figure 5.. RADX 3,4-ID mutants bind ssDNA, bind RAD51-ATP, and oligomerize.
A) Interaction of purified MBP-RADX, -QVPK and -OB2m purified from insect cells and MBP-RADX mutants purified from HEK293T cells with RAD51 in the presence of ATP, or biotinylated ssDNA. B) and C) Quantitation of RAD51 and ssDNA binding from three replicates of Figure 1A. Data was normalized to the loading of the input and then compared to wildtype within each replicate. P values were generated with a one-way ANOVA with a Dunnett’s multi-comparison test. D) Steady state rotational anisotropy of MBP-RADX purified from insect cells or MBP-RADX mutants purified from HEK293T cells binding to a ssDNA (dT50). KD values were determined by fitting a sigmoidal curve. E) Analysis of RADX oligomerization. Flag-RADX wild-type was co-expressed with HA-RADX mutants in HEK293T cells. HA immunoprecipitation from cell lysates was followed by SDS-PAGE and immunoblotting. (EV = empty vector). F) Quantification of oligomerization from three replicates of Figure 1E. Data was normalized to the input and then compared to wildtype. P values were generated with a one-way ANOVA with a Dunnett’s multi-comparison test.
Figure 6.
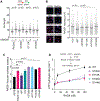
Figure 6.. 3,4-ID mutants of RADX fail to regulate RAD51.
A)Parental or RADXΔ cells complemented with empty vector control, wild-type RADX or the indicated mutants of RADX were transfected with siNT or siRAD51 and labeled with CldU and IdU as indicated and then analyzed by DNA combing for replication fork speed. Representative experiment is shown with p values derived from a one-way ANOVA with Dunnett’s multiple-comparison test. B and C) RADXΔ U2OS cells complemented with empty vector control, wild-type RADX or the indicated mutants of RADX were labeled with 10 μM EdU for 30 min. Cells were stained for RAD51 and EdU after detergent extraction. B) The intensity of chromatin-bound RAD51 in EdU-positive cells is quantified. C) The number of foci per S-phase nucleus for RAD51 is quantified. p values were derived from a Mann-Whitney test. D) RAD51 ATPase assay with increasing concentrations of wild type or mutant MBP-RADX added to the reaction after the addition of RAD51. In the experiments shown wild type protein was purified from insect cells and mutants from human cells. We verified that MBP-RADX purified from both systems yielded the same results.

References

    1. Bhat KP and Cortez D. (2018). RPA and RAD51: fork reversal, fork protection, and genome stability. Nat Struct Mol Biol. 25(6): p. 446–453. - PMC - PubMed
    1. Morati F and Modesti M. (2021). Insights into the control of RAD51 nucleoprotein filament dynamics from single-molecule studies. Curr Opin Genet Dev. 71: p. 182–187. - PubMed
    1. Sullivan MR and Bernstein KA. (2018). RAD-ical New Insights into RAD51 Regulation. Genes (Basel). 9(12). - PMC - PubMed
    1. Sung P, et al. (2003). Rad51 recombinase and recombination mediators. J Biol Chem. 278(44): p. 42729–32. - PubMed
    1. Andriuskevicius T, Kotenko O, and Makovets S. (2018). Putting together and taking apart: assembly and disassembly of the Rad51 nucleoprotein filament in DNA repair and genome stability. Cell Stress. 2(5): p. 96–112. - PMC - PubMed

Publication types

MeSH terms

LinkOut - more resources