. 2023 Aug 12;24(1):311.
doi: 10.1186/s12859-023-05424-8.

An information-theoretic approach to single cell sequencing analysis

Affiliations

An information-theoretic approach to single cell sequencing analysis

Michael J Casey et al. BMC Bioinformatics. .

Abstract

Background: Single-cell sequencing (sc-Seq) experiments are producing increasingly large data sets. However, large data sets do not necessarily contain large amounts of information.

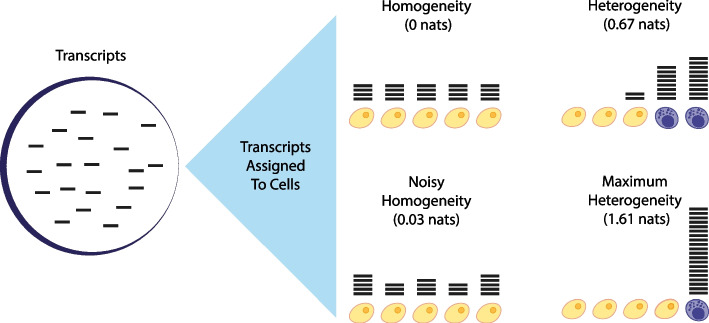
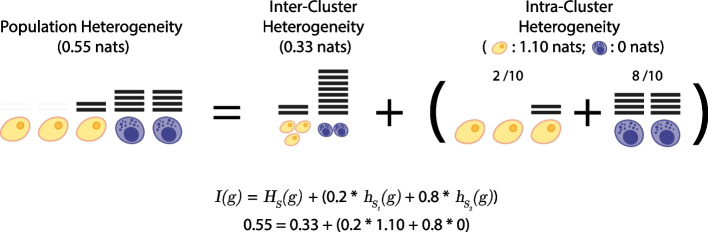
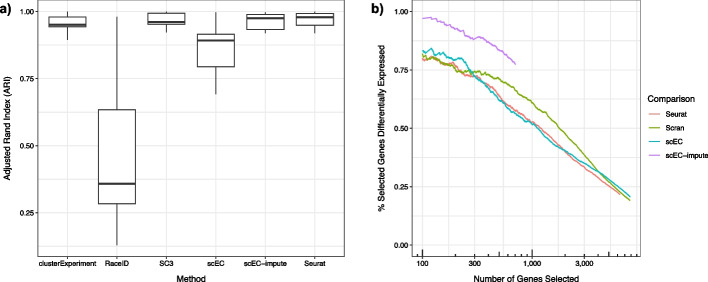
Results: Here, we formally quantify the information obtained from a sc-Seq experiment and show that it corresponds to an intuitive notion of gene expression heterogeneity. We demonstrate a natural relation between our notion of heterogeneity and that of cell type, decomposing heterogeneity into that component attributable to differential expression between cell types (inter-cluster heterogeneity) and that remaining (intra-cluster heterogeneity). We test our definition of heterogeneity as the objective function of a clustering algorithm, and show that it is a useful descriptor for gene expression patterns associated with different cell types.

Conclusions: Thus, our definition of gene heterogeneity leads to a biologically meaningful notion of cell type, as groups of cells that are statistically equivalent with respect to their patterns of gene expression. Our measure of heterogeneity, and its decomposition into inter- and intra-cluster, is non-parametric, intrinsic, unbiased, and requires no additional assumptions about expression patterns. Based on this theory, we develop an efficient method for the automatic unsupervised clustering of cells from sc-Seq data, and provide an R package implementation.


Conflict of interest statement

The authors declare that they have no competing interests.

Figures

Fig. 1
Fig. 1
An information-theoretic view of sc-Seq data. Transcripts, or more generally counts, of a given gene (shown here as horizontal bars) are assigned to cells after sequencing. If the cell population is homogeneous with respect to the expression of g, then the heterogeneity I(g) will be zero (top left population, I(g)=0). In practice, the transcript assignment process is stochastic, and so there will always be some deviation from this ideal (bottom left population, I(g) small). (Note that the technical effects of this stochasticity on the information obtained may be reduced by using a shrinkage estimator to determine the distribution of transcripts (see “Methods” Section)). If the population is heterogeneous, then transcripts may be preferentially expressed in a subset of cells and the information obtained from the experiment, as measured by I(g) will be larger (top right population, I(g) large), reaching a maximum at log(N), where N is the number of cells sequenced, when only one cell expresses the gene (bottom right population, I(g)=ln(5)1.61 largest).Note that the population heterogeneity I(g) is independent of any decomposition of the cell populations into subpopulations (shown here as yellow and purple cells, for illustration). However, given any grouping of the cells into subpopulations, I(g) can be formally decomposed as the sum of the heterogeneity explained by within and in-between subpopulations (see “Results” Section and Fig. 3). This decomposition, but not the overall value of I(g), does depend on the chosen assignment of cells to subpopulations
Fig. 2
Fig. 2
Information-theoretic single-cell analysis. Recall that I(g) measures the heterogeneity of a cellular population with respect to the expression of g: I(g)=0 when transcripts are expressed uniformly and increases as transcripts are expressed preferentially in a subset of cells, reaching a maximum I(g)=log(N), where N is the number of cells sequenced, when only one cell expresses the gene. ae Plots of expression heterogeneity, I(g) (normalised by the theoretical maximum, log(N)) against log mean expression for the bench-marking sc-Seq data sets described in the main text. In each panel, each point represents a gene profiled. The number of genes associated with large values of I(g) increases with the number of cell types present in the population profiled, showing I(g) as a valid measure of cell type diversity. Panel a shows data from a technical control [42] (number of cell types, C=1), b a mixture of three cancerous cell lines [46] (C=3), c FACS sorted immune cells [52] (C=4), d a sample of mouse bone marrow [41] (C=14), and e a multi-organ mouse cell atlas [44] (C=56). fh Biologically meaningful cell annotations are associated with high inter-cluster heterogeneity. Established cell annotations for the f Tian, g Zheng and h Stumpf data are associated with higher inter-cluster heterogeneity than expected by chance (i.e., in randomly permuted clusters; significance is assessed using a one-sided exact test with 104 permutations; y axes show log10(p+1)). In all panels the red line shows p<0.05, false discovery rate corrected for 500 trials [2, 8]. Genes below this threshold are significantly different gene expression patterns across the set of identified cell types. i Summary statistics for the total inter-cluster heterogeneity HS=gHS(g) based on established empirical and randomly permuted cell annotations (104 random permutations in each case). These statistics show the strong association of high HS with biologically meaningful groupings of cells. j A Uniform Manifold Approximation and Projection (UMAP) [29] plot of the top 500 genes by I(g) for the Stumpf data set; each point is a cell, coloured by its scEC cluster. This shows that I(g) is able to capture the continuous variation of developing cell types
Fig. 3
Fig. 3
Heterogeneity is additively decomposable. The heterogeneity of a population of cells (5 cells in this illustration) with respect to the expression of a gene g, I(g), can be decomposed into inter- and intra-cluster heterogeneities for any proposed clustering, S (here, two subpopulations, or clusters, of 3 yellow and 2 purple cells). The inter-cluster heterogeneity HS(g) is determined by independently aggregating all transcripts (shown as horizontal lines) associated with each sub-population in S and then taking the KLD of the resulting distribution from the uniform distribution of the transcripts over C clusters. It measures the extent to which transcripts are uniformly assigned to clusters. The intra-cluster heterogeneity hS(g) is determined by taking the weighted sum (with respect to the number of transcripts on each subpopulation) of the heterogeneities of each of the constituent subpopulations, considered independently. It represents the average heterogeneity of the proposed clusters, accounting for disparities in number of transcripts assigned. In this toy example, the overall population heterogeneity of gene g, I(g)=0.55, decomposes as the sum of the inter-cluster heterogeneity HS(g)=0.33, plus the intra-cluster heterogeneity hS(g)=0.22. The latter is obtained as the weighted sum (with respect to the number of transcripts in each cluster, here 2/10=0.2 and 8/10=0.8) of the heterogeneities on each subpopulation. Further details and formulae are provided in the “Methods” Section
Fig. 4
Fig. 4
Comparison of inter-cluster heterogeneity of scEC-generated clusters versus established annotations. Plots of HS(g) based on an scEC-generated clustering (x-axis) and established annotations (y-axis) for the a Zheng and b Stumpf, and c an alternative data set from Tian [41, 46, 52]. In all panels each point represents a gene profiled and the red line indicates HscEC(g)=HKnown(g). For the genes below the red lines, the scEC clustering is better than the prior annotation at explaining the gene expression heterogeneity as inter-cluster variability, and vice versa for the genes above the red line
Fig. 5
Fig. 5
Benchmarking of scEC performance in unsupervised clustering and feature selection. a Adjusted Rand Index of clusterings produced by specified methods against known ground truth for seven data sets, each consisting of three or five cancerous lines sequenced on different platforms. With an additional imputation step, scEC performs on par with other methods. b The percent of the top N genes by different feature selection metrics that are differentially expressed. Data set is Sc-seq from three cancerous cell lines sequenced by Drop-seq (with 2005 differential expressed genes identified from non-parametric testing for each cell line versus the remaining; Wilcox test, fasle discovery rate corrected p-value <0.05). The greater ability of scEC-impute to a priori select differentially expressed genes is repeated across each benchmark data set, see Additional file 1: Fig. S2. Note that the imputation step in scEC-impute assigns many genes a heterogeneity I(g) of zero, resulting in a low cut-off on total number of selectable genes

References

    1. Ashburner M, Ball CA, Blake JA, Botstein D, Butler H, Cherry JM, Davis AP, Dolinski K, Dwight SS, Eppig JT, et al. Gene ontology: tool for the unification of biology. Nate Genet. 2000;25(1):25–29. doi: 10.1038/75556. - DOI - PMC - PubMed
    1. Benjamini Y, Hochberg Y. Controlling the false discovery rate: a practical and powerful approach to multiple testing. J R Stat Soc: Ser B (Methodol) 1995;57(1):289–300.
    1. Blondel VD, Guillaume J-L, Lambiotte R, Lefebvre E. Fast unfolding of communities in large networks. J Stat Mech: Theory Exp. 2008;2008(10):P10008. doi: 10.1088/1742-5468/2008/10/P10008. - DOI
    1. Brennecke P, Anders S, Kim JK, Kołodziejczyk AA, Zhang X, Proserpio V, Baying B, Benes V, Teichmann SA, Marioni JC, et al. Accounting for technical noise in single-cell rna-seq experiments. Nat Meth. 2013;10(11):1093–1095. doi: 10.1038/nmeth.2645. - DOI - PubMed
    1. Byrd RH, Lu P, Nocedal J, Zhu C. A limited memory algorithm for bound constrained optimization. SIAM J Sci Comput. 1995;16(5):1190–1208. doi: 10.1137/0916069. - DOI

LinkOut - more resources