. 2023 Aug 12;22(1):133.
doi: 10.1186/s12943-023-01825-8.

STAT3/LKB1 controls metastatic prostate cancer by regulating mTORC1/CREB pathway

Affiliations

STAT3/LKB1 controls metastatic prostate cancer by regulating mTORC1/CREB pathway

Jan Pencik et al. Mol Cancer. .

Abstract

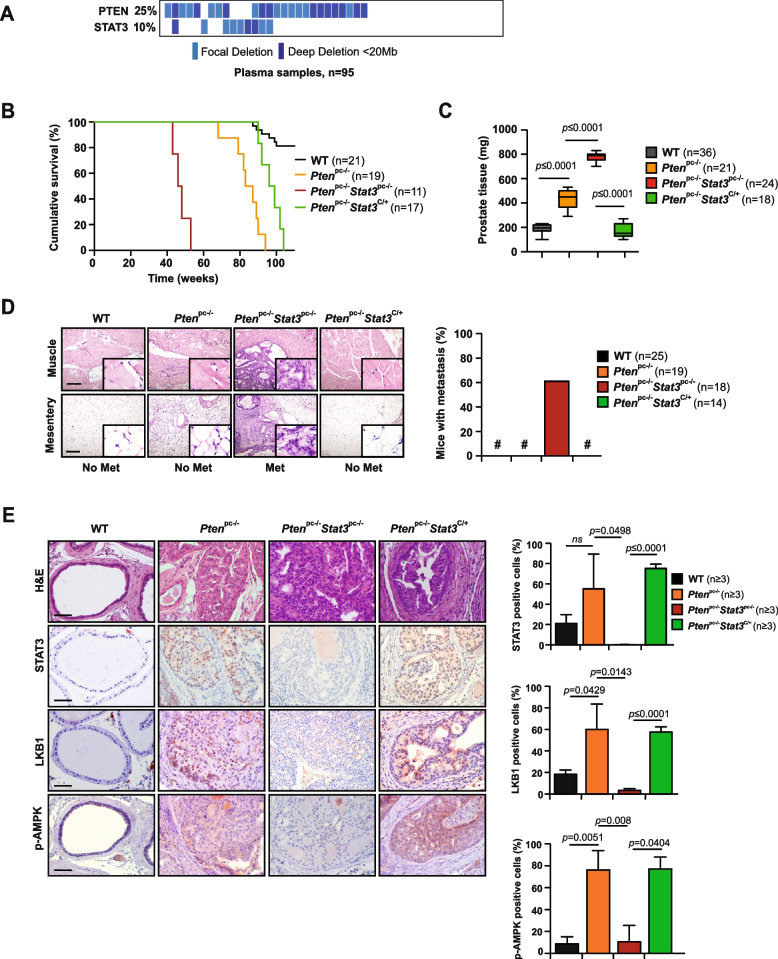
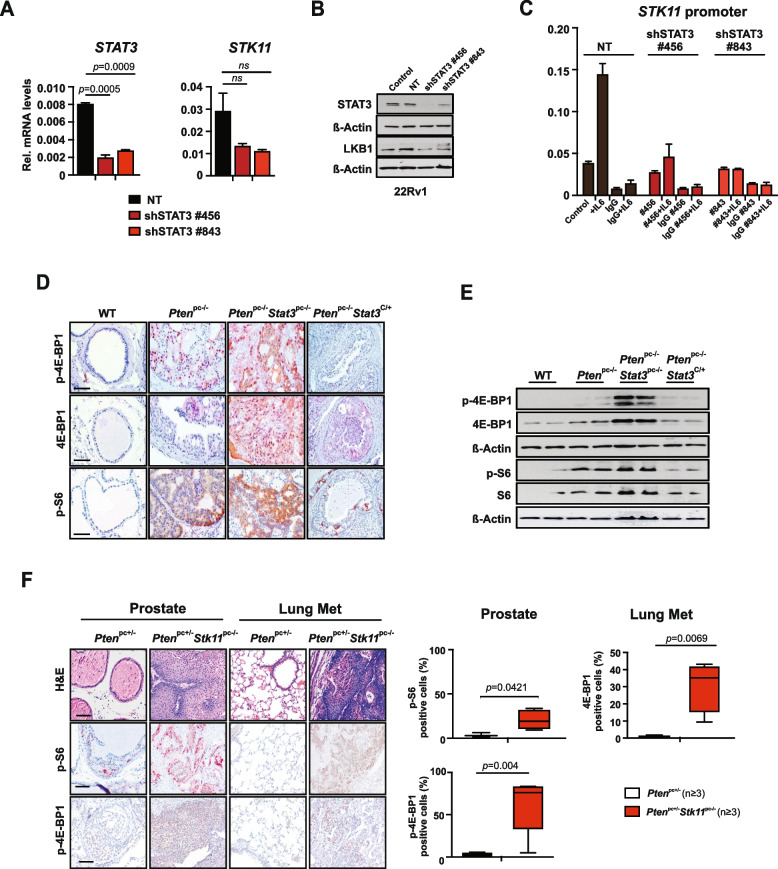
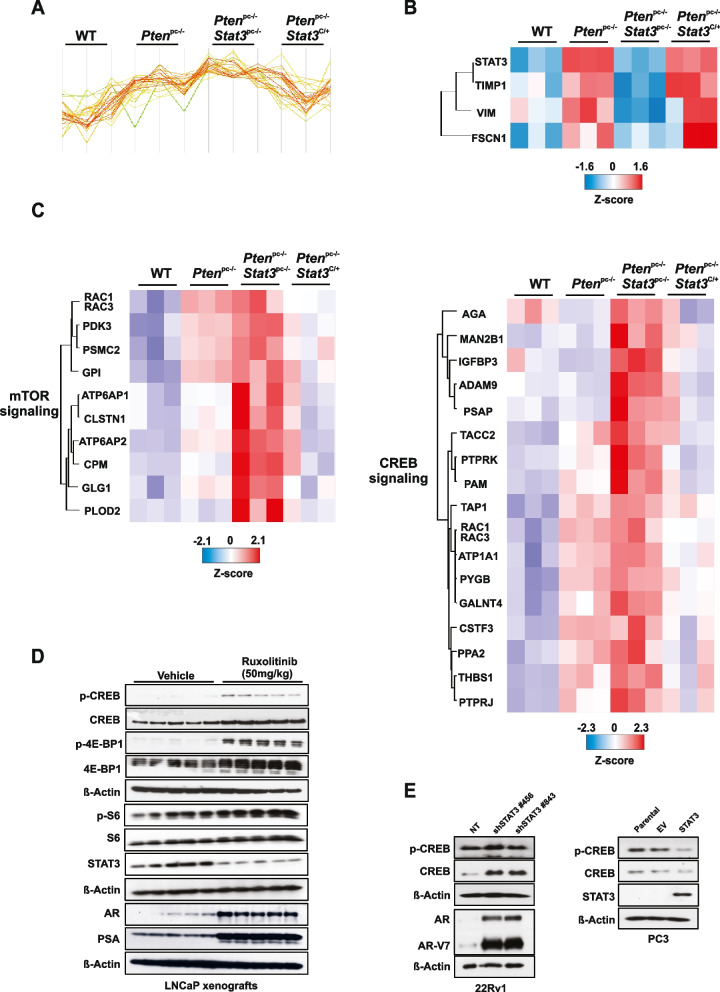
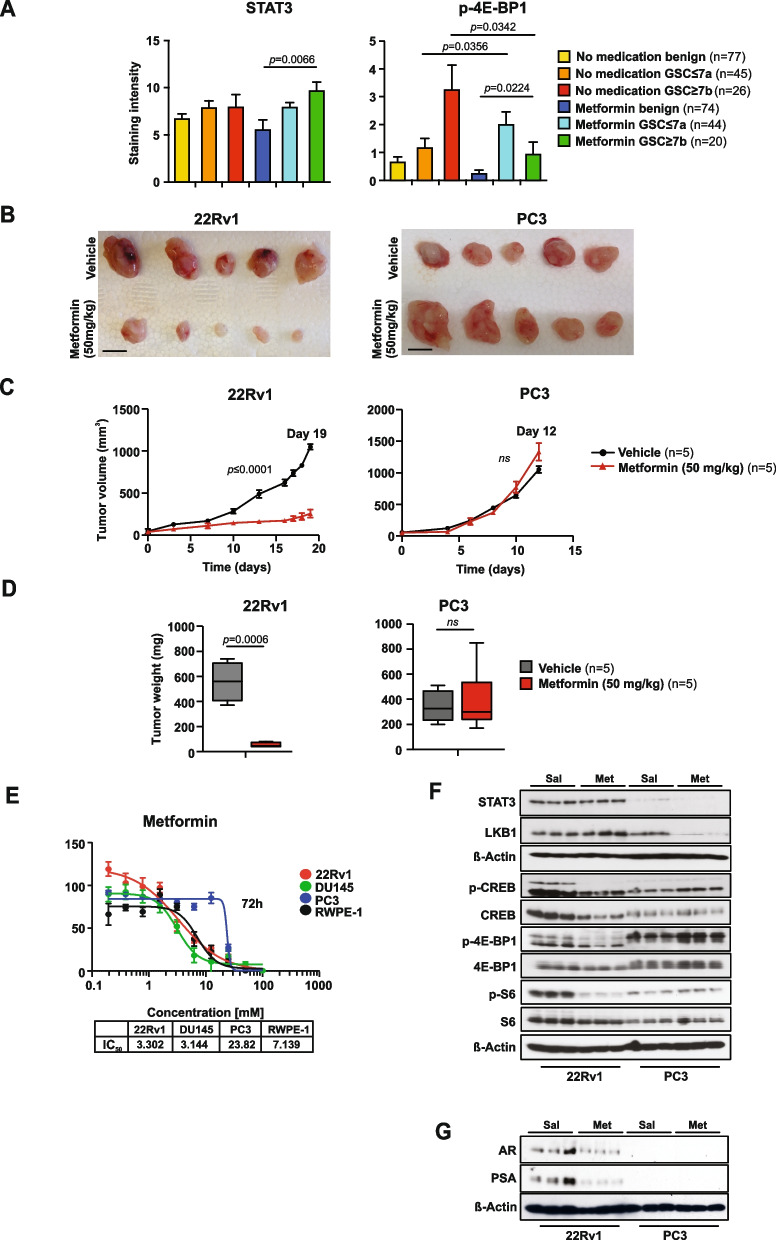
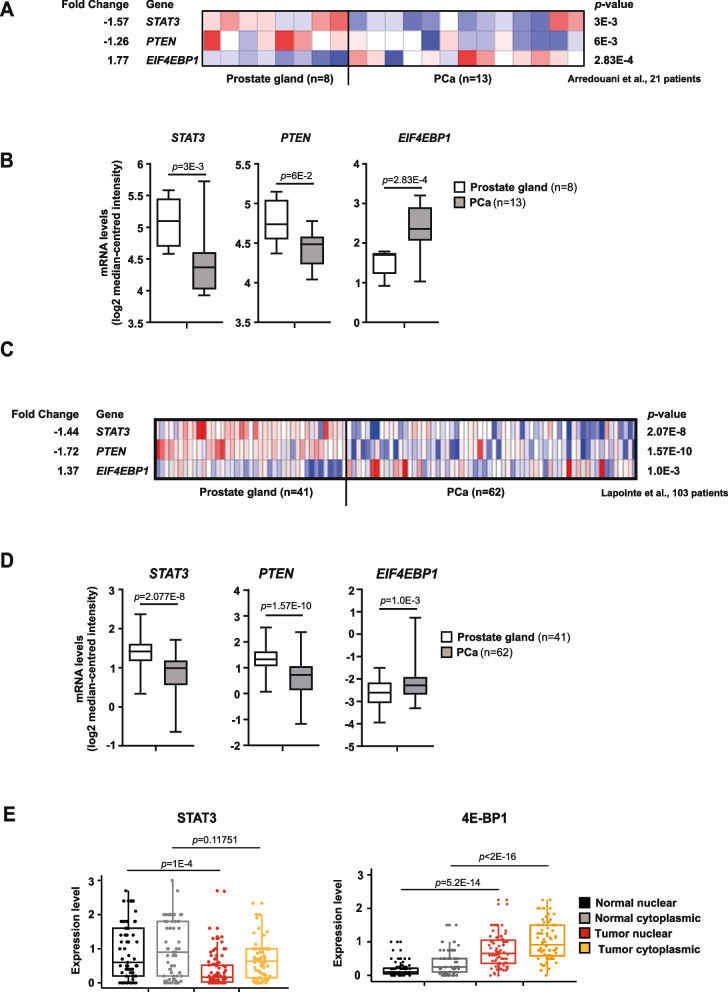
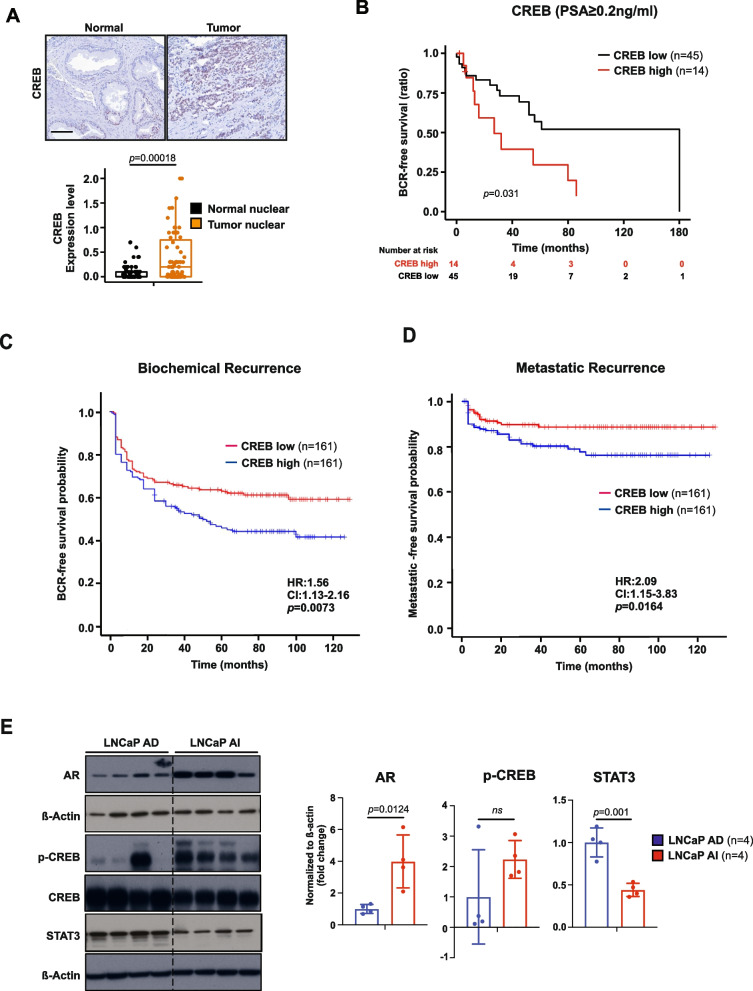
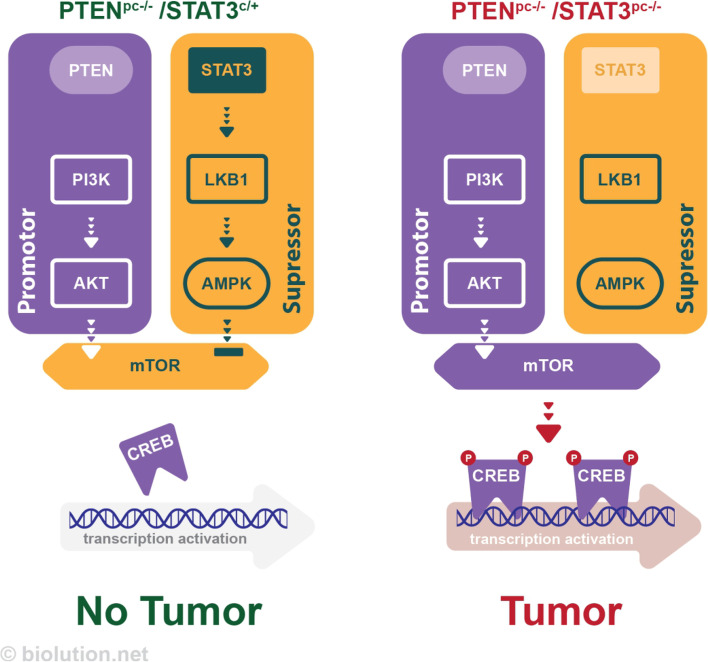
Prostate cancer (PCa) is a common and fatal type of cancer in men. Metastatic PCa (mPCa) is a major factor contributing to its lethality, although the mechanisms remain poorly understood. PTEN is one of the most frequently deleted genes in mPCa. Here we show a frequent genomic co-deletion of PTEN and STAT3 in liquid biopsies of patients with mPCa. Loss of Stat3 in a Pten-null mouse prostate model leads to a reduction of LKB1/pAMPK with simultaneous activation of mTOR/CREB, resulting in metastatic disease. However, constitutive activation of Stat3 led to high LKB1/pAMPK levels and suppressed mTORC1/CREB pathway, preventing mPCa development. Metformin, one of the most widely prescribed therapeutics against type 2 diabetes, inhibits mTORC1 in liver and requires LKB1 to mediate glucose homeostasis. We find that metformin treatment of STAT3/AR-expressing PCa xenografts resulted in significantly reduced tumor growth accompanied by diminished mTORC1/CREB, AR and PSA levels. PCa xenografts with deletion of STAT3/AR nearly completely abrogated mTORC1/CREB inhibition mediated by metformin. Moreover, metformin treatment of PCa patients with high Gleason grade and type 2 diabetes resulted in undetectable mTORC1 levels and upregulated STAT3 expression. Furthermore, PCa patients with high CREB expression have worse clinical outcomes and a significantly increased risk of PCa relapse and metastatic recurrence. In summary, we have shown that STAT3 controls mPCa via LKB1/pAMPK/mTORC1/CREB signaling, which we have identified as a promising novel downstream target for the treatment of lethal mPCa.

Keywords: AMPK; AR; CREB; LKB1; Metformin; Prostate Cancer; STAT3; mTORC1.


Conflict of interest statement

The authors declare no competing interests.

Figures

Fig. 1
Fig. 1
Loss of STAT3 accelerates metastatic progression and exhibits decreased LKB1/AMPK signaling. A High occurrence of PTEN and STAT3 deletions in plasma samples of PCa patients with aggressive PCa (n = 95). B Kaplan–Meier cumulative survival analysis revealed a significant (p = 0.0026; log-rank test) increase in lifespan of Ptenpc−/−Stat3C/+ compared to Ptenpc−/−Stat3pc−/− mice; WT and Ptenpc−/− mice served as controls (n = 68). C Prostate weights of 19-week-old WT, Ptenpc−/−Ptenpc−/−Stat3pc−/− and Ptenpc−/−Stat3C/+ mice (n = 99). Mean values are shown; Data were analyzed by one-way analysis of variance with Tukey’s multiple comparison test; error bars: s.d. D IHC of muscle and mesentery, 52 weeks of age WT, Ptenpc−/−, Ptenpc−/−Stat3C/+ and Ptenpc−/−Stat3pc−/− mice. MET- metastasis, Scale bars, 100 μm; insets: × 600 magnification. Percentage of mice with distant PCa metastases (n = 76). E Haematoxilin/eosin (H&E) stains show only high-grade PIN in Ptenpc−/−Stat3C/+ mice compared with Ptenpc−/− and Ptenpc−/−Stat3pc−/− mice. Scale bars, 100 μm. IHC analysis of Stat3, Lkb1 and p-Ampk in prostates from 19-week-old WT, Ptenpc−/−Ptenpc−/− Stat3pc−/− and Ptenpc−/−Stat3C/+ mice. Scale bars, 100 μm. Bar graphs indicate percentage of cells positive for Stat3, Lkb1 and p-Ampk in prostates of 19-week-old WT, Ptenpc−/−, Ptenpc−/−Stat3pc−/− and Ptenpc−/−Stat3.C/+. Protein levels quantification was done with HistoQuest software (n ≥ 3)
Fig. 2
Fig. 2
STAT3 and LKB1 cooperate to suppress mTORC1. A Western blot analysis of STAT3 and LKB1 in 22Rv1 cells transfected with non-targeting (NT) or shRNAs specific for STAT3 and/or LKB1. B qRT–PCR analysis of STAT3 and STK11 in 22Rv1 cells transfected with NT or shRNA specific for STAT3 (n = 3 each). C ChIP analysis of STAT3 binding to LKB1 (STK11) promoter. 22Rv1 cells harboring NT or two different shSTAT3 constructs were stimulated with IL-6 and immunoprecipated with STAT3 antibody or IgG as a negative control. Bars represent mean ± s.d. from 2 technical replicates. Precipitated DNA is presented as % of input. D IHC analysis of p-4E-BP1, 4E-BP1, p-S6 in prostates from 19-week-old WT, Ptenpc−/−Ptenpc−/− Stat3pc−/− and Ptenpc−/−Stat3C/+ mice. Scale bars, 100 μm. E Western blots analysis of p-4E-BP1, 4E-BP1, p-S6 and S6 expression in prostates from 19-week-old WT, Ptenpc−/−Ptenpc−/− Stat3pc−/− and Ptenpc−/−Stat3C/+ mice. β-actin serves as a loading control. F H&E and IHC analyses of Stat3, p-S6 and p-4E-BP1 in prostates and lung metastases from Ptenpc+/− and Ptenpc+/− Stk11pc−/− mice, scale bars, 100 μm. Quantification of cells positive for STAT3 and p-4E-BP1 in 19-week-old Ptenpc+/− and Ptenpc+/− Stk11pc−/− prostate tissue or lung metastases using HistoQuest software (n = 3). Data were analyzed by Student’s t-test and are shown as mean ± s.d
Fig. 3
Fig. 3
STAT3 is a central regulator of mTORC1 and CREB signaling. A, B Signature and heatmap of Stat3 and Stat3-regulated proteins in FFPE laser-microdissected prostates of 19-week-old WT, Ptenpc−/−, Ptenpc−/−Stat3pc−/− and Ptenpc−/−Stat3C/+ (n = 3 each) using unbiased LC–MS/MS proteomics. C The heatmap shows reprogramming of mTOR and CREB metabolic pathways in PCa with significant enrichment (hypergeometric test, q-value < 0.05). D Western blot analysis of p-CREB, CREB, p-4E-BP1, 4E-BP1, STAT3, p-S6, S6, AR and PSA of LNCaP xenograft tumors treated with vehicle or ruxolitinib (50 mg kg−1) for 22 days. β-actin serves as a loading control. E Western blot analysis of p-CREB, CREB, AR, AR-V7 in 22Rv1 cells transfected with non-targeting (NT) or shRNAs specific for STAT3. Western blot analysis of STA3, p-CREB and CREB in PC3 cells transfected with an empty vector (EV) or STAT3 add-back. PC3 cells lacks STAT3 expression
Fig. 4
Fig. 4
Clinically relevant dose of metformin inhibits CREB/mTORC1 in a manner that requires AR and STAT3 signaling. A IHC of radical prostatectomy specimens (benign and cancer core) stained with STAT3 and p-4E-BP1. TMA including benign and cancerous tissue with either metformin (n = 41) or patients without antidiabetic medication (n = 39) was employed as described previously [46]. B Gross anatomy assessment of representative 22Rv1 and PC3 xenograft tumors treated with vehicle or metformin (50 mg/kg; i.p.). Scale bars, 10 mm. Mean values are shown; error bars: s.d. (n = 5). C 22Rv1 and PC3 cells were implanted subcutaneously in mice and grown until tumors reached the size of approximately 100mm3. Xenografted mice were randomized and then received (n = 5 per group) vehicle or 50 mg/kg metformin i.p. daily. Mean tumor volume ± s.d. is shown. D Tumor weights assessment of representative 22Rv1 and PC3 xenograft tumors treated with vehicle or metformin (50 mg/kg; i.p.). Scale bars, 10 mm. Mean values are shown; error bars: s.d. (n = 5). E Comparison of IC50 values of metformin for human PCa cell lines (22Rv1, DU-145 and PC3) and untransformed human prostate cell line RWPE-1. F Western blot analysis of STAT3, LKB1, p-CREB, CREB, p-4E-BP1, 4E-BP1, p-S6 and S6 in 22Rv1 and PC3 xenograft tumors. β-actin serves as a loading control. Sal…physiological saline solution; Met…metformin. G Western blot analysis of AR and PSA in 22Rv1 and PC3 xenograft tumors treated with vehicle or metformin (50 mg/kg; i.p.). β-actin serves as a loading control
Fig. 5
Fig. 5
STAT3 and PTEN are negatively correlated with mTORC1 in PCa. A Heatmaps depicting significant downregulation of STAT3 and PTEN mRNA levels and concomitant upregulation of EIF4EBP1 mRNA expression in prostate carcinoma patient samples (n = 13) compared with healthy prostate gland tissues (n = 8). Colors were normalized to depict relative mRNA expression values (log2 median-centered intensity) within each row; dark blue represents the lowest relative expression level and dark red represents the highest relative expression level. Data were extracted from the Oncomine™ Platform [59] and from the Arredouani Prostate study [55]. B Gene expression levels depicting significant downregulation of STAT3 (-1.57-fold) and PTEN (-1.26-fold) mRNA and concomitant upregulation of EIF4EBP1 mRNA (1.77-fold) in prostate carcinoma patients (n = 13) compared with normal prostate gland samples (n = 8). Data (log2 median-centered intensity) were extracted from the Oncomine™ Platform from the Arredouani Prostate dataset. Representation: boxes as interquartile range, horizontal line as the mean, whiskers as lower and upper limits. C Heatmap depicting significant downregulation of STAT3 and PTEN mRNA levels and concomitant upregulation of EIF4EBP1 mRNA expression in prostate carcinoma patients compared with normal prostate gland samples (log2 median-centered intensity). Data were extracted from the Oncomine™ Platform from the Lapointe Prostate dataset. D Gene expression levels depicting significant downregulation of STAT3 (-1.44-fold) and PTEN (-1.72-fold) mRNA and concomitant upregulation of EIF4EBP1 mRNA (1.37-fold) in prostate carcinoma patients (n = 59–62) compared with normal prostate gland samples (n = 37–41). Data (log2 median-centered intensity) were extracted from the Oncomine™ Platform from the Lapointe Prostate dataset. Representation: boxes as interquartile range, horizontal line as the mean, whiskers as lower and upper limits. E Boxplots representing protein expression of STAT3 and 4E-BP1 in cytoplasmatic or nuclear stainings detected by IHC in normal-like glands or tumors in PCa patient TMAs (n = 83)
Fig. 6
Fig. 6
CREB signaling predicts ADT-resistance and metastatic progression in PCa patients. A Representative IHC images and boxplots representing protein expression of CREB in nuclear stainings detected by IHC in normal-like glands or tumor cells in PCa patient TMAs (n = 83). B Kaplan–Meier analysis of BCR-free survival ratio based on CREB protein expression in a panel of 59 PCa patients (PSA 0.2 ng/L). C Association of CREB expression at predicting time to biochemical recurrence of high/low-risk disease in the resection cohort. Reduced progression-free survival in months of the “high-risk” subgroup (blue) of 161 patients when compared with the “low-risk” subgroup (red) of 161 patients (HR = 1.56 [1.13–2.16]; p < 0.0073). D Association of CREB expression at predicting time to metastatic disease recurrence of high/low-risk disease in the resection cohort. Reduced progression-free survival in months of the “high-risk” subgroup (red) of 161 patients compared with the “low-risk” subgroup (blue) of 161 patients (HR = 2.09 [1.15–3.83]; p < 0.0164). HR = hazard ratio. (E) LNCaP xenograft model was serially passaged in castrated NSG males. WB analysis of AR, p-CREB, CREB, STAT3 protein expression in LNCAP AD/AI tumors. β-actin serves as a loading control
Fig. 7
Fig. 7
Schematic representation of the role of STAT3 in prostate cancer. In a mouse model of PCa with PTEN loss, deletion of STAT3 results in decreased levels of LKB1/pAMPK but increased activation of mTOR signaling, leading to the development of mPCa. In contrast, constitutively activation of STAT3 results in high levels of LKB1/pAMPK and decreased activity of the mTORC1/CREB pathway, thus, preventing the development of cancer in mice with PTEN loss

References

    1. Sung H, Ferlay J, Siegel RL, Laversanne M, Soerjomataram I, Jemal A, Bray F. Global Cancer Statistics 2020: GLOBOCAN Estimates of Incidence and Mortality Worldwide for 36 Cancers in 185 Countries. CA Cancer J Clin. 2021;71:209–249. - PubMed
    1. Carver BS, Chapinski C, Wongvipat J, Hieronymus H, Chen Y, Chandarlapaty S, Arora VK, Le C, Koutcher J, Scher H, et al. Reciprocal feedback regulation of PI3K and androgen receptor signaling in PTEN-deficient prostate cancer. Cancer Cell. 2011;19:575–586. - PMC - PubMed
    1. Hirano T, Ishihara K, Hibi M. Roles of STAT3 in mediating the cell growth, differentiation and survival signals relayed through the IL-6 family of cytokine receptors. Oncogene. 2000;19:2548–2556. - PubMed
    1. Zhang HF. STAT3 in Cancer-Friend or Foe? Cancers. 2014;6:1408–1440. - PMC - PubMed
    1. Priego N, Zhu L, Monteiro C, Mulders M, Wasilewski D, Bindeman W, Doglio L, Martinez L, Martinez-Saez E, Ramon YCS, et al. STAT3 labels a subpopulation of reactive astrocytes required for brain metastasis. Nat Med. 2018;24:1024–1035. - PubMed

Publication types